
《1. Introduction》
1. Introduction
Additive manufacturing (AM, also known as 3D printing) enables the fabrication of components with a geometrical complexity far beyond what can be achieved with conventional manufacturing technologies. Topology optimization, which is particularly known for creating lightweight mechanical components in the aerospace and automotive industries, provides a means for intelligently exploiting this design freedom, making these two technologies an ideal fit. So far, however, topology optimization approaches have only been adapted to a minor degree to the new opportunities and the manufacturing constraints relevant for AM. Infill is an example of a unique feature of extrusion-based AM methods. It allows the creation of structures that are composed of a solid shell with a porous interior, as opposed to completely solid components (Fig. 1). The authors of this paper have recently introduced the so-called coating approach to topology optimization [1]. While standard topology optimization approaches produce solid structures (Fig. 1(a)), the coating approach results in structures with a solid shell and a porous interior, exactly as when using infill (Fig. 1(b)). The coating approach offers no stiffness improvement. However, as shown in this study, it results in a strongly improved buckling load, which is an important element of structural stability. We therefore demonstrate an adaption of topology optimization to AM that has great potential.
Topology optimized components achieved through a standard minimum compliance approach [2] do not take buckling into account. On the contrary, the approach results in tension/compression-dominated configurations and avoids bending members. As the buckling load is closely related to bending stiffness (being proportional for the simple Euler column case), these structures may very well end up being failure-limited by the buckling load rather than by the fracture strength of the material. The problem becomes increasingly pronounced for smaller volume fractions.
《Fig. 1》

Fig.1 Solid versus porous components. (a) Solid component; (b) porous component with solid shell and triangular infill; (c) Hashin-Shtrikman upper bound of stiffness as a function of material density, defining infill properties.
Several works have treated the possibility of including a buckling constraint in the minimum compliance topology optimization problem. The approaches suggested so far, however, have not produced convincing results, or are challenged by clustering of a high number of eigenmodes at the lowest eigenvalue (the buckling load) [3-6]. This clustering implies a need for computing a large number of eigenvalues, leading to a prohibitively heavy computational burden. Instead, the mandatory buckling analysis is usually performed as a post-optimization step rather than as an integrated optimization constraint. If the elastic stability of the component is found to be insufficient, a post-processing may be applied to improve the minimum buckling load; however, this process may lead to sub-optimal components.
Nature provides a number of examples of structures that have an intrinsically high buckling load compared to weight. The most obvious examples are animal bone and plant stems, which are composed of a stiff, solid outer shell with a softer, porous interior. The same concept is exploited in sandwich structures, which are similarly characterized by a high bending stiffness-to-weight ratio and thereby a high buckling load. The high buckling load for structures obtained with the coating approach comes from the same principles. As demonstrated in this paper, the coating approach offers an effective and computationally cheap way of taking advantage of AM infill and thereby ensuring a high buckling load. The study is composed of both a numerical and an experimental part.
《2. Methods》
2. Methods
The objective of this paper is to prove the superior buckling performance of an infill structure compared to that of a solid structure with the same mass. We compare the following two density-based topology optimization approaches: ① a standard projection-based minimum compliance approach, resulting in an almost perfectly black and white structure, and ② the so-called coating approach, resulting in a structure composed of a solid shell with porous infill [1]. To this end, a standard optimization benchmark case is studied: a simply supported beam with a central load at the top edge, known as the MBB beam [7] (further details in Section 2.3). Compliance and buckling load are compared for the optimized structures. The buckling analysis involves both a numerical and an experimental comparison. The study is restricted to 2D for clarity. However, 3D effects from experimental tests are taken into account, and the full study can be readily extended to 3D.
《2.1. Optimization problem》
2.1. Optimization problem
The optimization problem is a standard minimum compliance problem with a constraint on the volume. The discretized problem is defined as follows:

where, µ is the vector of design variables; c is the compliance; K is the global stiffness matrix (defined in the usual way for density-based topology optimization as a sum over element stiffness matrices, each depending on the interpolated stiffness); U and F are the global displacement and force vectors, respectively; g is the volume constraint; V( µ) is the material volume; V* is the maximum allowed volume.
Design updates are performed based on analytically calculated gradients and a mathematical programming-based updating scheme, the method of moving asymptotes (MMA) [8]. Gradient expressions are omitted here for brevity (for details, see Ref. [2]).
《2.2. Designing with the coating approach》
2.2. Designing with the coating approach
Both the standard topology optimization approach and the coating approach permit the control of the macro-level structural feature size through the application of filters. These include smoothing using a partial differential equation (PDE)-based density filter [9] and projection of intermediate design fields in order to push the smoothed problem toward discrete designs [10-[12]. The degree of smoothing is determined by the filter radius R (as defined in Ref. [11]), while the projection is determined by the threshold, η, and sharpness, β.
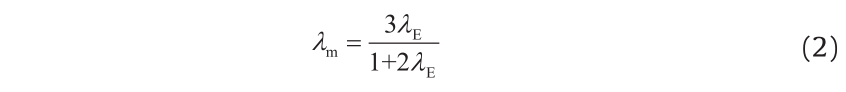
In addition to this control of the macroscopic feature size, the coating approach possesses several levers for designing solid shell structures with porous infill. The skin thickness, tref, determines the solid shell at the structural surface. Infill is modeled using the homogenized properties, that is, the effective macroscopic properties of the periodic infill structure. This permits the inclusion of the fine microstructure into the numerical model in a computationally feasible way. Two homogenized parameters are sufficient to describe the homogenized infill: density and stiffness. These parameters are expressed as ratios of the solid material's properties, noted as λm and λE, respectively. The relation between the two parameters must satisfy the Hashin-Shtrikman (HS) bounds in order to be physically meaningful [13]. We apply a triangular infill structure that is assumed to exactly reach the HS upper bound [14]. For the 2D case, the relation between the density and stiffness of the infill, shown in Fig. 1(c), is given by Ref. [15]:
Note that this relation is based on the assumption that the solid material has a Poisson's ratio of 1/3. However, for lower volume fractions where the infill structure behaves as a tension/compression-dominated triangular honeycomb, the influence of the Poisson's ratio of the solid material is negligible.
《2.3. Test designs》
2.3. Test designs
The chosen test case is the so-called MBB beam benchmark problem: a simply supported beam of uniform thickness with a length-to-width ratio of 6:1, loaded at the central point of the top edge. The numerically optimized structures are shown in Figs. 2(a) and (b). The domain size is 300 mm by 50 mm, with a thickness of 15 mm. The allowed volume fraction is 25% for both designs. The discretized model uses bilinear square elements with a side length of 0.5 mm. The skin thickness, tref, is chosen as 1 mm, while the smoothing of the design field is performed with a filter radius of R = 10 mm. A symmetry condition is utilized during optimization; however, for the buckling analysis, the full model is used in order to capture asymmetric modes. We choose a relative stiffness for the porous material of 20% of solid, that is, λE = 0.2, implying λm = 0.43. The remaining input parameters for filters and penalization follow the values used in Ref. [16].
《2.4. Part fabrication》
2.4. Part fabrication
The test specimens, shown in Figs. 2(c) and (d), were additively manufactured by means of the fused filament fabrication (FFF) technique, using a MendelMax 2 from MakersToolWorks, USA, with an E3D v6 extruder hot end. The print material was styrene-ethylene-butylene-styrene (SEBS)† , a thermoplastic elastomer (TPE) with an elongation at break of 500%; that is, with sufficient flexibility to observe buckling modes without breaking the test specimen. Since SEBS is a viscoelastic material, the datasheet provided by the supplier states no Young's modulus. Shore A and shore D hardness values are stated as 92 and 40, respectively. The filament was extruded with a layer height of 0.2 mm and an extrusion width of approximately 0.5 mm. The unit cell size in the infill is determined from this extrusion width (which is equal to the cell wall thickness) and the macroscopic density, λm (see Section 2.7). Being a filamentary technique, the FFF process produces parts with some anisotropy, as observed for the similar fused deposition modeling (FDM) technique [17]. However, for simplicity, the material will here be assumed to be isotropic linear elastic. This assumption is discussed in Section 4. The effective material parameters will be determined experimentally.
† Super Premium 1.75 mm SEBS, provided by Boots Industries Inc.
The fabricated porous specimen turned out to be slightly heavier than specified with the volume constraint, as the actual printed infill was denser than the specified value of 43%. The skin thickness was validated by means of a digital caliper. The additional volume appeared to be due to an inaccuracy between the slicer software settings and the extruded filament width in the infill. Therefore, this volume difference was accounted for in the numerical model by attributing all of the additional mass to the infill. During optimization, a 20% infill stiffness was used. The corrected, actual density was 52% of solid, implying a stiffness of 27%. This stiffness value was used in the finite element model for the comparison with experimental results. This slight increase does not have a major influence on the performance comparison.
《2.5. Experimental setup》
2.5. Experimental setup
The experimental measurements consisted of two parts: ① the determination of effective material parameters, and ② the determination of buckling loads. The two parts were carried out using different test setups, both based on a three-point bending test, as shown in Figs. 3(a) and (c).
For determining material parameters, a steel bracket was placed at the loading point of the beam, as shown in Fig. 3(a). The load was applied by adding weights of 100 g to a basket attached to the steel bracket by means of a string (the basket is not visible in the figure). The displacement of the loaded point was measured directly on the loading bracket by means of a dial indicator with a precision of 0.01 mm. Since the beam in this test was loaded only within the linear domain, the zero point could be set arbitrarily.
《Fig. 2》
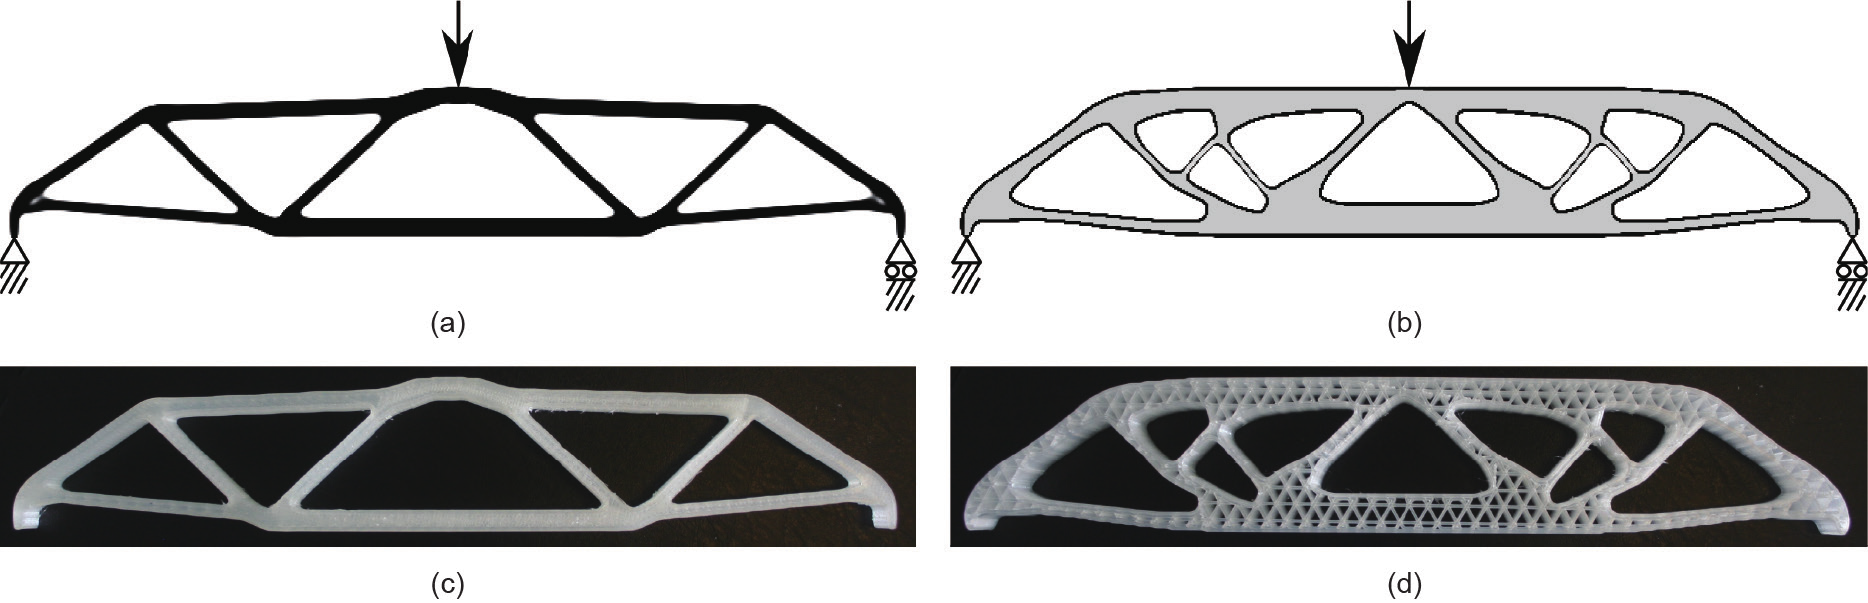
Fig.2 Test specimens: designed (a, b) and fabricated (c, d) specimens. Left: solid specimen (standard minimum compliance). Right: porous specimen with triangle infill (coating approach).
《Fig. 3》

Fig.3 Experimental setup and effective material parameters. (a) Manual setup for determination of effective material parameters; (b) experimental curves obtained with the setup from (a), see Section 3.1; (c) setup for measuring buckling loads using an electromechanical testing machine.
The buckling load for each specimen was determined using an electromechanical testing machine (Instron 6022, retrofitted to 5500R) with a 10 kN load cell, shown in Fig. 3(c). A displacement controlled loading was applied at a speed of 1.5 mm·min-1. Other displacement rates were applied for validation (see Section 4). Data were sampled at a rate of 20 measurements per second.
The reason for using a different setup for the two parts was that the 10 kN load cell was found to be accurate only for forces above 20 N (error below 2%). The forces used to determine the material parameters only went up to just over 5 N.
《2.6. Numerical buckling analysis》
2.6. Numerical buckling analysis
The load at which buckling occurs is referred to as the critical load, Pc. A linear buckling problem is solved as an eigenvalue problem using finite element analysis (FEA) [18]:

The geometric stiffness matrix Kσ( uref) depends on the displacements (stresses) obtained from the linear, static equilibrium problem solved for a reference load, Kuref = Fref. The critical load, Pc, equals the smallest root, λc, of the problem multiplied by the reference load. The associated buckling mode is given by Φ. Note that for a linear buckling problem, only the mode is given, not the amplitude (and thereby the actual displacements).
Initial experiments revealed that out-of-plane buckling modes would appear for the porous model. For this reason, the numerical 2D model used for the optimization was complemented by a 3D Abaqus model for comparison with the printed samples, and 8-node trilinear brick elements were used (Abaqus C3D8 elements). The discretization for the 2D model using a square element layout was reused in the 3D model ( x and y directions). The model was extruded the sample thickness of 15 mm into the z direction, using the double element side length in order to keep the number of degrees of freedom low. The final discretization thus consisted of elements with the dimensions 0.5 mm × 0.5 mm × 1.0 mm. The infill was modeled as a solid material using the homogenized infill properties, rather than being represented as the actual printed triangular structure. This assumption is discussed in Section 4.
The load was distributed equally over an area corresponding to 80 nodes. In addition to the supports defined for the 2D problem, the central loaded node was constrained from performing out-of-plane motion ( u3 = 0). This boundary condition corresponds to friction between the force actuator and the test specimen, implying that several out-of-plane buckling modes are prevented.
First, an eigenvalue analysis was performed, as defined in Eq. (3) (Abaqus: “Linear perturbation, Buckle”). This analysis was refined by tracing the geometrically nonlinear response of the structure using an arc-length method (Abaqus: “Static, Riks”). For each case, an asymmetric load perturbation was introduced as an imperfection with a magnitude of 1% of the buckling load predicted by the eigenvalue analysis. The buckling load values reported here are the results of the nonlinear analysis, which for all cases was less than 2% below the linear analysis.
《2.7. Infill buckling properties》
2.7. Infill buckling properties
Although our hypothesis was that the macroscopic buckling load would increase significantly with decreasing infill percentage, the infill itself is known to become more prone to local buckling failure as the density decreases. The “buckling strength” of triangular infill can be predicted for a general macroscopic in-plane stress state [19].
Fig. 4(a) illustrates the triangle infill. Fig. 4(b) shows a zoom on a unit cell, indicating the triangle side length L and the cell wall thickness t. Note that the orientation follows what is used for the physical model. The buckling strength of a triangular infill is known to depend on the ratio ( t/ L)3 [19]. Given the regular triangle shape and constant parameters, only two of the parameters L, t, and λm are independent. Ignoring the overlap of triangle corners, the third parameter depends linearly on the two other parameters. The infill buckling strength therefore depends on  .
.
While the elastic properties of the infill are assumed to be linear isotropic, the buckling strength depends on the principal stress directions. For uniaxial loading directed along one of the triangle wall orientations, the buckling strength reduces to a simplified expression [20]. Assuming a load parallel to the x-axis, the buckling strength is given by

The following discussion describes how the infill buckling strength for the design problem studied in this work can be estimated for any allowed infill density λm ∈ (0,1]. Note that several assumptions are specific for this design problem.
The fully solid structure may be approximated by a frame model, and given the triangle-based layout, even by a truss model. This is a natural outcome of the topology optimization process, which distributes material such that bending of any internal structure is minimized. This observation is supported by the distribution of the (absolute) maximum principal stress value, shown in Fig. 4(d), which is nearly constant over the individual beam cross-sections, except for minor irregularities due to the discretization.
Assuming that any value of the infill density would lead to an optimized structure with the same topology as the fully solid model, and assuming that this optimized structure may be modeled using the same linear truss model, the normal force carried by a given structural member is unchanged (for a given external load). However, the cross-section changes from being fully solid to having a porous interior with a smaller homogenized stiffness. This means that the macroscopic axial stresses in the given bar are lower in the infill than in the corresponding fully solid bar by a factor depending on the skin thickness and infill density, while stresses in the solid shell are higher. By multiplying the in-plane stress state for a bar in the fully solid structure with this “infill stress factor,” plotted in Fig. 4(c), the in-plane stress state for the corresponding bar in a porous structure of any infill density is therefore known.
《Fig. 4》

Fig.4 Estimation of infill stability. (a) Triangle infill structure with a single unit cell indicated; (b) unit cell geometric parameters; (c) “infill stress factor” relating macroscopic stresses in the infill with stresses in an equivalent fully solid structure; (d) distribution of (absolute) maximum principal stress. Green is compression and red/orange is tension.
The bar indicated by the arrow (or the corresponding bar, mirrored about the vertical symmetry line) in Fig. 4(d) has the highest absolute principal stress among the bars in compression. For this bar, the stress state is approximately uniaxial along the x-axis, which reduces the buckling strength to the simplified expression in Eq. (4). The ratio between this expression and the normal stress in the bar corresponding to a unit load thus provides the critical load for any infill density.
In addition, the solid shell might suffer from local buckling before macroscopic buckling occurs; however, the shell buckling strength has not been modeled in this study.
《3. Results》
3. Results
This section presents the numerical results as well as the experimental validation. Reasons for deviations are discussed in Section 4. In accordance with the definition of the optimization problem, all force and displacement values concern the vertical components for the central loaded point, that is, the top center node.
《3.1. Effective material parameters》
3.1. Effective material parameters
The numerical model was calibrated by determining effective values for the Poisson's ratio, ν0, and the Young's modulus, E0. Following the assumption of a linear elastic material, both values are assumed to be constant. The calibration was based on the solid component. In accordance with the optimization, the effective stiffness for the porous phase is assumed to follow the HS upper bound (Eq. (2)).
The Poisson's ratio for SEBS is known to be close to 0.5, like that of rubber [21]. To assess the sensitivity of the results with respect to Poisson's ratio, two runs of the Abaqus model were performed; these runs were identical except for the use of ν0 = 0.45 in one versus ν0 = 0.49 in the other. Displacement from a 1 N load differed by 0.1%, giving a measure of the uncertainty with respect to E0. The first critical load differed by 1%. These uncertainties are small compared to other sources. This result confirms the observation made earlier in this paper that topology optimized structures exhibit members that are mainly in pure tension/compression states and are hence largely independent of Poisson's ratio. Therefore, it was simply assumed that ν0 = 0.49.
The effective Young's modulus, E0, was determined by fitting the response of the numerical model to the experimentally observed response. The experimental force-displacement curve, shown in Fig. 3(b), was found to be perfectly linear for the applied range of forces up to 5.3 N. A series of six measurements was performed and the curve was fitted to the average value, with error bars indicating the minimum and maximum value observed. The slope was determined to be aexp = 5.92 N•mm-1 with a squared correlation coefficient of R2 = 0.9999. The numerical test beam was evaluated using a geometrically nonlinear model; however, the linearity observed in the experiments was also found in the numerical model. Therefore, the Young's modulus was fitted based on a single force-displacement evaluation, using a 1 N load, by the relation (1 N)/ uout = aexp, where uout is the output displacement. The modulus was fitted to E0 = 65.7 MPa. Taking the viscoelastic nature of the material into account, this number is within the expected range based on the shore hardness values provided by the manufacturer.
The force-displacement diagram in Fig. 3(b) also includes data for the porous structure. Again, an almost perfectly linear behavior was observed in the experiment (R2 = 0.9994). The stiffness measured for the porous structure was 10% below the value measured for the solid structure. The numerical analysis of the porous structure predicted a stiffness that was 6% less than the measured value. This minor deviation is discussed in Section 4. Note that this data refers to the actual printed structure, with an infill stiffness of 27% of solid, instead of the 20% stiffness that would correspond to a mass that was equal to that of the solid structure. A numerical analysis using 20% stiffness indicates that the comparable stiffness would be 23% below that of the solid structure.
《3.2. Buckling performance》
3.2. Buckling performance
For the buckling analysis, recall that the structures studied in this work were optimized using a 2D model and fabricated to investigate in-plane properties. Deviations between numerical and experimental results are discussed in Section 4.
The results of the buckling analysis are summarized in Fig. 5. In Fig. 5(a), the numerically determined nonlinear response is compared with the experimentally obtained buckling loads for the solid and porous structures.
《Fig. 5》

Fig.5 Buckling analysis. (a) Comparison of the geometrically nonlinear numerical response (curves with arc-length steps indicated) with experimentally observed buckling loads (two lower horizontal dashed lines); (b)-(d) numerically determined mode shapes corresponding to curves in (a); (e) experimental response of the porous structure to a load of 100 N, indicated by the upper dashed line in (a); (f) and (g) experimental mode shapes corresponding to numerical shapes (c) and (d), with buckling load indicated by the two lower dashed lines in (a).
For the solid structure, the numerical buckling load was determined to be 23.2 N, whereas the experimental buckling load was determined to be 29.8 N. The corresponding mode shapes are very similar, as seen in Figs. 5(d) and (g), respectively. As expected, the mode shape is initiated by buckling in the bar found to be subjected to the highest normal stresses—the bar indicated by an arrow in Fig. 4(d).
For the porous structure, an out-of-plane twisting mode appeared before the first in-plane mode, as shown in Fig. 5(f). The measured buckling load was 64.3 N. This twisting mode is also permissible in the 3D numerical model, with only a single loaded node restricted from out-of-plane translational motion. The model predicted a nearly identical out-of-plane mode shape at a load of 65.1 N, as shown in Figs. 5(a) and (c).
The relevant mode shape of the porous structure for this study is the first in-plane mode. In order to prevent the twisting mode from appearing, two U-shaped steel brackets with the legs separated by 15.2 mm were mounted around the porous specimen, as shown in Fig. 5(e). The bracket legs were 19 mm wide and placed symmetrically about the component center plane at a distance of 65 mm apart. A 10 kg weight was attached to the load-transferring steel bracket, with the total mass corresponding to a load of 100 N. The displacements of the specimen did not appear to be noticeably constrained by the friction between the bracket and the specimen. As indicated in the figure, the porous structure still did not buckle at this load; however, local instability was initiated. Therefore, the in-plane mode shape was not obtained experimentally. Using the numerical model, the in-plane buckling load was determined to be 126 N with a mode shape quite similar to that of the solid structure despite the different topology, as shown in Fig. 5(b). The excellent agreement between the experimental and numerical results for the out-of-plane twisting mode shape supports the correctness of the numerically determined in-plane buckling load.
The relevant values to compare are the critical loads corresponding to in-plane modes, as the out-of-plane mode is simply an artifact of extruding the 2D model into 3D without making any modifications to support the structural stability. The buckling load of the porous structure is 5.4 times higher than that of the solid model, using the numerically determined values. Values for the out-of-plane twisting mode of the porous structure have been included in the figure in order to support the validity of the numerically determined in-plane buckling load.
《3.3. Influence of infill density》
3.3. Influence of infill density
Fig. 6 compares the numerical performance of the two previously presented structures to that of three other structures optimized with identical parameters and volume constraint, but now using an infill stiffness of 40%, 60%, and 80%, respectively. These stiffness values correspond to volume densities of 67%, 82%, and 92%, respectively, as shown in Fig. 6(a). The buckling load values for Fig. 6(b) are determined using a 2D linear buckling analysis, as described in Section 2.6. The 2D model gives slightly lower values for the buckling load; however, the ratio between solid and porous remains very close to the values obtained for the in-plane modes of the 3D model (a ratio of 5.3 instead of 5.4). It is clear that, while the structural stiffness decreases close to linearly (that is, compliance increases) when using lower infill percentages, the buckling load improves remarkably. This result is due to the fact that lighter infill implies wider structural members, and that bending stiffness increases with a power of three of the perpendicular distance from the center axis. The reason that the improvement in buckling load is so small for the higher infill percentages is that the HS bound curve has a steep slope, close to ρ = 1, meaning that only a little additional beam width is gained from the sacrificed stiffness. It should be noted that the different topology of the structure with λE = 0.2 compared to the other four structures is not the only reason for the high buckling load: A test run using a different starting guess resulted in a structure with the same topology as the solid structure. This structure's critical load was 4.5 times higher than that of the solid structure, as opposed to 5.3 times higher.
Fig. 6(b) includes an estimate of the stability limit of the infill as a function of infill density, determined as described in Section 2.7. Only structures with a macroscopic, relative buckling load below this curve can be expected to retain local stability.
《4. Discussion》
4. Discussion
The experimental results clearly validate our hypothesis that structures obtained by the coating approach exploiting AM infill have considerably higher buckling loads than structures obtained using the standard minimum compliance approach. There are, however, a few minor deviations.
The two major assumptions used for the numerical models were that SEBS is a linear elastic material and that the infill is homogeneous and isotropic, and satisfies the HS upper bound.
《Fig. 6》

Fig.6 Dependency for buckling load and compliance on infill density. (a) Sequence of structures, optimized with identical parameters except for infill density; (b) buckling load and compliance for the sequence of structures from (a). For reference, an estimated infill stability limit is included. Values are normalized by values for a fully solid structure (structure 5).
The assumption that the printed SEBS is a linear elastic material is a rough idealization, ignoring at least three effects: viscoelasticity, which was observed during experiments; strain dependency for Young's modulus, which was difficult to distinguish from viscoelastic effects given the simple test setup; and anisotropy in the specimen due to the filamentary printing technique.
The viscoelasticity manifested itself in a dependency on deformation rate for the stress-strain curve and a significant degree of creep. In the manual setup shown in Fig. 3(a) that was used to determine E0, the loads were applied practically instantaneously in order to minimize creep effects. The testing machine measurements of the buckling load, which are shown in Fig. 3(c), were subsequently validated with measurements performed at a higher strain rate (5 mm•min-1) and measurements performed using the manual setup. The former indicated a slightly higher buckling load and the latter a slightly lower load, but both measurements were within 10% of the reported value. Based on these observations, the viscoelastic effects are assessed to be the major source of uncertainty in the experiments. Missing an account for these effects would tend to imply an overestimation of measured displacements, which implies an underestimation of the fitted Young's modulus and thereby of the numerically determined buckling load. This might explain some of the deviation that was observed for the solid structure.
Strain dependency for Young's modulus could influence the calculated values in both directions. As mentioned earlier, this effect was difficult to distinguish from viscoelastic effects given the simple test setup.
Anisotropy due to the filamentary printing technique has a negligible effect on the porous structure, as both the skin and the infill are printed with extrusion paths that are parallel to the local loading direction, with only two (for the skin) and one (for the infill structure) filament paths. Therefore, anisotropy is mainly relevant in the solid structure; however, the effect is less critical in a frame-like structure, as all bars are printed with the same extrusion pattern: The interface is printed in the longitudinal direction while the interior is printed with a transversal pattern. In a sense, the solid structure could be viewed as a porous structure with full density but slightly decreased stiffness in the interior due to the anisotropy. An estimation of this decreased stiffness is, however, beyond the scope of this paper, and the effect is to some extent taken care of by experimentally fitting the effective material parameters. Note that when extending to 3D designs, anisotropic effects in the direction normal to the layers will be stronger than within the plane of the layers. However, the degree of anisotropy depends on the chosen AM technology and may to some extent be alleviated through heat treatment [22].
In addition, the assumption that the infill is homogeneous and isotropic and satisfies the HS upper bound is rather rough. The actual printed, triangular infill is clearly not separated in scale from the macro structure, meaning that the infill should really have been considered as individual, structural members rather than as a homogenized material. However, Ref. [23], for example, reports that the use of homogenized properties may be a reasonable approximation even when using a few unit cells. Furthermore, the infill triangle geometry is badly realized along structural edges, causing an uneven distribution of material. This results in an inaccuracy, particularly for thin members. The infill is an important source of anisotropy for the porous structure.
The two most important deviations between the numerical model and the experiments were that the numerical buckling load for the solid structure was about 20% smaller than the experimental value; and that the numerically predicted stiffness for the porous structure was 6% lower than the measured stiffness. Compared to the increase in buckling load of a factor of five, these deviations are small and in no way alter the conclusions of the study. It is clear that the gain in buckling load is inherent to the coating approach and is not limited to the MBB beam. The infill stability curve in Fig. 6(b) indicates that the 20% infill stiffness structure might be close to the optimal trade-off between local and global buckling strength. Note, however, that this statement builds on a number of assumptions—not only the assumptions stated in relation to the derivation of the infill stability curve, but also the assumptions that the infill is homogeneous and isotropic and satisfies the HS upper bound.
《5. Conclusions》
5. Conclusions
It has been shown that the coating approach to topology optimization allows the exploitation of AM infill to create components that possess substantially improved buckling properties compared to those of structures that are optimized with the standard minimum compliance approach. In the specific MBB beam test case, the buckling load for the porous structure was more than five times that of the solid structure, for a decrease in stiffness of about 20%-25%. This gain in buckling load is due to the porous infill, which leads to wider structural members and thus components with an inherently larger bending stiffness-to-weight ratio.
The numerical results were backed by experimental measurements performed on additively manufactured test specimens. The measurement results were associated with some uncertainty, mainly because of rough assumptions on the material properties of the test specimens. However, the trends of the results are very clear, and the deviations are small compared to the performance differences.
Going beyond the studied test case, a few remarks regarding relevance for future work should be stated. The porous component attained such a high in-plane buckling load that the structure was failure-limited by local buckling (due to a load concentration) rather than global buckling. More generally, local buckling failure in the infill is likely to occur before global buckling if the infill density is chosen to be too low. The out-of-plane buckling of the porous structure showed the need for designing experiments based on a full 3D structure.
This study demonstrates how topology optimization may be adapted to AM-specific manufacturing opportunities and provide remarkable improvements in structural performance.
《Acknowledgements》
Acknowledgements
The authors wish to thank Nina Høgh Jensen for performing initial experimental work, Dane Shea at Northern Layers for fabricating the test specimens, and Christian Peter Rasmussen from Department of Civil Engineering at the Technical University of Denmark (DTU) for assisting with mechanical tests. We wish to thank Erik Andreassen for assistance with Abaqus and for valuable input on the work. The authors acknowledge financial support from the Villum Foundation (the NextTop project) and Department of Mechanical Engineering at DTU.
Anders Clausen, Niels Aage, and Ole Sigmund declare that they have no conflict of interest or financial conflicts to disclose.


 京公网安备 11010502051620号


