

《1. Classification of existing intelligent city evaluation systems (ICESs)》
1. Classification of existing intelligent city evaluation systems (ICESs)
《1.1. Features of existing ICESs》
1.1. Features of existing ICESs
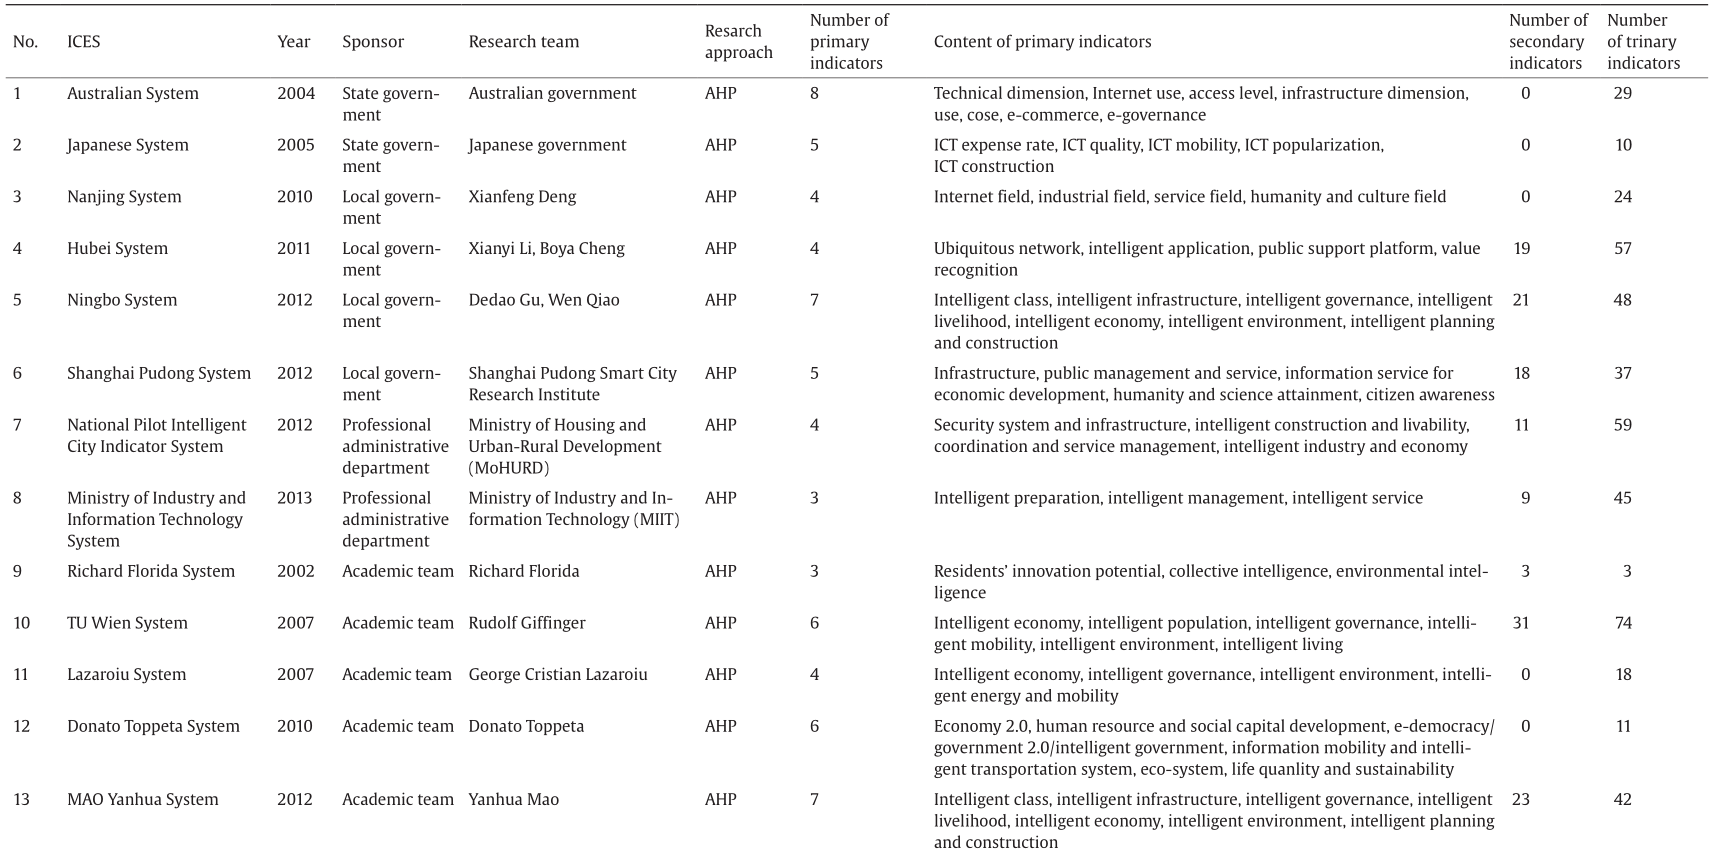
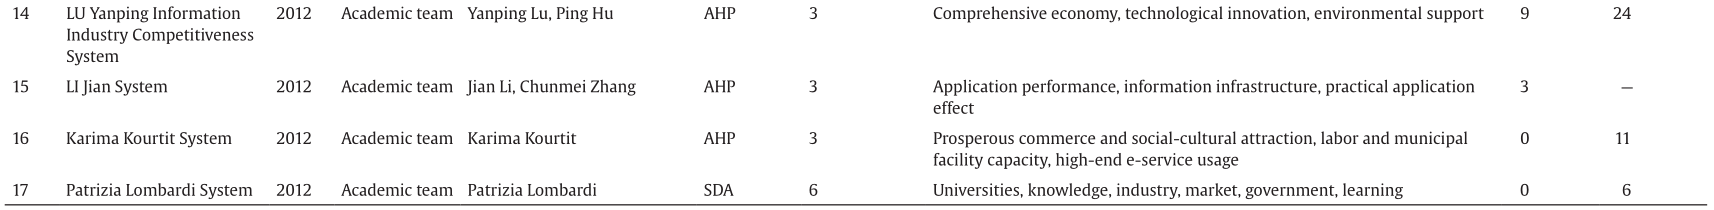
Because intelligent city evaluation systems (ICESs) are established with diverse purposes, by multiple subjects, and for diverse objects, there have been no unified standards for ICESs on a global scale [1]. Currently, 38 independent ICESs can be identified worldwide, having been established in East Asia, Europe, North America, and Oceania. The creation of these 38 systems involves 20 university research teams, 8 governmental departments, and 10 business enterprises and associations, and covers the time period from 1995 to 2015, see Table 1 [2–23]. Some systems, such as the TU Wien System [2] and the Intelligent Community Forum (ICF) System [3], are still under continuous development.
The tertiary indicators of these 38 systems are all quantifiable. Only 17 of the 38 consist of integrated primary, secondary, and tertiary indicator systems, and out of these 17 only the GONG Bingzheng System [24] and the China Wisdom Engineering Association System [25] have quantifiable secondary indicators. Therefore, for practical purposes, contradictions can occur between the assessment results derived from secondary indicators and the results derived from tertiary indicators within the same evaluation system. Of the 38 ICESs, 17 consist of only primary and tertiary indicators; and the systems of IBM and NSCI are relatively exceptional cases, both of which feature a matrix format [26].
《Tab.1》
Tab.1 The 38 intelligent city evaluation systems (ICESs) from around the world.
continued

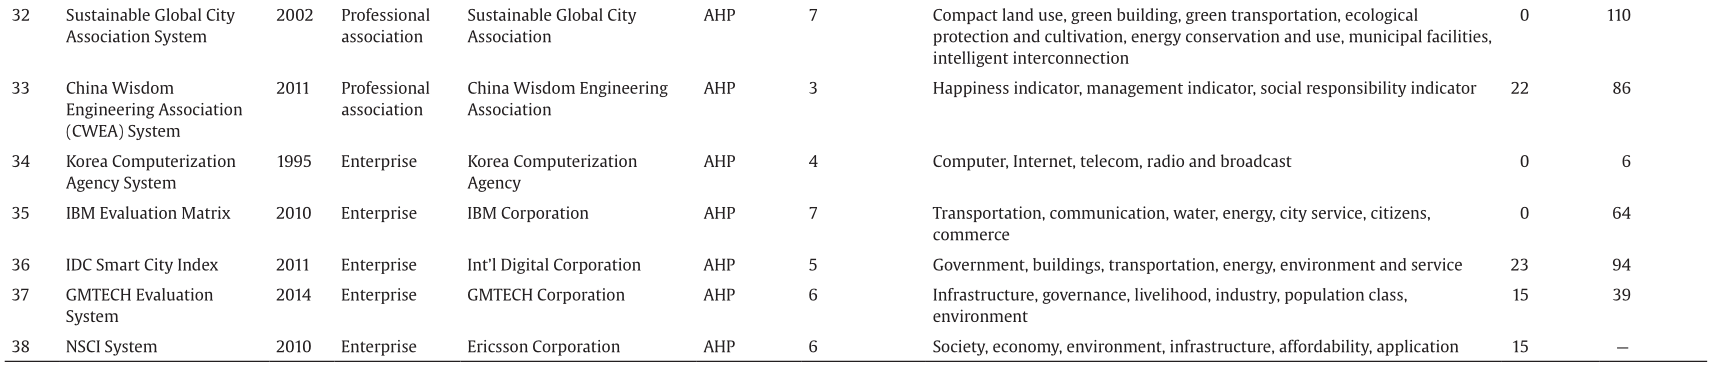
Table by City IQ research team, 2013, 2014, 2015. Source: Refs. [2–23].
ICT: information and communications technology; AHP: analytic hierarchy process; SDA: structural decomposition analysis; MCA: multi-criteria analysis; FCE: fuzzy comprehensive evaluation; ANP: analytic network process; TOPSIS: technique for order preference by similarity to an ideal solution; GRA: grey relational analysis; BP: back propagation.
The content of the indicator dimensions reflects the key elements of a specific ICESs [27], and is thus of value as an orientation function. A quantitative study of 20 indicators selected before 2013 concluded that the first three most-indicated aspects in different evaluation dimensions are: intelligent infrastructure construction, intelligent governments, and intelligent citizens [28]. In terms of evaluation dimensions, the 38 systems consider the additional dimensions of intelligent industries and an intelligent environment, both of which are highly associated with iCity practices [29].
The approaches applied to the development of an evaluation system are basically implied by the structuring mode of this system. The creation of an indicator system that consists of three integral hierarchies, such as the analytic hierarchy process (AHP) or Delphi method, often employs the regular method of subjective evaluation and a combination of expert seminars. This approach can better utilize expert resources and expertise [30] and can combine qualitative and quantitative factors in the comprehensive consideration [31]. Evaluation systems that do not include evaluation standards, such as grey relational analysis (GRA), principal component analysis (PCA), technique for order preference by similarity to an ideal solution (TOPSIS), and fuzzy comprehensive evaluation (FCE), normally apply an objective evaluation approach, with the purpose of bestowing weights and removing the impacts of indicators that have relatively large relevance [31]. This approach avoids interference from human factors caused by secondary classification or quantization, and directly realizes the transformation from dimensions to indicators and the selection of indicators.
《1.2. Deficiencies of current ICESs and some consequences》
1.2. Deficiencies of current ICESs and some consequences
In addition to experiences drawn from other ICESs, this research also looks into the deficiencies of current systems, which are further classified and analyzed in the four aspects of content setting, approaches, data source of indicators, and evaluation results.
1.2.1. Deficiencies due to ICES developers
The first category of deficiencies frequently occurs in ICESs developed by city governments. Government inventors tend to set up indicators according to the development level and standards of their respective cities. Therefore, such ICESs are created with a poor universality and are incapable of evaluating other cities. The Nangjing System, the Ningbo System, and the Shanghai Pudong System fall into this category.
The second category of deficiencies occurs in ICESs developed by state governments. These state evaluation systems are set up through top-down processes and are adopted to the development status and value orientation of individual countries. Thus, they are not universally applicable and are not well grounded in transnational comparisons [28]. The early-developed Australian System and the Japanese System fall into this category. However, state government ICESs appear to gradually evolve into what this research concludes to be a third category.
The third category of deficiencies is frequently seen in ICESs developed by professional enterprises or professional administrative departments of state governments. ICES developers of this category are usually benefit-oriented and pursue ICES development for their respective agencies. They also tend to incorporate local factors into their indicator systems, resulting in poor universality of these systems. The GMTECH Evaluation System and the China Wisdom Engineering Association (CWEA) System fall into this category.
ICESs developed by academic teams usually portray the development of intelligent cities from a more objective perspective. The City IQ Evaluation System research team has invited 275 experts from 14 high-end research institutes, including the Chinese Academy of Engineering, the National Academy of Science and Engineering (Germany), the Royal Swedish Academy of Engineering Sciences, the Planning Management Center of the Ministry of Housing and Urban-Rural Development (MoHURD) of China, and the Development Research Center of the State Council of China, to participate in the development course of the City IQ Evaluation System in order to ensure impartiality and a scientific approach of the research, which are preconditions of the universal applicability of the City IQ Evaluation System.
1.2.2. Absence of core ideology and deficiencies in dimension setting
In the content setting of current systems, a benefit evaluation and a concern for software are frequently missing. Indicators are often selected to measure inputs rather than the benefit and effectiveness of an iCity [32]. Some software aspects of the construction of intelligent cities are often overlooked as well, such as a concern with human factors [32], a concern with driving forces for the development of intelligent infrastructures from the perspective of users [33], or the use status of public service facilities [34]. In general, the majority of current systems focus more on the objectification of the course while overlooking the core supporting conceptions required by an indicator system. Therefore, in the design of the City IQ Evaluation System, a wider range of factors has been balanced, and responses to both hardware and software aspects are integrated into the City IQ Evaluation System.
1.2.3. Deficiencies in approaches
Both the description of indicator systems by expert groups and the choice of approaches affect the composition of indicator systems [30]. Therefore, although the Delphi and the expert seminar approach are frequently applied to design indicator systems, the evaluation results could be invalid due to a weak influence or authority of the involved experts or assessment institutions [35].
In addition, it is also noted that although the coexistence of quantitative and qualitative indicators could be realized through AHP [31], uncontrollable subjective interference could appear in the process [30]. Therefore, in the development of an ICES, it is critical to combine both qualitative and quantitative approaches [36] as well as taking full advantage of expert resources via an innovative process design.
1.2.4. Deficiencies in indicator selection and data source
Current indicator systems tend to contain deficiencies regarding their data sources and indicator results in the following aspects: First, the same indicators addressing different objects are selected from different data sources [37]; second, the data sources require a relatively long renewal cycle and thus are unfurnished for a dynamic adjustment [36]; third, data from governments tend to be unreliable [37]; and fourth, the authenticity of indicator data that are not firsthand is questionable [38]. In addition, the results of some indicator systems are not relative numbers and therefore provide no comparability [38]. To avoid these deficiencies, this research intensifies the reliability, openness, real-time access, and assessment of indicator data sources; and it is demanded that indicators of the same evaluation item are selected from common sources. The indicator results are displayed in relative numbers to produce results with better comparability and rationality.
《2. Conception, research approaches, and development aspects of the City IQ Evaluation System》
2. Conception, research approaches, and development aspects of the City IQ Evaluation System
《2.1. Core conception: The intelligent city-being》
2.1. Core conception: The intelligent city-being
Many of the ICESs discussed in this research are structured on theories of sustainable development, informatization, and ecologicalization. For example, the Patrizia Lombardi System is structured by the Triple Helix theory of development [1]. Some ICESs are even established without core supporting theories but are composed of indicators describing technological aspects, urban informatization levels, or hardware constructions.
The City IQ Evaluation System research is structured around the critical understanding that an intelligent city evaluation system should be based on the core value, cognition, and theories of the iCity. This means that an evaluation system should address the four circulatory phases of an iCity—sensing, judging, reacting, and learning (Fig. 1)—as required by the philosophy of urban evolution and the value added by the intelligent development of cities [39]. It should also be capable of pushing forward the continuous intelligence course of cities.
•Comprehensive sensing refers to the real-time grasping of the demands and changes of individual cities and subjects with the support of sensing, conduction infrastructure, and sufficient data and computing. Urban information is sensed via sensor networks, communication networks, and mobile Internet with the aid of radio-frequency identification (RFID), infrared sensors, and the global positioning system (GPS).
•Precise judging on the basis of comprehensive sensing is capable of timely automatic identification, data filtering, calculation, and judgement of any information generated by any changes in a city.
•Proper reacting based on precise judging is capable of urban prospect prediction, resource mobilization, plan generation, and realization of the minimal consumption of energy, resource, and time; it can also take social concern into account.
•Autonomic learning of an iCity means its reflective learning, sensing, upgrading, and improvement in its decision-making mode and process after the previous three phases. Sustained advancement and intelligence at a higher level is realized via autonomic learning.
Most scholars would probably agree with the idea of intelligent cities as intelligent city-beings are capable of self-organizing, self-adaption, and evolution [40]. Social innovation led by self-organization and learning is the indispensable part of an iCity [2]. Regarding an understanding of the nature of the intelligent city-being and its four significant components, the City IQ Evaluation System research team makes innovations in the principle and approaches of system structuring.
《Fig. 1》

Fig.1 The core conception of iCity development.
《2.2. Innovation in inventing City IQ Evaluation System 1.0》
2.2. Innovation in inventing City IQ Evaluation System 1.0
The new system is named the City IQ Evaluation System because it regards an iCity as an intelligent city-being and measures its four components. The first version, City IQ Evaluation System 1.0, was created in 2013. City IQ Evaluation System 2.0 was developed in 2014 after improving the universal applicability, openness, and dynamic data sources of version 1.0. In 2015, City IQ Evaluation System 2.0 was further standardized by applying deviation evaluation methods in assessment results, leading to City IQ Evaluation System 3.0. This part of the paper mainly elaborates on the conception of City IQ Evaluation System 1.0, with a focus on the five steps of primary indicators acquisition, indicator dimensions setting, indicators selection, indicators adjustment, and standardization.
2.2.1. The ring of primary indicators: 220 basic indicators collected from three channels
To include primary indicators in a range that is as wide as possible, the City IQ Evaluation System research team has set up an indicator ring from three channels: experts’advice, indicator bases of other systems, and proposals by the City IQ Evaluation System research team. The City IQ Evaluation System capitalizes on the maximal use of its expert resources: The research team has set up an expert base, inviting 275 experts from 14 high-end research institutes, including the Chinese Academy of Engineering, the National Academy of Science and Engineering (Germany), the Royal Swedish Academy of Engineering Sciences, the Planning Management Center of MoHURD (China), and the Development Research Center of the State Council (China). This expert base thus contributes 121 indicators to “intelligent monitoring over sustainable urban development.” A further 135 indicators were selected from indicator bases of other systems, and the research team added another 38 indicators. After summarizing, deduplication, and classification, 220 indicators were finally selected. These are reflected in the primary indicators ring of the City IQ Evaluation System (Fig. 2).
《Fig. 2》

Fig.2 The primary indicator ring of the City IQ Evaluation System, with 220 indicators.
2.2.2. Five dimensions of the intelligence level of a city
Because this evaluation system regards cities as intelligent city-beings, it is critical to include the manifestation mode suitable for living systems in the indicator dimensions. Traditional measures for the economic, environmental, and industrial performance of a city [28], as well as an assessment of information and communications technology (ICT) hardware construction and the support and interaction generated by human factors [33] should all be considered as reflections of the intelligence level of a city in its course of “sensing, judging, reacting, and learning.” Sub-targets concerning urban development environment, future trends, construction operation, and local participation should also be highlighted in the assessment.
After analyzing indicator dimension designs of other systems as well as consulting experts’advice, the City IQ Evaluation System team established 3 + 2 dimensions of its own, see Table 2. Three dimensions assess the environment, economy, and governance of an iCity; namely, the dimensions of environment and construction, governance and public services, and economy and industries. Another two supporting dimensions measure the hardware conditions of an iCity in terms of level of informatization and residents’innovation potential. Fig. 3 illustrates the inner logic among these five dimensions. Output factors and supportive input factors [32] are all included in the measurement of the IQ of a city.
2.2.3. Indicator selection: The principle of measuring intelligence
Indicator selection is another critical process in conceiving the City IQ Evaluation System. Carli [41] regards traditional evaluation indicators as invalid and points out that the evaluation of the IQ of a city could only be realized when the city is “optimally and intelligently measured, monitored, and managed.” Some scholars, including De Santis [42], regard the evaluation approaches and the closeness of the dynamic indicator application to local spaces and people as the most critical process in the development of an urban IQ evaluation.
In accordance with the two preconditions required by the principle of selection—deduplication and international applicability—and in order to avoid the deficiencies of the other ICESs as summarized earlier, the City IQ Evaluation System highlights three features of its indicators: common indicators, dynamic adjustment, and open data. Common indicators are collected from open data sources that cover all the data of all cities. Dynamic adjustment requires prompt self-upgrading of data. Open data refers to access to data from third parties via the Internet in order to avoid problems of inaccuracy, incomparability, and intangibility of government data [38]. City IQ has selected 36 evaluation indicators from 220 primary indicators, applying the qualitative approaches of expert seminars and the Delphi method, as well as quantitative approaches by a data association algorithm and a fuzzy evaluation method (Fig. 4).
2.2.4. Indicator adjustment
The City IQ Evaluation System research team has repeatedly conducted experimental assessments using the 36 selected indicators. Assessments were carried out for Pudong (Shanghai), Ningbo, Nanjing, Wuhan, and more. Through the China iCity Construction and Promotion Strategy Research Program, 56 questionnaires were delivered to academicians and experts. Special focus was given to the balancing of the indicators and the content of different dimensions. Finally, 20 indicators, five in each dimension, were selected from the 36 indicators.
2.2.5. Data standardization
A number of ICESs contain both quantitative measurable indicators and indicators that could be turned into quantitative measurements through qualitative judgment [31]. For example, in the WANG Zhenyuan System, level quantization is realized through quantitative judgment [43]. This quantization process of qualitative indicators also exists in the ZHOU Ji DPSIR Model [28], the World Economic Forum System, the MoHURD System, and the Ministry of Industry and Information Technology (MIIT) System. A few indicators of the City IQ Evaluation System are also processed by this approach. For example, score 100 in the indicator “reacting to emergencies” indicates countermeasures for reacting to emergencies, such as emergency reporting systems on municipal governments’websites, an emergency plan, and instant guidance in emergencies; score 50 indicates that countermeasures to emergencies exist, but without recorded details, or that only some regions in the city have such emergency countermeasures; while score 0 means no emergency countermeasures at all.
《Tab.2》
Tab.2 Dimensions and indicators of City IQ Evaluation System 1.0.


《Fig. 3》

Fig.3 Inner logic of five indicator dimensions of the City IQ Evaluation System.
《Fig. 4》

Fig.4 The City IQ Evaluation System framework with 36 selected indicators.
In order to realize the standardized application of quantitative indicators and qualitative indicators that can be quantified, and to eliminate the impacts among different dimensions, the City IQ Evaluation System employs a score scale from 0 to 100, which is more in line with common evaluation practices and which provides higher comparability, as 0−100 scores can reflect the performance of different cities on the same indicator [38].
The data standardization categories are listed below. The City IQ Evaluation System applies the format of the second category: The city that has been given the highest score, 100, by the City IQ Evaluation System is set as the criteria city, and the other cities are evaluated with scores ranging from 0 to 100 according to the standardized value of the sample city. This data standardization approach is the choice after repeated evaluations.
Category 1: A i ′ = ( A i– Amin)/( Amax– Amin)
Category 2: A i ′ = A i/ Amax
Category 3: A i ′ = ( A i– Ā)/ σ i ,when σi2= ∑( A i– Ā)2/ n
After data standardization of 20 indicators, different city performances regarding different indicators displayed scores from 0 to 100. The score a city gets for one dimension is the average value of all indicator scores under this dimension. The total score of a city’s intelligence performance is defined as the average value of its scores across five dimensions. The detailed standardization process and calculation are shown in Table 3. In this calculation process, the average value is applied to obtain the dimension scores from indicator scores and the comprehensive total score from dimension scores. The reason for this method is that in designing the indicator system, the balance between different dimensions and indicators is profoundly considered, and the reverse effect caused by repeated weighting and the incomparability of results is avoided as much as possible.
《3. City IQ Evaluation System 2.0: Improvements toward better universal applicability, openness, and dynamic data sources》
3. City IQ Evaluation System 2.0: Improvements toward better universal applicability, openness, and dynamic data sources
《3.1. City IQ Evaluation System 2.0 and its data source adjustment》
3.1. City IQ Evaluation System 2.0 and its data source adjustment
City IQ Evaluation System 1.0 was created with joint support from multiple academic teams and experts, and the basic version of the City IQ Evaluation System was formed after indicator selection and adjustment. The indicator selection and approaches applied to this 36-indicator system are rationally designed.
However, first evaluations showed that some indicators lack data sources or quality data. There is still a long way to go to achieve the intended goals of globally applicable, dynamic, and open evaluations of the intelligence of cities. Therefore, the City IQ Evaluation System research team created further definitions, simplifications, and amendments to the 36 existing indicators after combining the status of data quality, pre-assessment results, and the second round of expert feedback, and extracted 20 from the 36 indicators (as shown in Table 4).
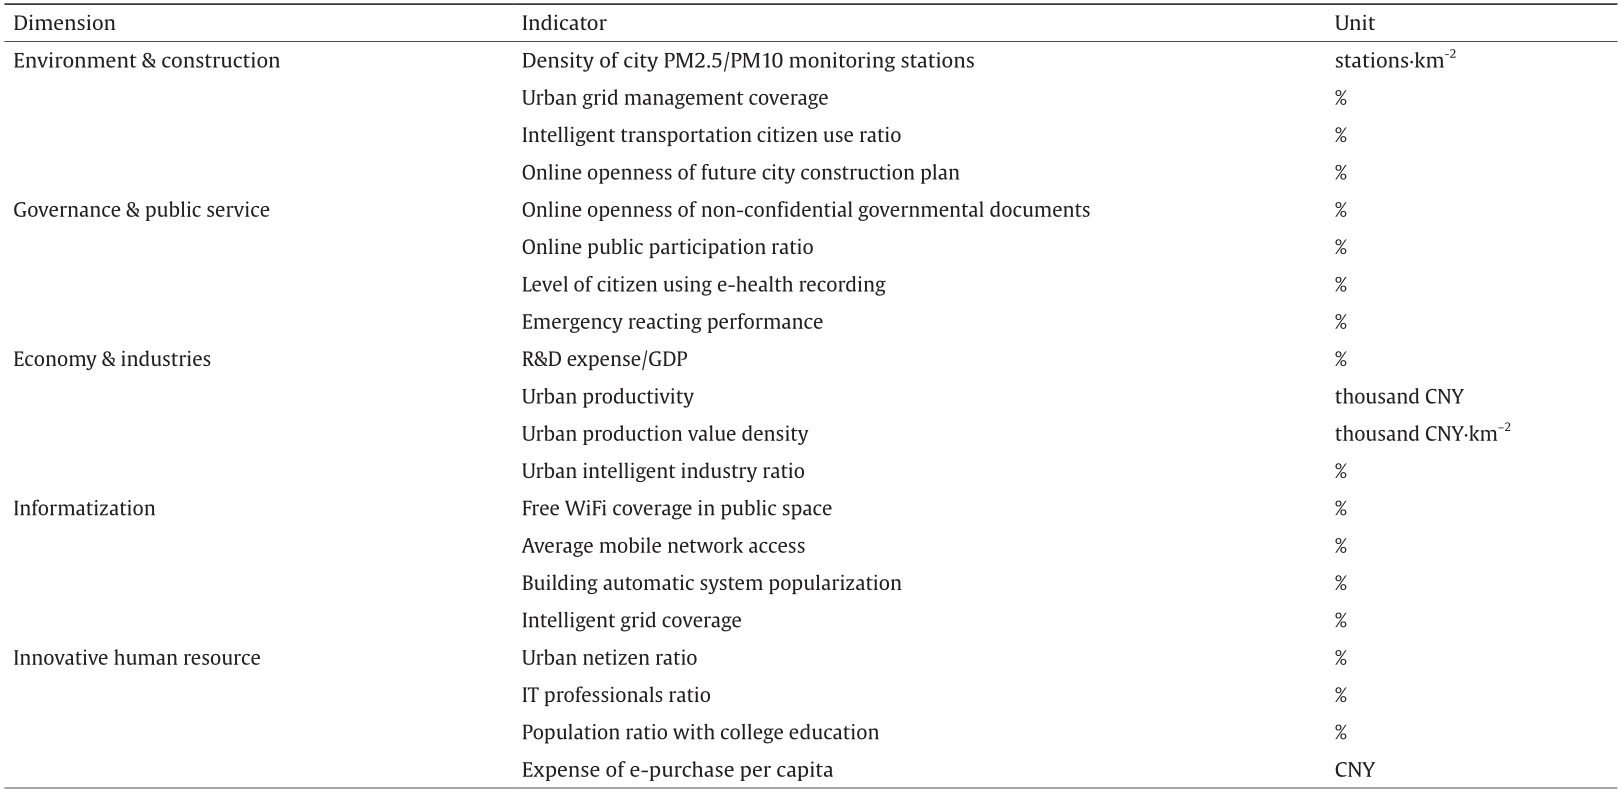
All 20 indicators meet three significant preconditions: globally applicable data, open data without governmental interference, and real-time and dynamically adjustable data. They include both qualitative measurable indicators and quantitative measurable indicators [36].
Compared with traditional indicators, these 20 indicators describe a more innovative approach to measuring the intelligence of a city, as they reflect the sensing, judging, reacting, and learning processes of a city in a more realistic and timely way. For example, the indicator “density of city PM2.5/PM10 monitoring stations” reflects a city’s capacity to sense air elements, and its performance in judging and reacting to the urban agenda of environmental changes. The indicator “online public participation ratio” reflects the patency of the pathway along which public requests can reach decision makers and how public requests can affect decision making. In this way, this indicator reflects a city’s sensitivity and intelligence in “sensing” its citizens’will.
Finally, City IQ Evaluation System 2.0 is established on five dimensions and 20 indicators. Fig. 5 illustrates the full content of City IQ Evaluation System 2.0. The outer sphere, middle layer, and inner layer of the ring reflect the 220 primary indicators, 35 selected indicators, and 20 finalized indicators, respectively, with the City IQ Evaluation System as the core that is split into five dimensions. Table 4 illustrates the specific content of the 20 indicators assigned to the five dimensions.
《3.2. City IQ Evaluation System 2.0: Evaluation results of global intelligent cities》
3.2. City IQ Evaluation System 2.0: Evaluation results of global intelligent cities
To evaluate the global applicability of City IQ Evaluation System 2.0, the research team selected the top eight out of 33 Chinese cities evaluated by City IQ Evaluation System 2.0, and another 33 cities from Europe and the US, and conducted a new round of intelligence evaluation on these 41 sample cities. The newly selected 33 European and the US cities are those that had promoted iCity construction concepts worldwide and that had implemented iCity construction practices for a long time. Table 5 shows City IQ Evaluation System 2.0 evaluation results for the 41 cities. Fig. 6 shows the intelligence performances of nine selected cities, whose dimension scores and indicator scores are visually illustrated by the City IQ Evaluation System 2.0 score compass.
《Tab.3》
Tab.3 Data standardization and indicator calculation.

《Tab.4》
Tab.4 Dimensions and indicators of City IQ Evaluation System 2.0.
《Fig. 5》

Fig.5 City IQ Evaluation System 2.0 dimensions and indicators.
3.2.1. City IQ Evaluation System 2.0 evaluation results
The following is the evaluation results of 41 cities in China and other countries by City IQ Evaluation System 2.0 (Table 5, Fig. 6).
3.2.2. City IQ Evaluation System 2.0: Analysis of evaluation results
Among the intelligence evaluation results of 41 global cities, London scored the highest at 66, which amounts to roughly 2.5 times the lowest score, 26 for Verona, Italy. This result illustrates the global applicability and sensitivity of City IQ Evaluation System 2.0. In general, the gaps between cities are not as wide as expected, indicating that the 41 selected cities are actually typical cases of iCity practices around the world.
Cities with average comprehensive scores over 60 include London, Amsterdam, and Helsinki, among others; these cities have obvious resource superiority in their respective countries and are recognized as global city-regions or metropolitan areas [44]. In contrast, Verona, Santander, Málaga, Friedrichshafen, and other cities that scored below 40 are cities that assign priority to one development aspect rather than to overall development. For example, Friedrichshafen adopts a development mode that is oriented toward Deutsche Telekom, with governmental partnership to promote ICT applications and develop a knowledge city [22], while losing sight of other development aspects. For this reason, Friedrichshafen receives a relatively low score.
In the dimension of “environment and construction,” Amsterdam ranks first with 98, about eight times the lowest score, which was 13 for Verona. The evaluation of this dimension displays a three-level city echelon: 22 top cities scored above 70, 12 middle cities scored between 40–69 , and seven at the bottom scored below 40.
In the dimension of “governance and public service,” Helsinki ranks first with 75, four times the lowest score, which was 18 for Málaga. Cities ranking high in governance and public services are important political, economic, and cultural centers of their respective countries; Boston, Amsterdam, London, and Shanghai Pudong all scored above 70. In contrast, cities such as Jinhua, Cologne, and Lyon score below 40 because of poor intelligence performance in the field of public service.
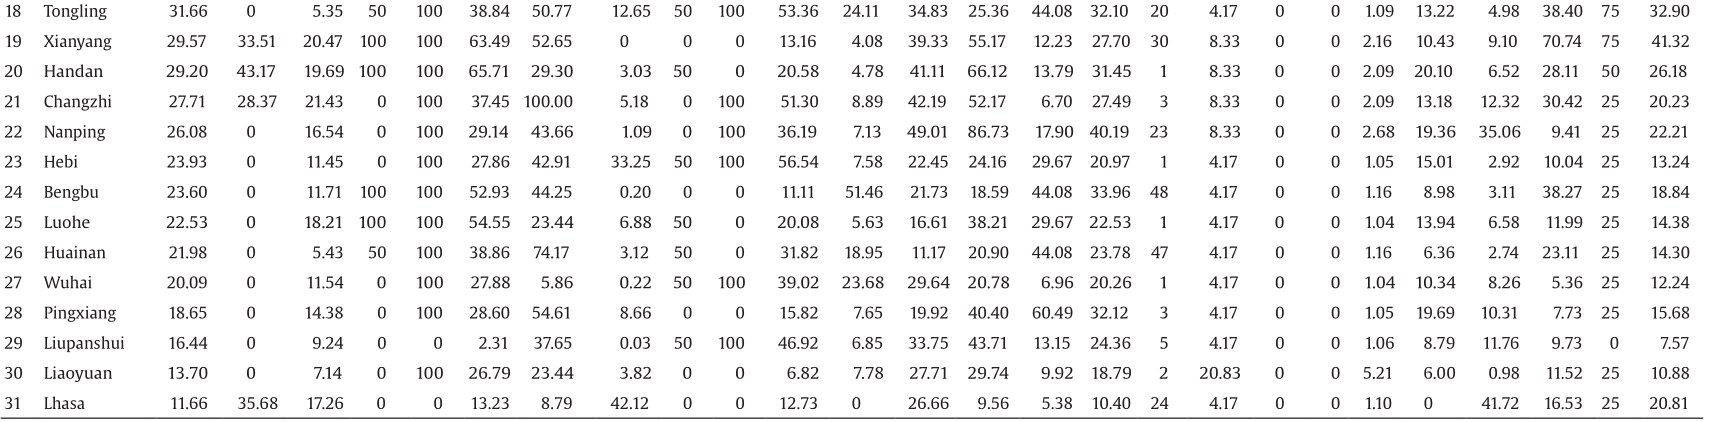
《Tab.5》
Tab.5 City IQ Evaluation System 2.0 evaluation results of 41 global cities.
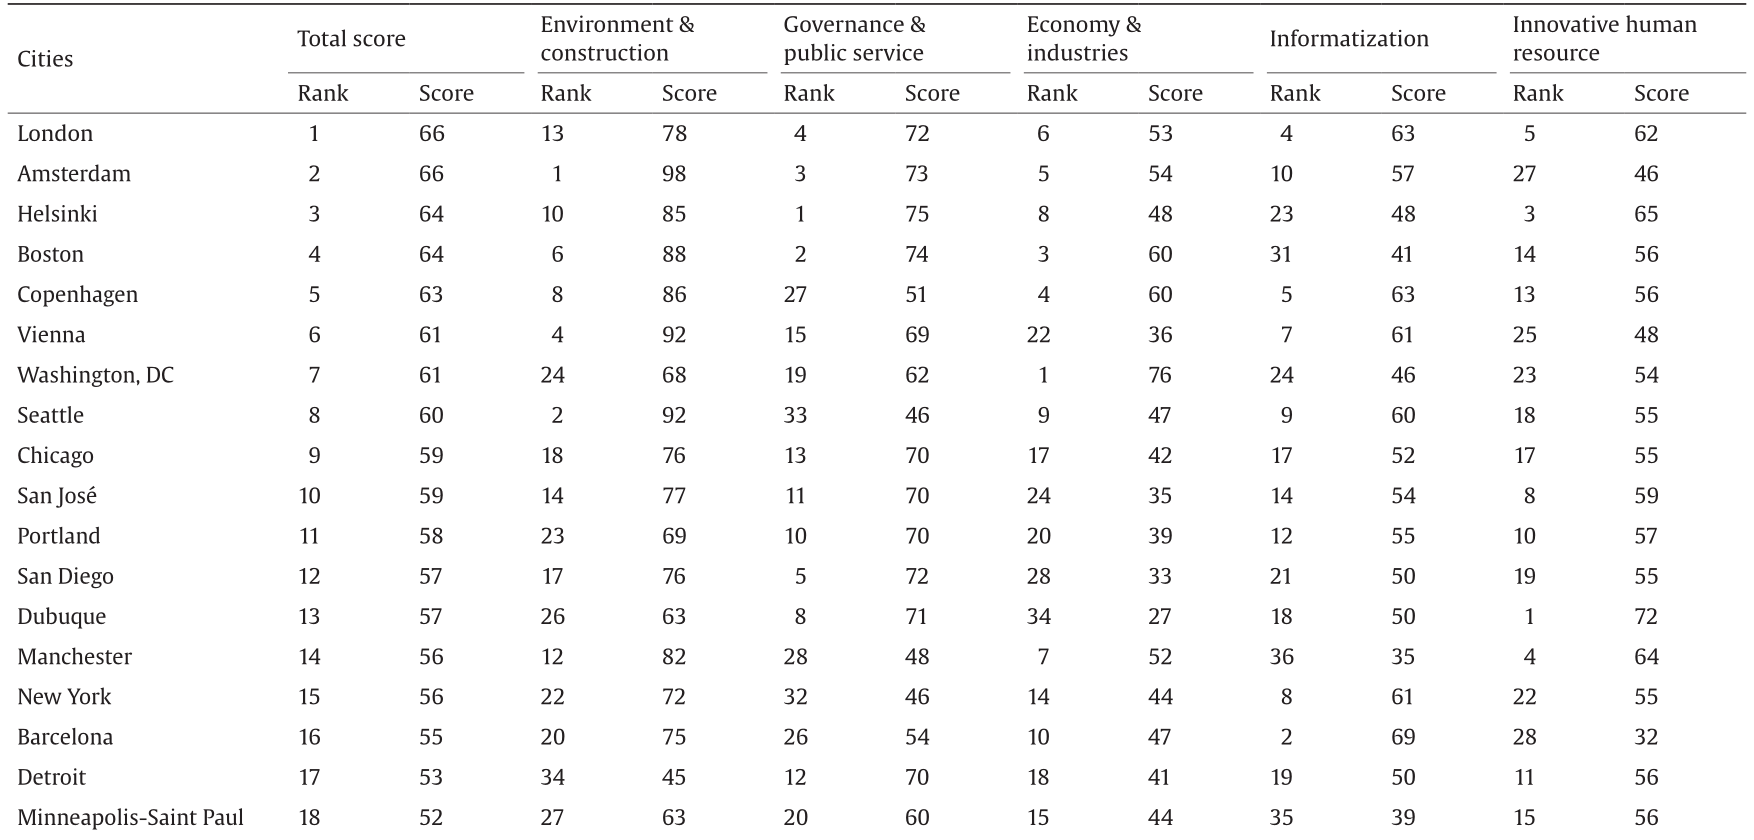


Based on City IQ Evaluation System 2.0 intelligence evaluation results, 2013.
In the dimension of “economy and industries,” Washington, DC ranks first with 76, more than six times the lowest score, which was 12 for Verona. There are wide gaps between other evaluated cities as well in the field of intelligent economy and industries.
In the dimension of “informatization,” Issy-les-Moulineaux of Paris ranks first with a score of 71, which is 2.3 times the lowest score of 31 for Santander, Spain. Capital cities rank among the top cities, and some Chinese cities, such as Ningbo, Wuxi, Zhenjiang, and Shanghai Pudong, also received high scores because these intelligent cities have all invested heavily in hardware facilities and seen significant results.
《Fig. 6》

Fig.6 City IQ Evaluation System 2.0 intelligence score compass.
In the dimension of “innovative human resource,” Dubuque, USA, ranks the highest with a score of 72, almost 6.55 times the lowest score of 11 for Wuhan, Hubei, China. With the impact of indicators such as IT professionals ration, population ratio with college education, and citizen e-purchase expense per capita, Chinese cities with resource priority could not perform best in this aspect. There are also large gaps between global cities in this dimension.
《4. City IQ Evaluation System 3.0: The IQ evaluation-oriented version》
4. City IQ Evaluation System 3.0: The IQ evaluation-oriented version
《4.1. City IQ Evaluation System 3.0: Introduction of IQ deviation evaluation methods》
4.1. City IQ Evaluation System 3.0: Introduction of IQ deviation evaluation methods
Judging from the evaluation results of 41 iCities around the world, City IQ Evaluation System 2.0 exhibits higher sensitivity than version 1.0. Its data resource contributes to the characteristics of pervasiveness, openness, and real-time dynamics, constituting a theoretical and methodological innovation from traditional city intelligent quotient evaluation systems.
City IQ 2.0 realizes real-time dynamics of data evaluation; however, its results cannot reflect an integrated development level of city intelligence, indicating the gap between IQ evaluation theory and its outcome. It cannot reflect the overall rising trends of a city’s intelligent level, known as the “Flynn effect” [46], as the overt IQ trend for the human species.
To address this deficiency of City IQ Evaluation System 2.0, which was issued in 2014, the City IQ Evaluation System research team introduced IQ evaluation theory and a data standardization process into the system in 2015, in order to approach the original goal of measuring a city’s intelligence growth as a city-being. The improved version, City IQ Evaluation System 3.0, has been under development since 2015. Like 2.0 version, City IQ Evaluation System 3.0 adopts the hundred score system; however, it includes an IQ deviation evaluation method (IQ EDM) in order to normalize the mean value of various indicators as 100 points (Fig. 7); namely, Ai’= Ai/ Amean. This is unlike the ratio IQ indicator system of City IQ Evaluation System 2.0, which assigns the value 100 to the maximum sample ratio IQ.
The corresponding results are more consistent with IQ evaluation principles and performance features, and objectively reflect the intelligence level of sample cities in city clusters.
《4.2. Evaluation results of global intelligent cities by City IQ Evaluation System 3.0》
4.2. Evaluation results of global intelligent cities by City IQ Evaluation System 3.0
Using City IQ Evaluation System 3.0, the research team has carried out a new round of city IQ evaluations for the selected 41 global cities that were evaluated using City IQ Evaluation System 2.0. Table 6 shows the result, and Fig. 8 shows the score compasses for the extracted nine cities. Comparing Table 6 with Table 5, the nominal score of 100 points has been adjusted from the maximum value (as shown in Table 5) to the mean value (as shown in Table 6), and some scores exceed 100 in different dimensions in both Table 6 and Fig. 8.
4.2.1. Evaluation result by City IQ Evaluation System 3.0
The following is the evaluation results by City IQ Evlauation System 3.0 of 41 cities in China and other countries (Table 6, Fig. 8).
4.2.2. Result analysis of City IQ Evaluation System 3.0
Compared with the evaluation results of 41 global iCities using City IQ Evaluation System 2.0 in 2014, the results of the same 41 cities calculated using City IQ Evaluation System 3.0 in 2015 are as follows.
Firstly, the evaluation results from City IQ Evaluation System 3.0 and City IQ Evaluation System 2.0 are considerably stable. The rankings fluctuate slightly in smaller spheres of cities, with an obvious rise of ten rankings for Taizhou. Washington, DC has moved up five rankings, and Wuxi has moved up four rankings. Issy-les-Moulineaux has decreased five rankings, and Jinhua has decreased two rankings. London remains at the top, and the last six cities remain in the same rankings.
Secondly, compared with the rest of the 41 global iCities, Chinese cities remain at the lower level from their mean value in five dimensions while displaying a distinct deviation on certain indicators, which presents an uneven development trend in the five dimensions. Cities in Europe and the US remain at a mean level in the five dimensions, and present even development trends. As the red lines show in Fig. 9, the mean value of each score compass is 100.
Thirdly, these 41 cities retain an outstanding performance in aspects of intelligent urban management and service, and intelligent urban construction and environment, but present insufficient performance in residents’intelligence innovation potential, intelligent economics, and industries.
The results reflect the development of various cities in terms of iCity construction and iCity management over one year, as well as the relative decline of slow-progressing cities in certain dimensions. After data normalization, a score of 100 was reassigned from the maximum sample value to the mean value; as a result, the score highlights cities above average level more directly.
The results further demonstrate the superiority of City IQ Evaluation System 3.0 over City IQ Evaluation System 2.0, in that the former more clearly indicates a city IQ level compared with a mean score, while the sensitivity of the system remains unchanged.
《Fig. 7》

Fig.7 Normalized distribution of IQ with a mean of 100 and a standard deviation of 15. Source: Ref. [2].
4.2.3. Analysis of city intelligence growth and development
The five dimensions of City IQ Evaluation System 3.0 can be classified as the hardware or software on which a city’s IQ depends. Building environment, economic industry, and hardware infrastructure are preconditions of intelligent hardware, and management and service as well as urban labor potential are two preconditions of intelligent software. The City IQ Evaluation System research team reviewed the intelligence evaluation results of the selected 41 global cities and allotted them into the coordinate axes of intelligent developing hardware and intelligent growing software, with a score of 100 as the boundary of high growth and low growth (as shown in Fig. 9).
Quadrant 1 (bottom left): lower development level of intelligent hardware and software. The development level of intelligent hardware and software is rather low in this quadrant, which includes most Chinese iCities, and parts of European iCities. Most cities in this stage may have chosen to operate from only one aspect of iCities, and are in a first stage of changing from theory into real practice.
Quadrant 2 (bottom right): high hardware level, low software level. Intelligent hardware possesses a higher growth level, and software possesses a lower growth level. Most Chinese cities fall into this quadrant, which reflects a large short-term investment and achievement in intelligent infrastructures. However, intelligent management and service and public accomplishment could not be improved over such a short period of time.
Quadrant 3 (up left): low-level growth of hardware and high-level growth of software. The development level of intelligent hardware is low compared with a higher development level of intelligent software. The city invests more in intelligent public service infrastructure, such as management, business, and education, prior to intelligent hardware construction.
Quadrant 4 (up right): high-level growth and development of both intelligent hardware and software. Cities in this quadrant embody not only effectiveness of construction investment in intelligent infrastructure, but also prowess in intelligent software, which could not be realized through city construction, policy stimulation, and investment in a short time.
《5. Conclusions》
5. Conclusions
By an analysis of 38 existing ICESs worldwide, this research reveals that current ICESs are not fully trustable because of their common lack of global comparability. The data sources of these ICESs are under the influence of the statistical systems of individual countries. To avoid this non-objectivity, the City IQ Evaluation System research applied common indicators drawn from open data sources and realized real-time updating to address fast changes in cities. Thus, results from the City IQ Evaluation System are globally comparable and trustable.
《Tab.6》
Tab.6 Evaluation results of 41 global cities by City IQ Evaluation System 3.0.
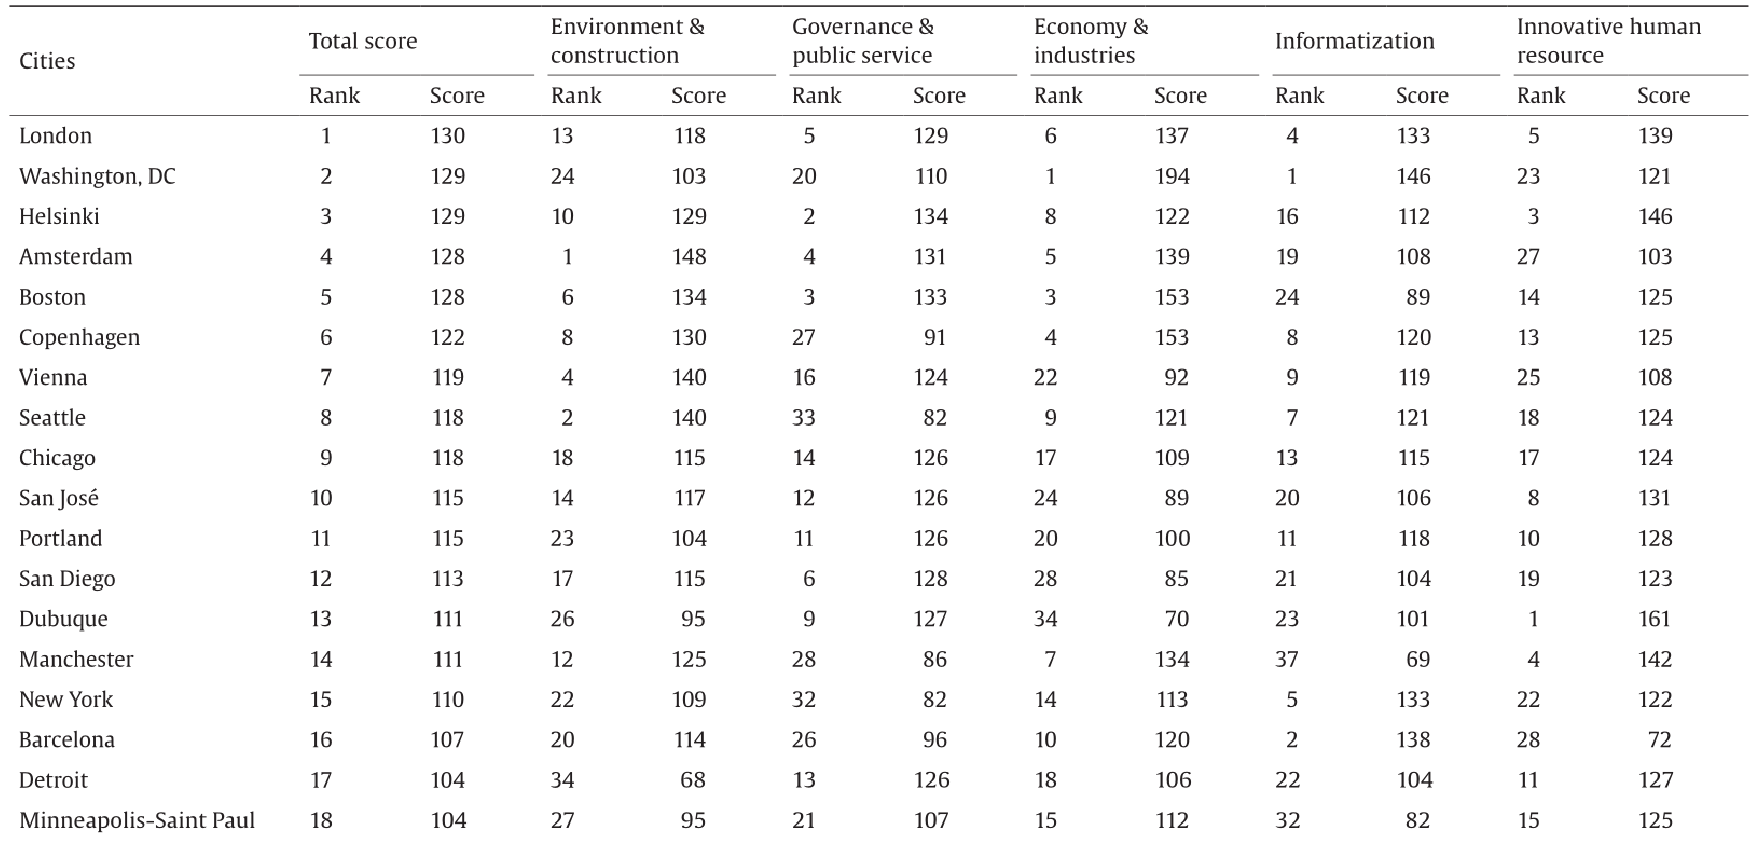


Based on City IQ Evaluation System 3.0 evaluation results, 2015.
(1) Intelligent living city theory. ICESs should be derived from a theory of intelligent cities. The City IQ Evaluation System research team applies the theory of intelligent living cities as the core concept of the system. In this theory, intelligent cities are seen as dynamic living city-beings that can sustainably grow in aspects of sensing, judging, reacting, and learning. Compared with traditional indicator systems that are based on sustainable development theory or informatization theory, or systems that are derived from technological aspects only, the City IQ Evaluation System is innovative, comprehensive, and reliable.
(2) Universally applicable, open, and dynamic data sources. City IQ Evaluation System 1.0 meets the basic requirements of an intelligent city evaluation system and has a profound scientific basis. On this basis, City IQ Evaluation System 2.0 adjusted its indicator source from traditional data sources to a system that features better global applicability, online open data, and timely and dynamically adjustable data sources. Thus, the system avoids the existing problems in current ICESs, including indirect data access, poor reliability, discrepant indicators, and the missing capability for dynamic adjustments. These features distinguish the City IQ Evaluation System from other ICESs.
《Fig. 8》

Fig.8 Score compasses of the intelligence levels calculated by City IQ Evaluation System 3.0.
(3) Learning from the ideology and approaches of the IQ test. In the intelligence evaluation of eight Chinese cities and 33 cities in Europe and the US, a relative value standardization approach was applied in the indicator scoring, dimension scoring, and comprehensive scoring. City IQ Evaluation System 2.0 sets the highest score received by the criteria city as the standard value. City IQ Evaluation System 3.0 further employs the deviation evaluation methods of IQ tests and makes modifications to the data standardization process, after which the average score of each indicator of the criteria city is set to 100 and other cities are evaluated according to this standard. The application of the IQ test concept and methods enhances the rational conception that intelligent cities are actually intelligent city-beings. Evaluation results prove the high sensitivity of the City IQ Evaluation System.
The City IQ Evaluation System series will be updated annually, and sustained improvements and upgrading will be provided on indicators and data sources. Finally, the City IQ Evaluation System will provide more valuable and credible evaluation results for advances in iCity construction, operation, and development.
《Fig. 9》
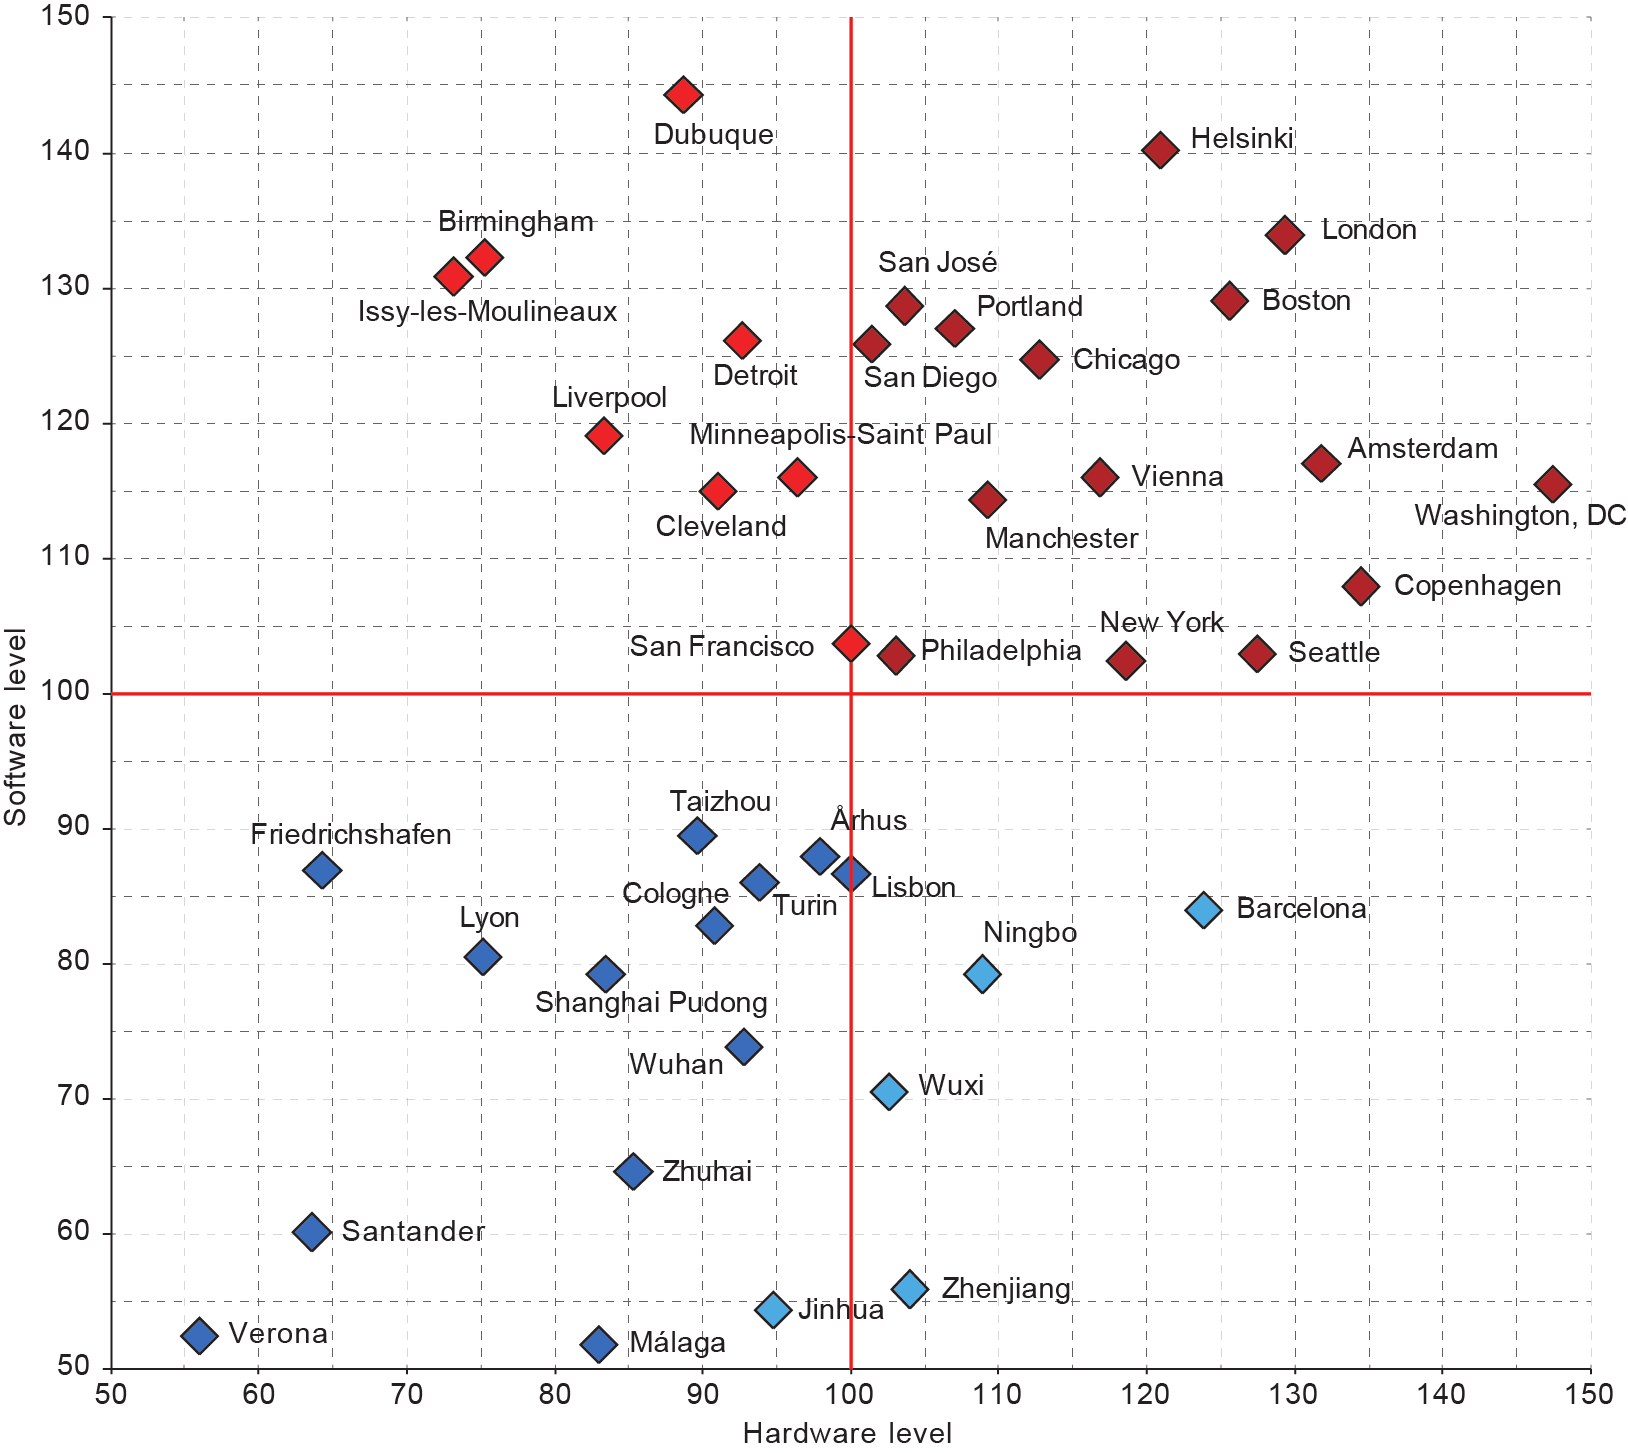
Fig.9 Analysis of the City IQ Evaluation System 3.0 growth and development for 41 global iCities, based on evaluation results of the ICES intelligence level, 2015.
《Acknowledgements》
Acknowledgements
The City IQ Evaluation System research team would like to thank Dr. Xingjing Xu, Professor Buyang Cao, Professor Yan Liu, Dr. Tubin Shan, Mr. Linyu Kong, Ms. Weijun Zhang, and Mr. Heng Zhang for their contributions in establishing the City IQ Evaluation System. Thanks also go to Professors Otthein Herzog and Bernhard Mueller, and experts from the Chinese Academy of Engineering, the National Academy of Science and Engineering (Germany), the Royal Swedish Academy of Engineering Sciences, the Planning Management Center of MoHURD (China), and the Development Research Center of the State Council (China), for their valuable advice and sustained concern regarding this research. The research team also thanks Ms. Xiaowei Tang for her coordinating work in creating this research paper.
Zhiqiang Wu, Yunhe Pan, Qiming Ye, and Lingyu Kong declare that they have no conflict of interest or financial conflicts to disclose.


 京公网安备 11010502051620号


