
《1 Introduction》
1 Introduction
The concept of a regional “healthcare group” originated in China in the 1980s, with many aliases, such as healthcare consortium and healthcare alliance. It usually takes the form of an aggregation of medical institutions, centering on a large comprehensive hospital with strong technical powers and disciplinary competitiveness and with join participation from several hospitals and grass-root medical institutions with corporate capacities through research and technological cooperation and brand alliance, for example. The purposes of such aggregation are to promote diagnosis and treatment triage, to maximize brand value, to complement each other’s advantages, and to share resources. Different from international healthcare groups that adopt unitary ownership and unified management, China’s regional healthcare groups largely adopt a loosely organized cooperative mode based on agreements. Our survey revealed the following problems in the resource coordination of such healthcare groups:
(1) Divided ownership and administrative affiliations impose an insurmountable obstacle on the integration of healthcare institutions. Over 90 % of China’s medical institutions belong to local governments, and all Level 2 and 3 medical institutions are assets of local municipalities and districts. Core rights such as administrative affiliation, finance, and human resources are not controlled by medical institutions; in addition, there are also medical insurance policies and other restrictive factors. Together, these factors have created a system-level barrier that substantially hindered talent transfer, capital flow, and resource coordination among different medical institutions
(2) The inappropriate interest allocation and reimbursement mechanism have been undermined by the effects of integration. During previous efforts to build regional healthcare groups, the lack of an adequate interest coordination mechanism between hospitals and community medical service centers has been certified as a major problem, the core reason of which is the lack of motivation regarding two-way referral. Both Level 2 and Level 3 hospitals expect to receive patients referred by grass-root medical institutions, meanwhile hoping to retain the patients for increasing their income. On the other hand, grass-root medical institutions do not welcome convalescent patients from higher-level hospitals, owing to economic, labor cost, and other considerations.
(3) The current infrastructure for the integration of medical institutions is not solid, owing to the lack of sufficient general medical practitioners in grass-root medical institutions. At present, the professional capacities of grass-root medical institutions, especially community medical service centers, remaining weak, with a rather limited number of general medical practitioners. Thus, they cannot fulfill their desired roles in the preventive treatment of chronic diseases, preventive healthcare, and health guidance. Patients are also concerned about the quality of community medical services, which further hinders the referral of patients to lower-level medical institutions. To address these problems, we have turned to simulation in order to further explore the root cause. Lebaron et al. [1] first employed AnyLogic to simulate real social scenarios, where they successfully simulated stock market trends. Yang et al. [2] proposed an epidemic model based on time space. Li et al. [3] studied the evolution pattern of the industrial co-existence system by defining the enterprise waste exchange activities and mechanism in industrial parks. These research results have provided a theoretical basis for the application of AnyLogic to the simulation of resource coordination.
《2 Research object and methodology》
2 Research object and methodology
《2.1 Research object》
2.1 Research object
This study takes the Jiading District in Shanghai as an example. This district covers an area of 464.2 km2 and has a permanent population of 1.568 million [4]. According to 2015 National Economic and Social Development Statistics of Jiading District, as of the end of 2015, there were 294 medical institutions of various levels and types, including nine medical institutions at the district level or above. These medical institutions offered 4445 sickbeds and 7137 medical service personnel, including 2888 licensed (assistant included) practitioners and 3052 registered nurses. These medical institutions include 19 community medical service centers and branches. In 2015, Jingan District finished 10.622 million diagnoses and treatments, with 93 000 hospital discharges, and 52 000 surgeries were performed by district-level hospitals. Among these, community medical service centers were responsible for 4.244 million diagnoses and treatments, with a year-on-year growth of 5.8 %, occupying 40 % of the entire district’s outpatient services. The family doctor campaign was in full swing—as of the end of 2015, 237 000 households (532 000 residents) had joined the family doctor program. Throughout the year, over 3.73 million medical diagnoses enjoyed fee reductions or exemptions, with a total exemption amount of 9.658 million yuan. In addition, medical expenditures regarding basic medicine without added profits totaled 52.698 million yuan, averaging a 14-yuan discount per patient [4].
《2.2 Research methodology》
2.2 Research methodology
AnyLogic is a simulation software product based on the design methodologies of complex systems. It is also the first tool that introduces the unified modeling language (UML) into the field of model simulation, allowing its users to perform modeling and simulation of mainstream discrete event models, agentbased models, and system dynamic models. Its modeling method is applicable to different abstract levels—system dynamic modeling is applicable to the higher level, the abstract level; agentbased modeling is applicable to the middle level, the sampling level, which allows users to create models of physical object details on the lower sampling level or to create models for higher-level objects, such as companies and governments; discrete event modeling is applicable to models of micro-levels that need more details [5]. Fig. 1 shows the main interface of the simulation model for the resource coordination of regional healthcare groups. Fig. 2 displays the key performance indicator (KPI) interface, showing the statistical and analytical results. Users can extract and analyze data from the system according to the actual demand. In Fig. 2, the histogram provides a graphical display of the distribution of patients among different medical institutions and their recovery statuses, and the trend diagram shows the change in the patient distribution and system efficiency of community medical service centers as time changes. Fig. 3 displays the service efficiency of medical institutions, where users can view the real-time variation in the total treatment costs and resource utilization ratios of various medical institutions in the current system.
《Fig. 1. 》

Fig. 1. Main interface of the simulation model for the resource coordination of regional healthcare groups† .
《Fig. 2.》
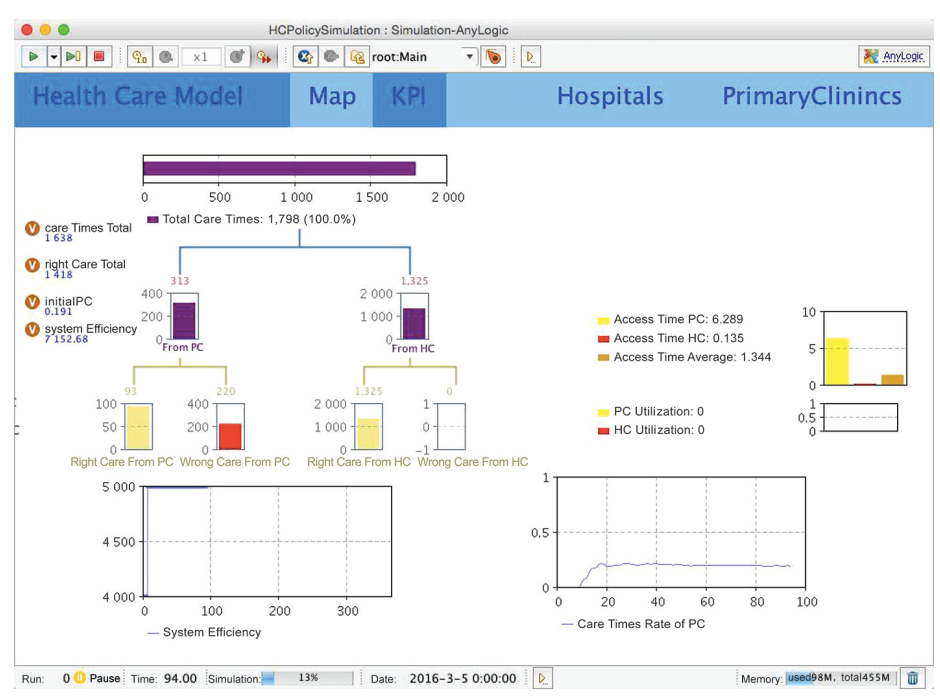
Fig. 2. Key performance index display interface. PC: primary care; HC: hospital care
《Fig. 3.》

Fig. 3. Medical institutions service efficiency display interface.
《3 Experiment design》
3 Experiment design
《3.1 Environment parameter settings》
3.1 Environment parameter settings
To set up the experiment environment, a geographical information system (GIS) is introduced into AnyLogic. Continuous GIS space is searched, and the range of the model is defined as R. Other environment parameters are set according to Jiading Yearbook 2014 [6].
This study involves healthcare service providers (medical institutions of different levels) and healthcare service receivers (population in need of medical services). Based on the content and level of services provided, this study categorizes healthcare service providers into a two-tier network consisting of grass-root medical institutions (including community medical service centers and town-level health centers) and hospitals, and it defines healthcare service receivers as those in need of medical services. Correspondingly, this study has categorized patients into Class A and Class B, according to the severity of disease, as shown in Fig. 4. Class A patients are those with less severe diseases that can be cured in community medical service centers and town-level health centers; Class B patients are those with severe
《Fig. 4.》

Fig. 4. Internal subject of model.
diseases that can only be cured in hospitals. Considering the demand of transfer treatment, Class B patients can receive medical treatment in a hospital for a period of time, and they then choose to be transfered to community medical service centers for further treatment. If such patients choose community medical service centers in the beginning, they will have to be transferred to higher-level hospitals because grass-root medical institutions lack the capacity to provide adequate diagnosis. It should be noted that not all Class B patients can be transfered to community medical service centers. Since the upper and lower thresholds for the transfer rate are adjustable in the model, further categorization of Class B patients is not necessary
With the initial settings, the total amount of an NR population is randomly distributed within range R. The probability of being afflicted with Class A diseases defined as PA, and the probability of Class B disease is defined as PB, and PB=1−PA.
Given the limitations in the scale of simulation, the numbers of both patients and sickbeds are reduced to one-tenth of the original data. Owing to limited documentation available, actual data of Jiading District and the national standards for patient triage cannot be obtained. We have therefore referred to the research results of Wang Wenhua [7] on the suitable of diseases for triage for in-hospital patients in rural areas in Shandong Province. These results are based on questionnaires of 9501 patients and interviews with 305 medical staff, and they show that 55 common in-hospital diseases accounted for 84.92% of all in-hospital patients. Fifteen of these 55 diseases are suitable for triage to grass-root medical institutions, which accounts for 50.43% of patients with common diseases. That is, 42.83% of total in-hospital patients can be transferred to grass-root medical institutions. Therefore, we have set PA to 0.4283 and PB to 0.5717 (Table 1).
Table 1. Environment parameters
《Table 1》

《3.2 Parameter settings for target functions》
3.2 Parameter settings for target functions
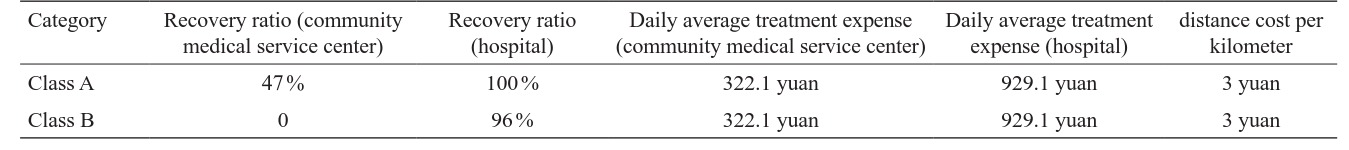
Table 2 shows the parameter settings for target functions, in which data about the recovery ratio is obtained from the healthcare section of Jiading Yearbook 2014 [6].
Table 2. Parameter settings for the target functions‡
《Table 2.》
《3.3 Attribute settings of medical institutions》
3.3 Attribute settings of medical institutions
Values of all attributes of medical institutions, including length of stay, hospital level, geographical location, and number of sickbeds, are all set according to Jiading Yearbook 2014 [6]
《3.4 Attribute settings of patients》
3.4 Attribute settings of patients
The patient triage structure is determined by personal preferences. Since no data are currently available, the values are given by means of system optimization. The initial structure of treated patients is used as the reference, and the combination with the minimum deviation with the actual structure is adopted.
《3.5 Design of decision-making variables》
3.5 Design of decision-making variables
In policy simulation models, the influence of policies on the system can be observed by adjusting the values of policy-making variables. In this research, the following variables are added: transferal ratio, insurance reimbursement quota for community medical services, and the recovery ratio of community medical service centers.
《4 Results》
4 Results
《4.1 Model validity verification》
4.1 Model validity verification
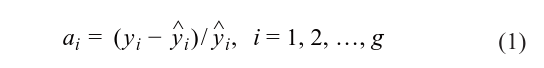
In Formula (1), yi and ^yi , respectively, represent the simulation value and actual value of the ith compared value, and g is the amount of compared values in the model. Normally, the simulation and prediction accuracy of the model can be deemed acceptable when over 70 % of the variables satisfy the condition a<5 %, and the relative error of each variable does not exceed 10 %. Owing to the complex functions and relations of various factors in the model, it is necessary to calculate the mean square error of all simulation variables to confirm the simulation effects of the model, using the following formula:

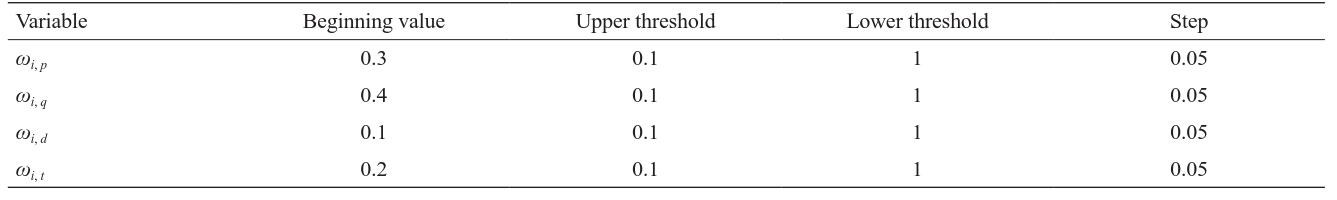
In Formula (2), RMSi stands for the mean square error of the ith observed value and n represents the number of observed values. It is generally agreed that RMS is, among all parameters, universally applicable to and more effective in verifying the overall degree of fitting of the model system. RMSi < 5 % indicates a good degree of fit, while 5 %<RMSi < 10 % is alsoThe experiment is run in AnyLogic, as shown in Fig. 5. The number of iterations is set to 300 for each test, and 900 iterations are performed in three tests to obtain relative errors that are gradually decreasing—ωi, p = 0.1, ωi, q = 0.15, ωi, d = 0.15, ωi, t = 0.6.acceptable. In this research, the observed values are the proportions of patients treated by each medical institution, and values that need adjustment are patient preferences for price, quality, distance, and waiting time, represented by ωi, p, ωi, q, ωi, d, ωi, t. Table 3 shows the design of the calibration experiment, which meets the condition ωi, p+ωi, q+ωi, d+ωi,t = 1.
Table 3. Calibration experiment design
《Table 3.》
The calibration experiment interface displays how patient preferences for price, quality, distance, and waiting time (ωi, p, ωi, q, ωi, d, ωi, t) are adjusted so that observed values—namely, the proportions of patients treated by each medical institution—are the closest to actual values. In Fig. 5, the gray line represents the gap between each experiment value and the actual value, and the blue line shows the entire process of iteration, that is., the trend of decrease for the optimized solution. With the initial settings, the average total treatment cost per person increases before dropping and keeps stable at about 10 000 yuan starting from Day 40. It is reasonable to deduct that the system requires a 40-day period of warm-up before achieving the stable state, as shown in Fig. 6.
《Fig. 5.》

Fig. 5. Calibration experiment running interface
《Fig. 6.》
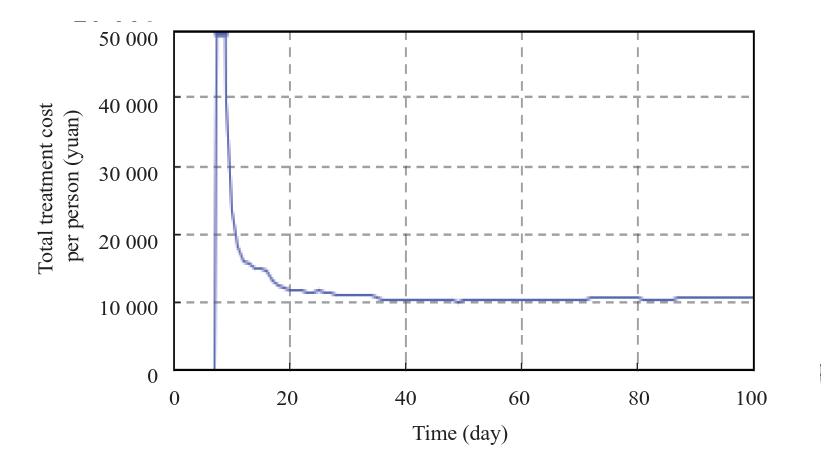
Fig. 6. Total treatment cost per person
《4.2 Simulation experiment on medical insurance reimbursement ratio adjustment》
4.2 Simulation experiment on medical insurance reimbursement ratio adjustment
The reimbursement ratio has a substantial impact on patient triage. Analysis on the impact of the reimbursement ratio by community medical service centers on the total treatment cost per person is provided in Fig. 7, which shows that system efficiency achieves the maximum value when the reimbursement ratio increases to 83 %. However, as this ratio continues to rise, the average total treatment cost starts to grow, mostly because the current quality and capacity of community medical service centers cannot satisfy the demand of the surging number of patients.
《Fig. 7.》
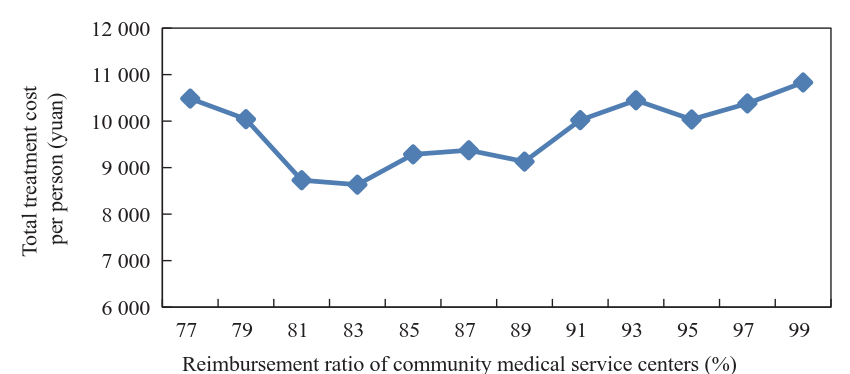
Fig. 7. Impact of reimbursement ratio on total treatment cost per person.
《4.3 Recovery ratio increase in the simulation experiment》
4.3 Recovery ratio increase in the simulation experiment
Generally speaking, increasing the recovery ratio of community medical service centers can effectively reduce the total system cost, largely because a higher recovery ratio decreases the additional costs incurred by repeated treatments. It is worth noting that the total treatment cost per person drops sharply when the recovery ratio increases from 47% to 57%, after which the cost dropping curve becomes gradually flat, as shown in Fig. 8.
《Fig. 8.》
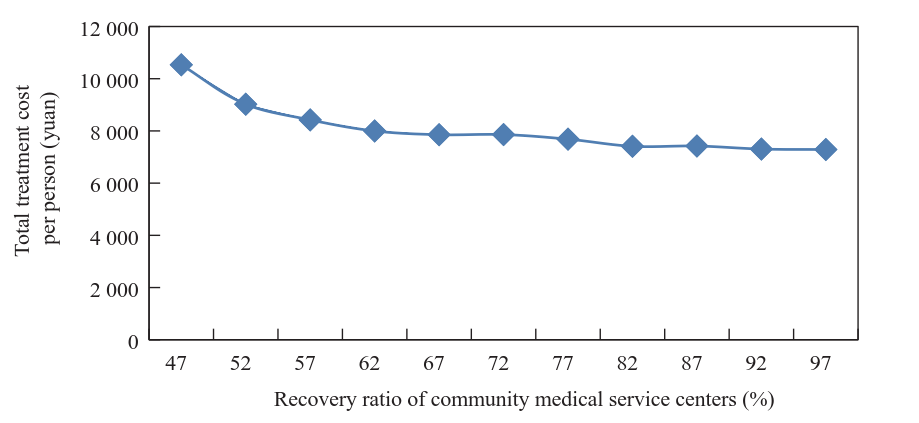
Fig. 8. Impact of increasing recovery ratio of grass-root medical institutions on total treatment cost per person.
《4.4 Transferal ratio increase in the simulation experiment》
4.4 Transferal ratio increase in the simulation experiment
In this experiment, the transferal ratio is set to between 5 % and 95 %. In Fig. 9, each line displays change of the total treatment cost per transferred patient over time. It can be seen that the increase in the transferal rate is accompanied by an increasing cost. This is especially obvious after the transferal ratio reaches 80 %—the system become unstable and the cost soars along the time line, as shown in Fig. 10. This indicates a bottleneck in community medical service resources, such as a lack of sickbeds, which contributes to the increase of overall system costs.
《Fig. 9.》
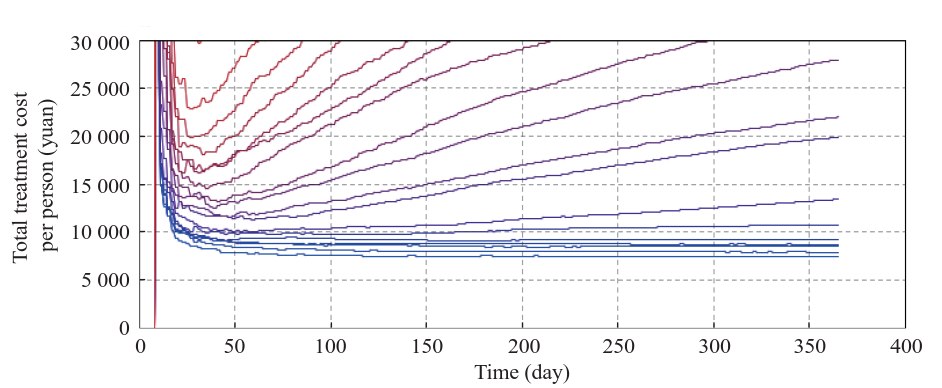
Fig. 9. Total treatment cost per person for different transferal ratios. Blue indicates the lowest transferal ratio; red indicates the highest.
《Fig. 10.》

Fig. 10. Impact of increased transferal ratio on total treatment cost per person.
《5 Conclusions》
5 Conclusions
Several conclusions can be drawn from the simulation experiments above. First, the reimbursement ratio of grass-root medicalinstitutions should be properly increased. The simulation results show that the system works in an optimum status with a reimbursement ratio of 83 %. Second, the quality of services offered by grass-root medical institutions should be improved. Different quality levels may have different effects in reducing the system costs, so a reasonable investment in quality improvement must be determined that can achieve the greatest investment-output ratio. According to simulation results in this paper, increasing the transferal ratio alone cannot effectively reduce such costs, indicating that the bottleneck that hinders transferal is a lack of sufficient community medical service resources. To solve this problem, the medical service capabilities of grass-root medical institutions should be enhanced with an attempt to increase thetransferal ratio. Based on these conclusions, we hereby propose our suggestions on policies that can solve the current dilemma facing regional healthcare groups
(1) Optimize the organizational structure and resource allocation mechanism of regional healthcare groups. At present, the tired diagnosis system has become the focus of medical reform. Regional healthcare groups should use this system as the cornerstone to build a multi-tier healthcare service system led by the board of directors. Regarding the standards for selecting group members, geographical factors and service capabilities should be considered. Scientific planning is required, and the access criteria and scale of different levels of institutions should be clearly defined, for the purpose of restructuring, optimizing,and re-organizing group resources. Regarding the issues of service coverage, regional monopoly by a single healthcare group should be avoided by setting up several healthcare groups in the same region, the specific number of which can be determined according to available medical resources, in order to encourage market competition. After finishing building such infrastructure, resource allocation for different healthcare groups can proceed, with consideration of three major aspects: planning the total amount of resources, adjusting existing resources, and selecting which resources should be added.
(2) Devote major efforts to the cultivation of general medical practitioners and the development of community medical service centers. First, the national reserves of general medical practitioners should be expanded by setting up the relevant majors in universities and by increasing the quota of enrollment or directed education. Second, post-transfer training and standardized training should be conducted in parallel, and a multi-tier and multi-channel cultivation system that combines continued medical education with higher education should be established that can gradually evolve into a standardized training system in order to solve the problem of severe shortage of general practitioners. Third, the payment and social status of general practitioners should be elevated to attract more talent in grass-roots medical institutions. To achieve this goal, a financial incentive mechanism should be established to guarantee adequate income for general practitioners; in addition, a well-planned development path should be provided for general practitioners in the form of better training and more promotion opportunities.


 京公网安备 11010502051620号


