

1. Introduction
A large number of optical measurement techniques have been studied for the three-dimensional (3D) measurement of objects with a diffuse surface [1–3]. However, the measurement of specular surfaces remains a challenge. Interferometry is a common method for measuring reflective surfaces with high accuracy; however, it is extremely sensitive to environmental noise [4]. In addition, interferometry cannot measure a freeform surface with large gradients (steep sides) due to the limitations of the measurement principle. Stereo deflectometry is an important technique for the measurement of freeform specular surfaces. This technique has been widely investigated recently due to its advantages of non-contact full-field measurement and high accuracy [5–8]. Gradient information of the testing surface is obtained by using the geometric relationship of the components in a stereo deflectometry system. The reconstruction shape of the testing object is acquired through an integral calculation of the gradient information [9,10]. Therefore, the measurement accuracy of stereo deflectometry is strongly affected by the calculation accuracy of the gradient information and the determination accuracy of the geometric parameters of the components.
A considerable amount of research has been conducted to enhance measurement accuracy in stereo deflectometry. The influence of imperfect performance of the components, as compared with an ideal imaging model, has been discussed, and several methods have been investigated to suppress the effects of component imperfections. Petz and Fischer [11] studied the influence of the error sources from the display, including form error, the refractions effect, and color display problems. Xu et al. [12] proposed an imaging model and analyzed the influence of the system’s screen pixel size and the period of fringe displayed on the screen on the sampling phase error and the normal error. Correct phase measurement is crucial in stereo deflectometry measurement techniques. However, error sources such as electronic noise result in random phase error and nonlinear phase error in deflectometry. Yue et al. [13] investigated a technique to eliminate nonlinear phase error in a deflectometry system. Wu et al. [14] studied a phase error reduction technique for deflectometry that included the integration of several error-elimination methods used in fringe projection profilometry, in order to decrease the random noise and nonlinear response noise. Another important aspect of system configuration is system calibration. Standard calibration methods based on special equipment, such as calibration targets [15,16], plane mirrors with special markers [17–19], and extra displays or cameras [20,21], have been developed for deflectometry calibration. However, there may be an introduction of new error sources from the calibration equipment. Therefore, Werling [22] and Xiao et al. [23] explored a calibration method to calculate the geometric relative relation of the units in deflectometry by only applying a plane mirror without markers. Conventional calibration methods [24–28] for deflectometry complete camera calibration and systemic calibration separately. Camera calibration is conducted first, and systemic geometric parameters are then calculated based on the camera calibration result. However, the objective functions of parameter optimization during camera calibration and systemic calibration are different, which results in an inconsistency when combining all systemic optics parameters. In addition, the camera calibration error is propagated to the systemic calibration, which leads to larger systematic deviations. In order to eliminate the error propagation and the inconsistency in different calibration steps, holistic calibration techniques have recently been investigated. For example, self-calibration methods for a stereo deflectometry system were studied by Olesch et al. [29] and Faber et al. [30,31], and Ren et al. [32] researched an iterative optimization algorithm for the calibration of a stereo deflectometry system. Based on an iterative distortion compensation algorithm, Xu et al. [33] investigated a calibration approach for stereo deflectometry. In addition to the abovementioned error sources, arrangements of the components of a deflectometry system affect the system performance. A performance analysis of geometric parameters is essential for any optical measurement system based on the triangulation principle. Zhang et al. [34] studied the performance analysis of a 3D measurement system based on fringe projection, and Zhao et al. [35] analyzed the influence of four system geometric parameters on a direct phase measuring deflectometry (DPMD) system. Although these approaches involve the development and optimization of system geometric parameters, the methods and research in these studies do not sufficiently cover stereo deflectometry.
In order to improve measurement accuracy, this paper presents a novel geometric parameters analysis in a stereo deflectometry system. Four geometric parameters of stereo deflectometry systems are analyzed: the angle between the measured surface normal and the camera ray, the distance between the measured surface and the camera, the distance between the measured surface and the screen, and the angle between the cameras. The influence of these geometric parameters on the measurement accuracy is reported.
《2. Principle and analysis》2. Principle and analysis
A stereo deflectometry system is typically composed of a liquid crystal display (LCD) screen displaying coded patterns and two charge-coupled device (CCD) cameras capturing the reflected patterns through the reflection of the measured surface. The measurement principle of stereo deflectometry is demonstrated in Fig. 1. The screen displays phase-shifting sinusoidal fringe patterns in sequence. The cameras capture the patterns reflected by the measured surface synchronously. Because the displayed patterns are mutually perpendicular, two orthogonal absolute phase maps in terms of each camera can be acquired by using phase wrapping and unwrapping methods. For an arbitrary point (S1, S2, S3, ...) in space, its image on the camera’s image plane can be calculated based on camera calibration. Its corresponding physical point on the fringe-displaying screen can be obtained by using the relation between the absolute phase value and the physical coordinate on the screen. Therefore, the equivalent normal of the point in space can be acquired from a triangular geometric relationship composed of the point in space, the corresponding point on the camera image plane, and the corresponding point on the screen. During the measurement process, one camera acts as the main camera. Points in space are searched for along the camera rays of the main camera. The other camera is a reference camera; the data from this camera may be used to define the position of the searched points in space. Since normal vectors of the surface point calculated from the main camera and reference camera should be overlapped, initial 3D data with gradient information of the test surface can be discovered by searching for points in space and matching the normal vectors from the cameras. The form of the measured surface is reconstructed by integrating the acquired gradient information [9,10].
《Fig.1》

Fig. 1. Measurement principle of stereo deflectometry.
Three principle error sources directly affect the measurement accuracy of a stereo deflectometry system: calibration error, phase error, and gradient calculation error. Other error sources impact the measurement accuracy by acting on these three error sources. Fig. 2 shows the arrangement of the relevant components in a stereo deflectometry system. In this figure, Ld is the distance between the main camera and the measured object surface, γ denotes the angle between the main camera ray and the surface normal n, and Ls represents the distance between the fringedisplaying screen and the measured object surface. The angle between the main camera and the reference camera is denoted as θ. The geometric parameters γ, Ls, Ld, and h are analyzed for their influence on the three error sources and overall measurement accuracy. These four parameters are independent of each other in geometry. Fig. 3 shows the relationship between the geometric parameters and the error sources. In this figure, the arrows indicate that the factor at the tail of the arrow affects the error source at the arrow head. The geometric parameters affect gradient calculation accuracy independently. Stereo deflectometry measures the form data of a specular surface based on the relative relation between the cameras and the fringe-displaying screen in the system. It is important to perform a calibration process to determine the location of the components in the system. In Fig. 3, the phrase ‘‘calibration accuracy” refers to the accuracy of the calibration process. Calibration accuracy is affected by phase error [33]. Because the cameras in the system focus on the measured object, the captured fringe patterns displayed on the screen are defocused. Ls affects the degree of defocus of the fringe patterns, and leads to a change in phase error. Hence, Ls has an influence on calibration accuracy. Although the distance between the screen and the object also impacts the gradient calculation accuracy through its influence on the degree of defocus of the fringe patterns, the impact from phase accuracy is independent of the influence caused by other geometric parameters. Therefore, the influences of the geometric parameters on the measurement accuracy are not coupled. Fig. 4 provides an overall flowchart to clarify the error analysis procedure. Four error models are investigated to analyze the influence of the geometric parameters. The conclusions of the analysis are then verified through simulation and actual experimentation by modifying the measuring conditions. Finally, an appropriate combination of geometric parameters is obtained.
《Fig.2》
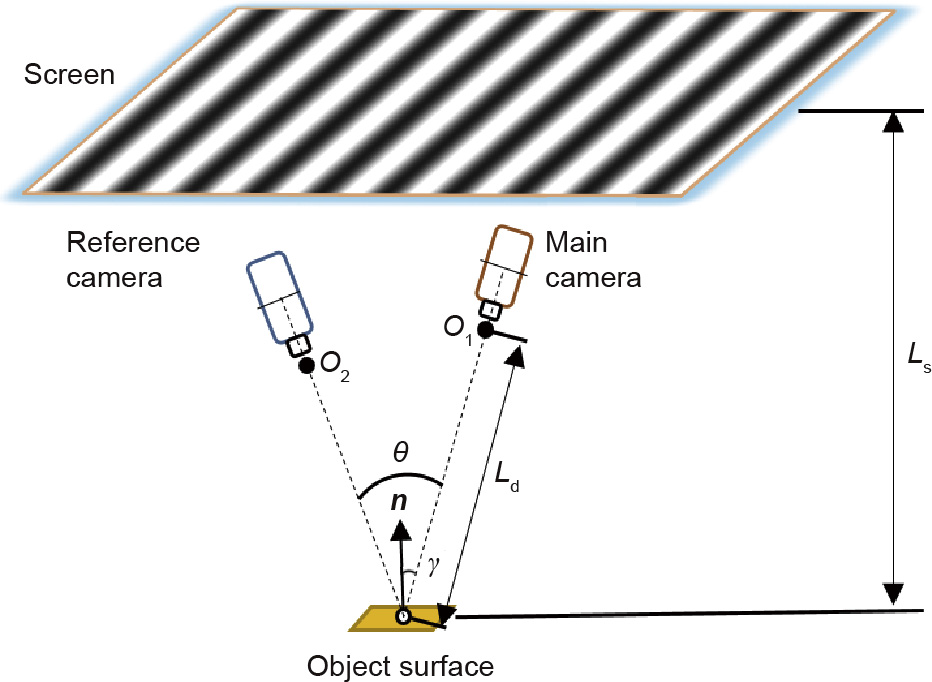
Fig. 2. Arrangement of stereo deflectometry. O1 and O2 are the optical centers of the main camera and the reference camera, respectively.
《Fig.3》
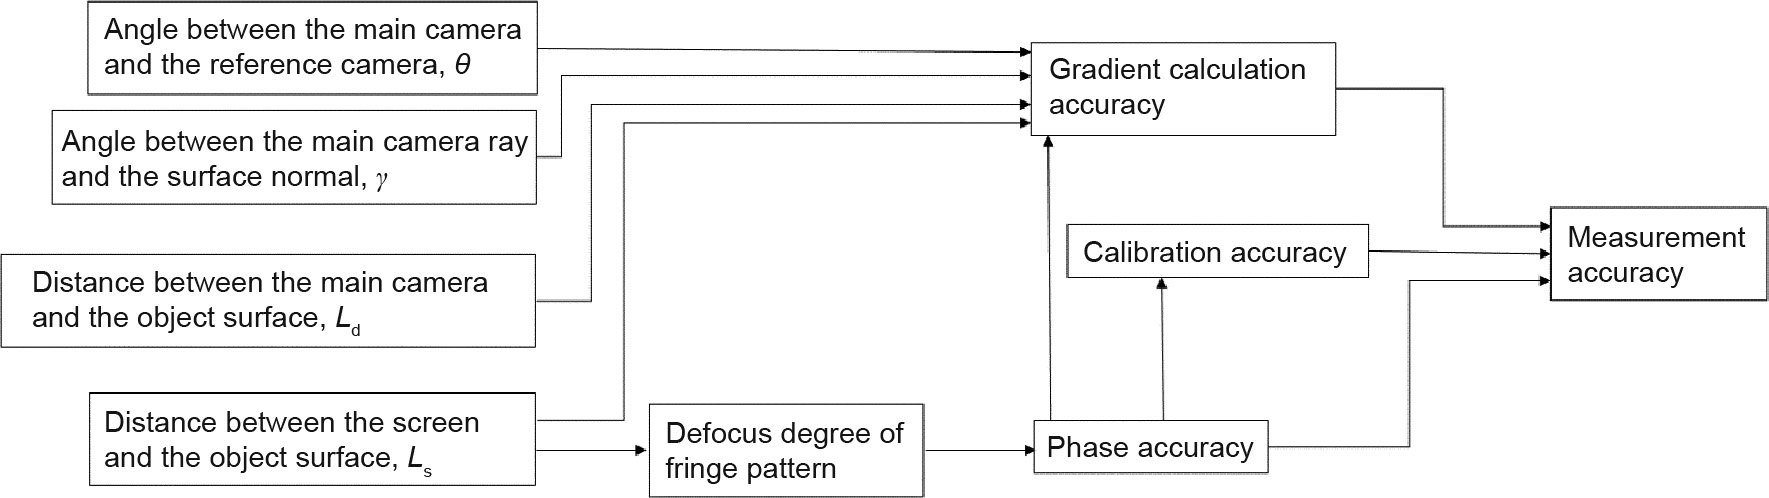
Fig. 3. Relationship between geometric parameters and error sources.
《Fig.4》

Fig. 4. Error analysis procedures.
《2.1. The influence of γ》2.1. The influence of γ
Through the reflection of the measured surface, the image of the displaying screen can be captured directly by the camera in a deflectometry system. The relative positions of the imaging plane of the camera, the measured surface, and the mirrored screen are depicted in Fig. 5. Based on a pinhole model, a point P'L on the mirrored screen is captured by the camera. I is the image of P'L on the imaging plane, and dP0L and dI denote the location uncertainty caused by phase error on the mirrored screen and imaging plane, respectively. When the measured surface is located at Surface 1, the surface is perpendicular to the camera ray. δP'L results in an uncertainty of δS1 on the measured surface. In contrast, when the measured surface is located at Surface 2, where γ is not equal to 0, the uncertainty δS2 caused by δP'L on the measured surface can be described as follows:

The uncertainty δZ along the Z direction can be calculated as follows:

According to Eqs. (1) and (2), it is obvious that δS2 and δZ increase with increasing γ.
《Fig.5》

Fig. 5. Relative positions of the imaging plane of the camera, the measured surface, and the mirrored screen.
2.2. The influence of Ls
In order to illustrate the influence of Ls, the screen of a stereo deflectometry system is first placed at D, and then moved to D', as shown in Fig. 6. I is the image of a point P on the screen through the reflection of the measured surface. The normal n of the surface can be calculated based on the incident ray PS and the reflection ray SI, according to the law of reflection. Because of the influence of phase error, there is a location uncertainty δP for P. n1 and n2 are the calculated normal values affected by δP when the screen is located at D and D', respectively. α1 denotes the angle difference between n1 and n, and α2 represents the angle difference between n2 and n. Since Ls is much larger than δP, the value of α1 and α2 can be calculated according to Eq. (3):

where α is the normal uncertainty caused by δP. It is clear that α decreases with the increase of Ls, according to Eq. (3). However, other factors limit the length of Ls in a stereo deflectometry system. First, because the cameras in stereo deflectometry are required to focus on the measured surface, the fringe patterns on the screen are defocused due to the length of Ls; this results in the increase of δP and α. Second, the curvature of the measured surface blurs the mirrored screen. The increase of Ls increases the degree of fuzziness, which leads to the increase of α as well.
《Fig.6》
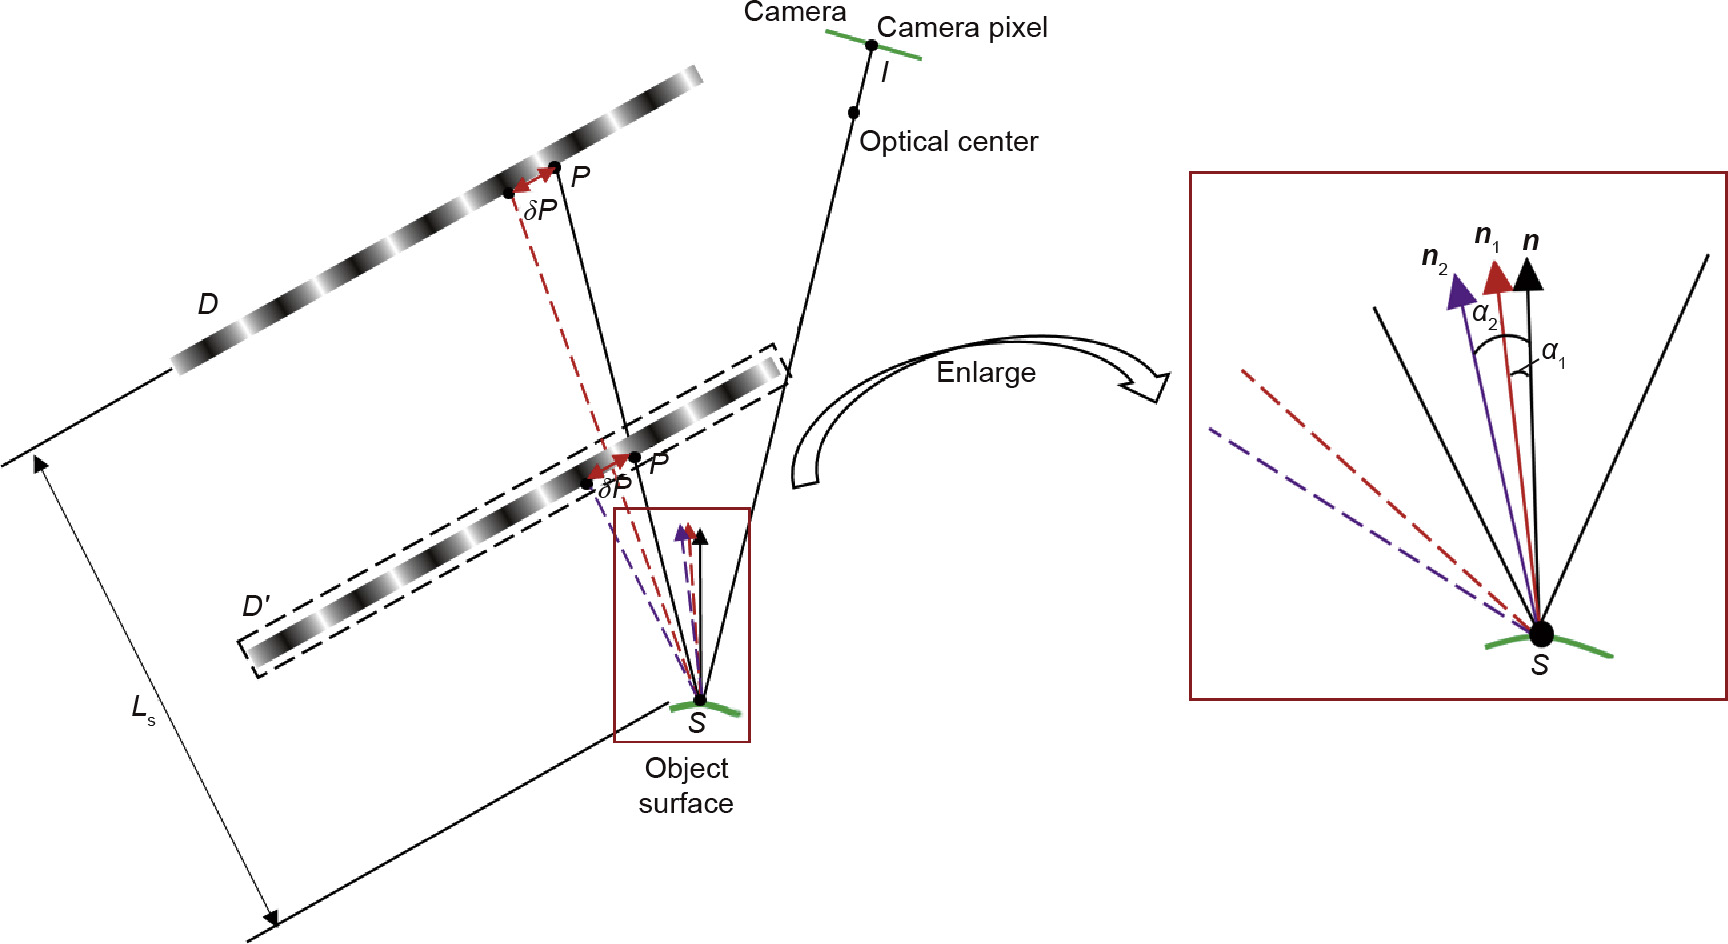
Fig. 6. Illustration of the influence of Ls. S is a point on the measured surface.
《2.3. The influence of Ld》2.3. The influence of Ld
A camera is placed at C and C' successively to analyze the influence of Ld, as shown in Fig. 7. O1 and O'1 are the optical centers of C and C', respectively. The location uncertainty of I is denoted as δI due to the influence of phase error. n1 and n2 are the calculated normal values based on C and C', respectively, considering the influence of δI. The calculation errors of n1 and n2 are represented as β1 and β2. Since Ld is much larger than δI, β1 and β2 can be calculated using Eq. (4):

where β is the normal uncertainty caused by δI. On the one hand, β decreases with an increase of Ld, according to Eq. (4). On the other hand, based on the analysis of Eqs. (1) and (2), increasing Ld enlarges δS2 and δZ, which leads to measurement error. However, if the camera has a long focus length, Ld is far greater than Ls, and Eqs. (1) and (2) can be simplified to Eqs. (5) and (6):


Therefore, the influence of the change in Ld on δS2 and δZ can be neglected.
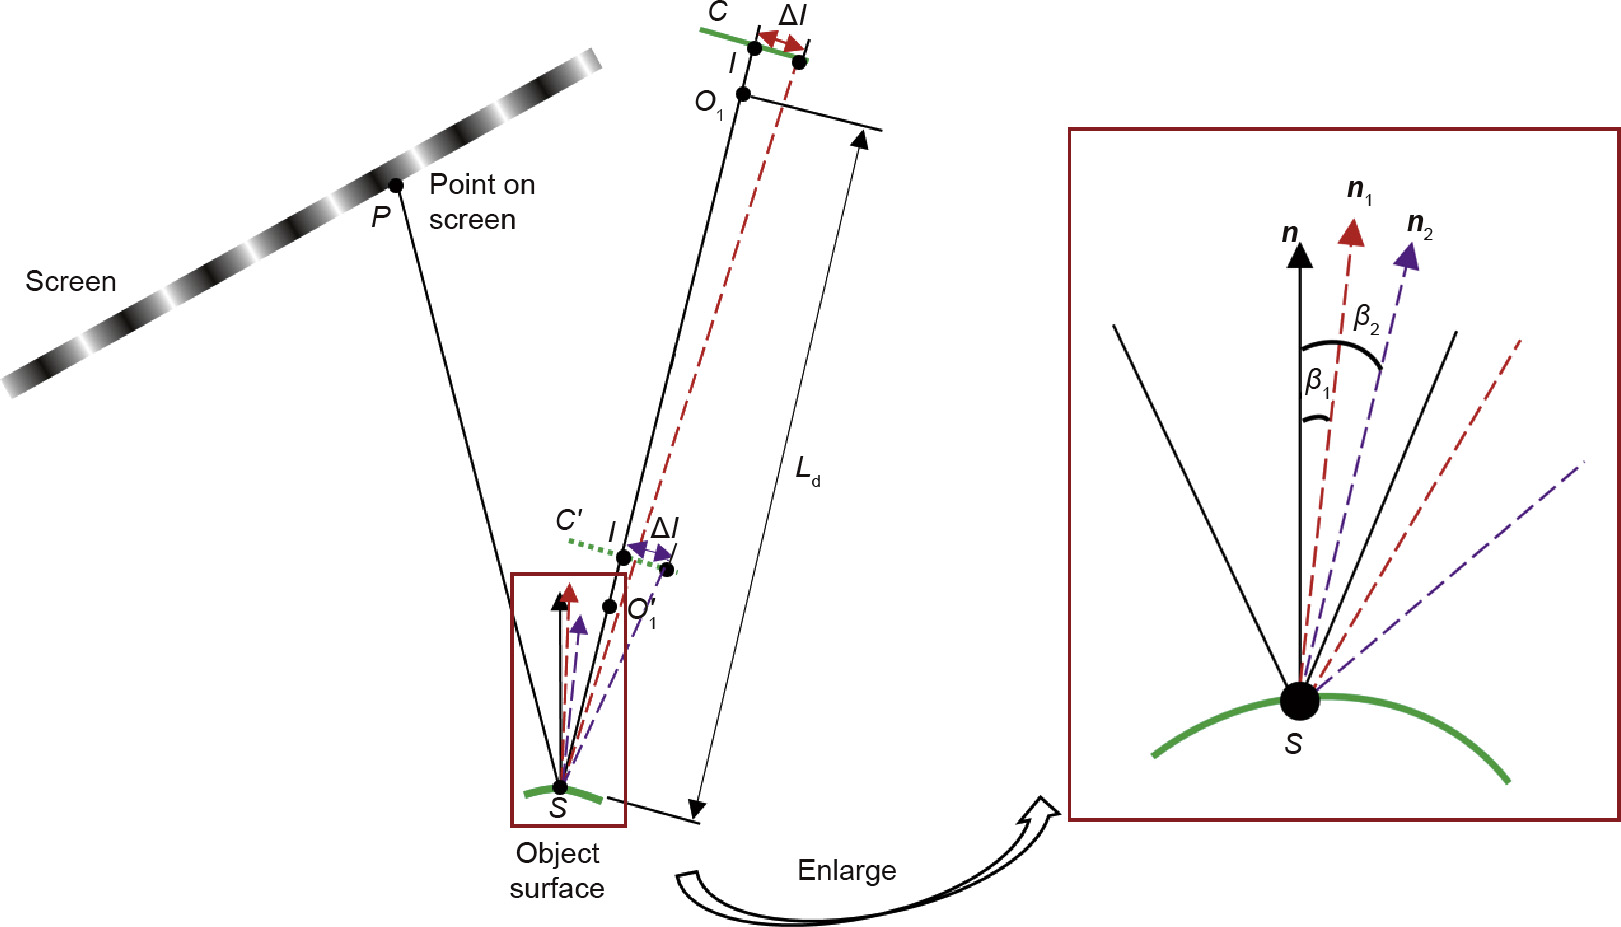
Fig. 7. Illustration of the influence of Ld.
2.4. The influence of θ
The influence of θ is depicted in Fig. 8. The main camera is placed at plane MC, and the reference camera is first tested at plane RC' and then moved to plane RC0 in order to investigate the influence of θ. O1, O2, and O'2 are the optical centers of MC, RC, and RC', respectively. S is a point on the measured surface and I1 is the image of S on MC. P'1 denotes the intersection of the camera ray I1S and the mirrored screen, and P1 represents the actual point on the screen of P'1. The normal n of S can be calculated according to the triangular relationship composed of P1, S, and I1, according to the law of reflection. Based on the same principle, the normal vectors of S' and S'', which are two points on the camera ray of I1S, can be calculated. Fig. 9(a) provides an enlarged view of S'. n11, n21, and n31 denote the calculated normal vectors of S' based on MC, RC, and RC', respectively. Similarly, S'' is enlarged in Fig. 9(b). The calculated normal vectors of S'' from MC, RC, and RC0 are denoted as n12, n22, and n32. Phase error leads to a measurement uncertainty for each calculated normal vector of δ11, δ21, δ31, δ12, δ22, and δ32, as shown in Fig. 9. It is clear that the calculated normal vectors from MC and RC are overlapped. Therefore, points between S' and S'' would be wrongly judged to belong to the measured surface when using MC and RC. In contrast, there is no overlapping between the calculated normal vectors based on MC and RC'. S' and S'' can be determined correctly as not being points on the measured surface. The above analysis indicates that increasing θ can increase the system measurement accuracy.
《Fig.8》
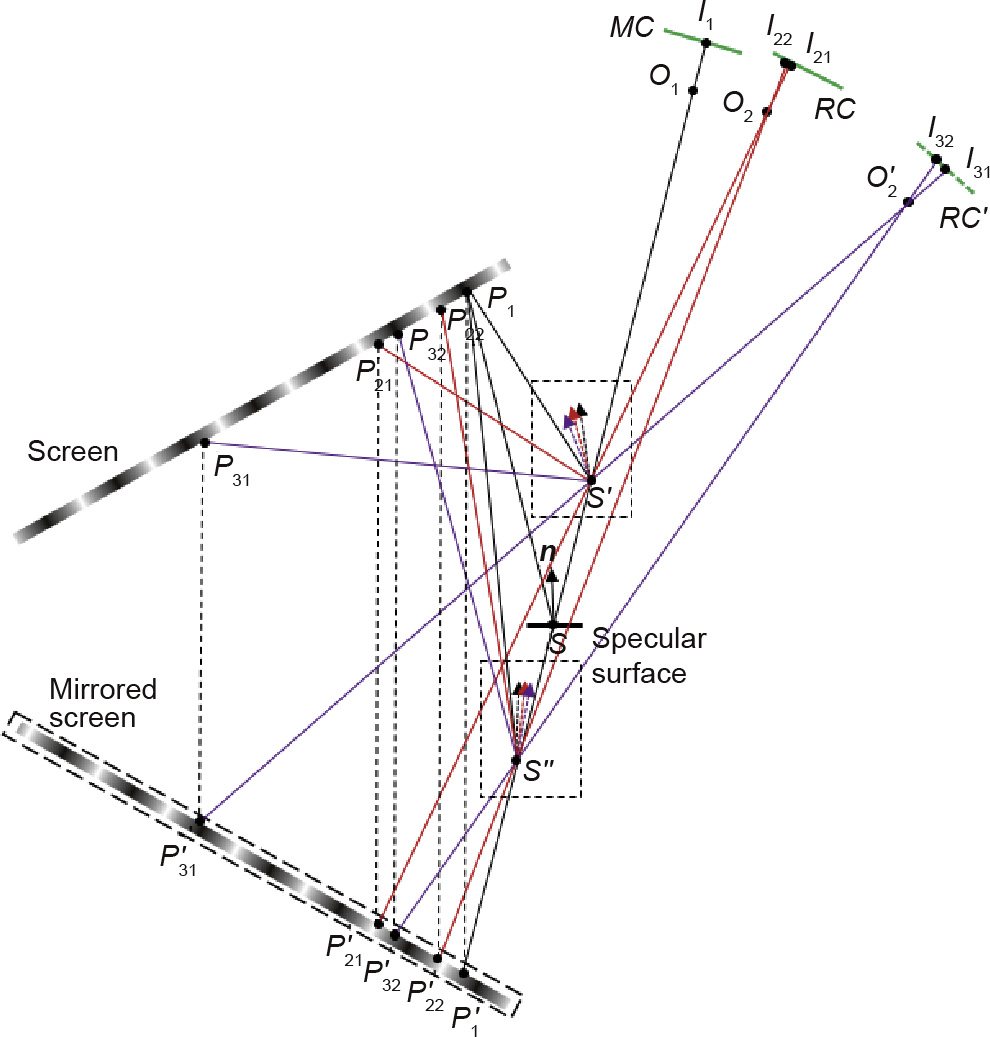
Fig. 8. Illustration of the influence of θ. P21, P22, P31, and P32 are points on the screen. P'21, P'22, P'31, and P' 32 are the points on the mirrored screen. I21, I22, I31, and I32 are image points on the CCD planes.
《Fig.9》

Fig. 9. Enlarged view of the calculated normal values. (a) Enlarged view of S' ; (b) enlarged view of S'' .
3. Experiments
《3.1. Simulation》3.1. Simulation
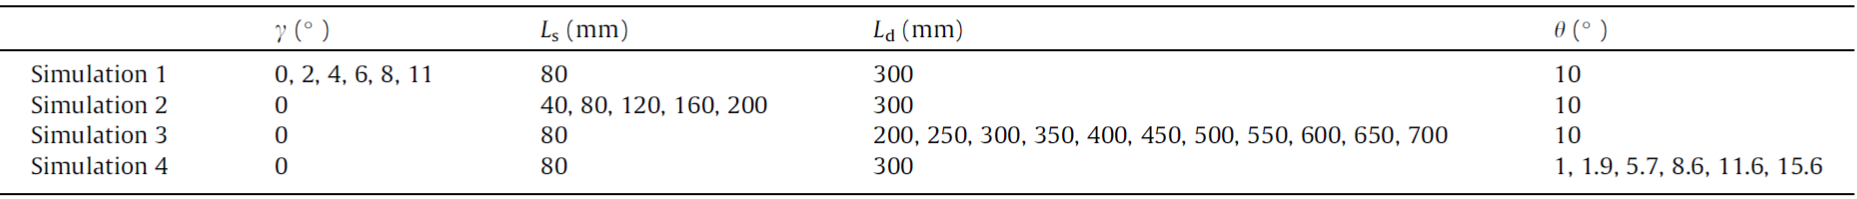
Four simulations were performed to test the proposed performance analysis. The settings of the analyzed geometric parameters in the simulations are listed in Table 1. The simulated main camera and reference camera both have a resolution of 1616 × 1216 pixels. The pixel pitch of the cameras is 0.0035 mm. The fringe-displaying screen in the simulation has a resolution of 1024 ×1024 pixels and a pixel pitch of 0.294 mm. Through the reflection of a simulated flat specular surface, sinusoidal fringe patterns whose period occupies eight pixels of the screen were displayed in turn and captured by the cameras simultaneously. In order to simulate the actual measurement environment, random errors were added into the physical locations of the screen and the camera pixel location based on general experimental results [12,32,33].
《Table 1》Table 1 Parameter settings in simulations.
3.1.1. Verification of the analysis of γ
A simulation was performed to test the influence of γ. In the simulation, Ld, Ls, and θ were set as 300 mm, 80 mm, and 10°, respectively. Random errors with a maximum value of 0.0178 mm and 0.05 pixels were added into the physical locations of the screen and camera pixel, respectively. γ varied from 0° to 11° in increments of 2° or 3°. The relationship between γ and the measurement error was acquired, as shown in Fig. 10(a).
《Fig.10》
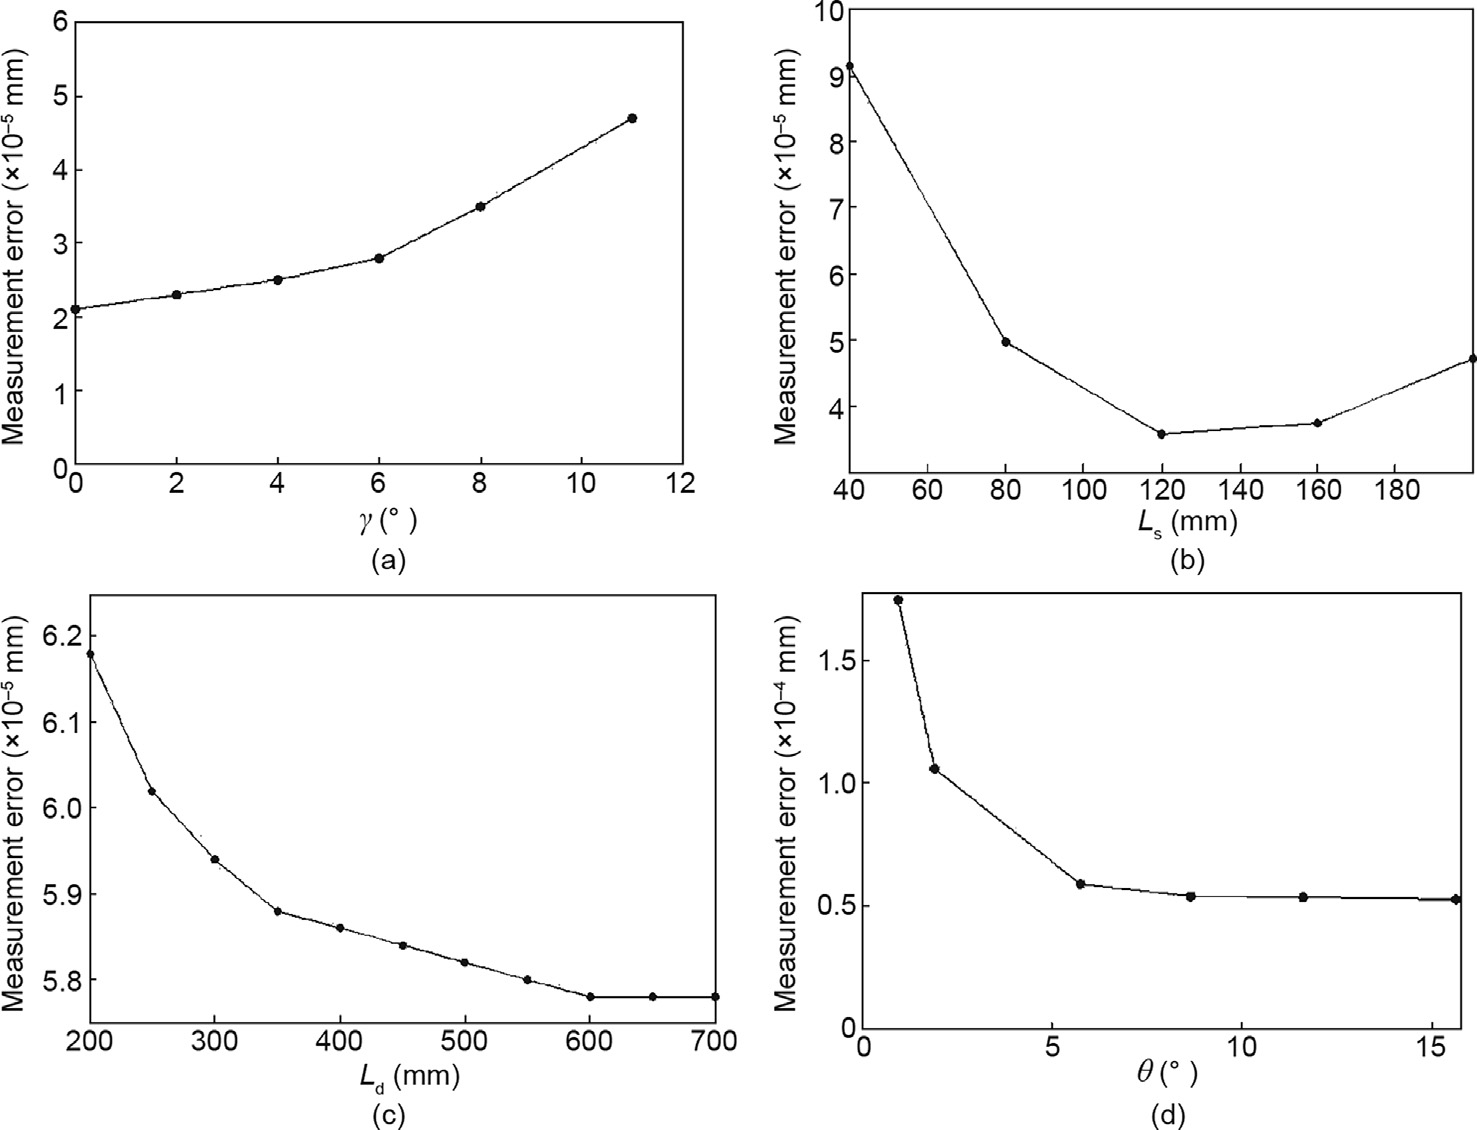
Fig. 10. The obtained relation between geometric parameters and measurement error based on simulation results. (a) Relation between γ and measurement error; (b) relation between Ls and measurement error; (c) relation between Ld and measurement error; (d) relation between θ and measurement error.
Fig. 10(a) shows that with increasing c, the measurement error increases gradually. This increasing trend verifies the analysis in Section 2.1. Therefore, γ should theoretically be 0°. However, because the fringe patterns on the screen must be captured by the cameras through the reflection of the surface, γ cannot be 0° in an actual stereo deflectometry system. In general, γ should be as small as possible.
3.1.2. Verification of the analysis of Ls
Ls varies from 40 to 200 mm in increments of 40 mm. According to the results of the actual experiment, random errors with maximum values of 0.0170, 0.0178, 0.022, 0.033, and 0.051 mm were added to the physical locations of the screen when Ls was 40, 80, 120, 160, and 200 mm, respectively. Random errors with a maximum value of 0.05 pixels were added to the camera pixel location. The relationship between Ls and measurement error is shown in Fig. 10(b).
Fig. 10 (b) shows that the measurement error decreases dramatically when Ls increases from 40 to 120 mm. The main reason for this decreasing trend is that the gradient uncertainty caused by location uncertainty on the screen decreases with increasing Ls, according to Eq. (3). However, because phase errors are magnified with the increase of Ls, the measurement error increases slightly when Ls changes from 120 to 200 mm.
3.1.3. Verification of the analysis of Ld
Ls, θ, and γ were set as 80 mm, 10°, and 0°, respectively, in a simulation to study Ld. Fig. 10(c) shows the relationship between Ld and the measurement error as Ld increased from 200 to 700 mm in increments of 50 mm.
The simulation result shows that with increasing Ld, the measurement error decreases gradually. This decreasing trend confirms the analysis in Section 2.3. Hence, theoretically, Ld should be as large as possible. However, a large Ld results in a similarly large size of the stereo deflectometry system. Thus, in general, Ld should be determined based on an overall consideration of the measurement accuracy and the application.
3.1.4. Verification of the analysis of θ
The relationship between θ and the measurement error was studied through a simulation in which Ls, Ld, and γ were set as 80 mm, 300 mm, and 0°, respectively. Fig. 10(d) shows the experimental result, which shows that the measurement error decreases gradually with increasing θ, and is almost stable from 10° on. This decreasing trend verifies the analysis in Section 2.4. Therefore, in general, θ should be no less 10.
《3.2. Actual experiments》3.2. Actual experiments
Based on the above analysis and simulation results, a measurement system was set up, as shown in Fig. 11. Two Lumenera CCD sensors (Model Lw235M) were used as the main camera and reference camera of the system. The resolution of the sensors was 1616 × 1216 pixels. Xu et al. [12] have determined that decreasing the pixel size of the fringe-displaying screen can increase measurement accuracy. The iPad Pro [36] has an ultrafine pixel size of 0.096 mm, which is much smaller than the most common display pixel size (around 0.3 mm). Therefore, under the control of Display Duet [37], an iPad Pro with a size of 12.9 in (1 in = 2.54 cm) was used as the fringe-displaying screen. The system was calibrated with the method proposed in Ref. [33].
《Fig.11》
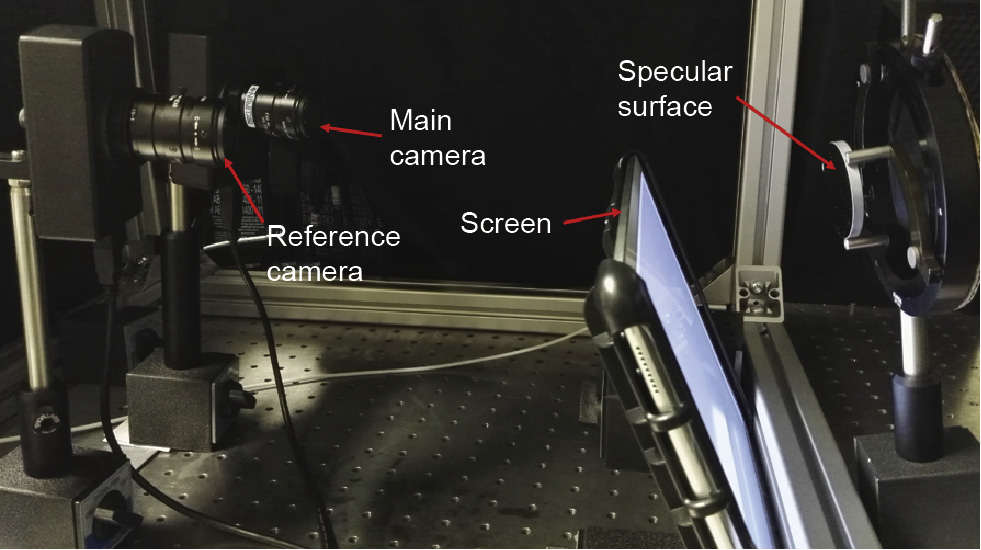
Fig. 11. Setup of the stereo deflectometry system.
First, experiments were conducted to investigate the influence of Ls on phase error. Since the cameras in a stereo deflectometry system are required to focus on the measured surface, Ls causes the mirrored screen to be out of the depth of focus of the cameras, and therefore blurs the captured fringe patterns. The phase error increases with an increase of the degree of fuzziness, which leads to a decrease in measurement accuracy.
The relation between Ls and the phase error was investigated through actual experimentation. The errors of absolute phase maps can be obtained when Ls varies from 0 to 200 mm in increments of 40 mm by applying phase-shifting and phase-unwrapping techniques [38,39]. Fig. 12 shows the experimental result. When Ls is 0 mm, the phase error is 0.0415 rad, which is significantly larger than the phase error (0.0151 rad) obtained when Ls is 40 mm. The reason for this phenomenon is that when the camera is focused on the mirrored screen, LCD pixel grids and a moiré fringe [40] are recorded by the camera. The recorded pixel grids and moiré fringe generate large errors on the phase maps. When Ls is greater than 40 mm, the phase error increases dramatically with increasing Ls. The main reason for this increasing trend is that the degree of defocus of the mirrored screen is magnified with an increase in Ls. The experimental results were used to provide the correct phase errors for the abovementioned simulation study of Ls.
《Fig.12》

Fig. 12. Relation between Ls and phase error.
In addition to image blurring brought about by defocusing, curvature of the measured surface blurs the mirrored fringe patterns. In order to demonstrate this point, an experiment was carried out to capture the fringe patterns reflected from mirrors with different curvatures. Three mirrors were tested: a flat mirror, a concave mirror with a 200 mm radius of curvature (f), and a concave mirror with a 100 mm radius of curvature. Fig. 13 shows the captured fringe patterns when Ls is 80 and 120 mm. The results demonstrate that with increasing mirror curvature, fringe density decreases and blurring increases. Increasing Ls will amplify the influence of the mirror’s curvature. Therefore, Ls should be around 80 mm when comprehensively considering the measurement accuracy and measurement range of the mirror curvature.
《Fig.13》

Fig. 13. Relation between mirrored fringe pattern and mirror curvature. (a) Flat mirror when Ls is 80 mm; (b) concave mirror with 200 mm radius of curvature when Ls is 80 mm; (c) concave mirror with 100 mm radius of curvature when Ls is 80 mm; (d) flat mirror when Ls is 120 mm; (e) concave mirror with 200 mm radius of curvature when Ls is 120 mm; (f) concave mirror with 100 mm radius of curvature when Ls is 120 mm.
An additional experiment was performed using an optical flat with λ/20 flatness from Edmund [41]. In the experiment, γ was changed to the following four values: 10°, 15°, 20°, and 25°. Fig. 14(a) shows that the measurement errors increase significantly with increasing γ. This result confirms the results of the analysis described earlier. Fig. 14(b) shows that the measurement errors have a similar trend to the simulation results when Ls is altered to 60, 80, 100, and 120 mm. Fig. 14(c) shows the influence of Ld on the measurement accuracy. When Ld is increased from 250 to 320 mm, the measurement errors decrease gradually. This result corresponds to the analysis above of Ld. Fig. 14(d) shows the trend in measurement errors for four different values of θ: 10°, 15°, 20°, and 25°. The measurement errors change slightly from 10, which corresponds to the trend shown in the simulation. It is difficult to conduct a quantitative comparison between experimental results and simulation results because the experimental conditions in an actual experiment, such as the degree of defocus of the cameras and the measurement field, cannot be simulated accurately. The difference in experimental conditions will affect the measurement result. Therefore, the proposed performance analyses were qualitatively tested by comparing the trend of the measurement results.
《Fig.14》
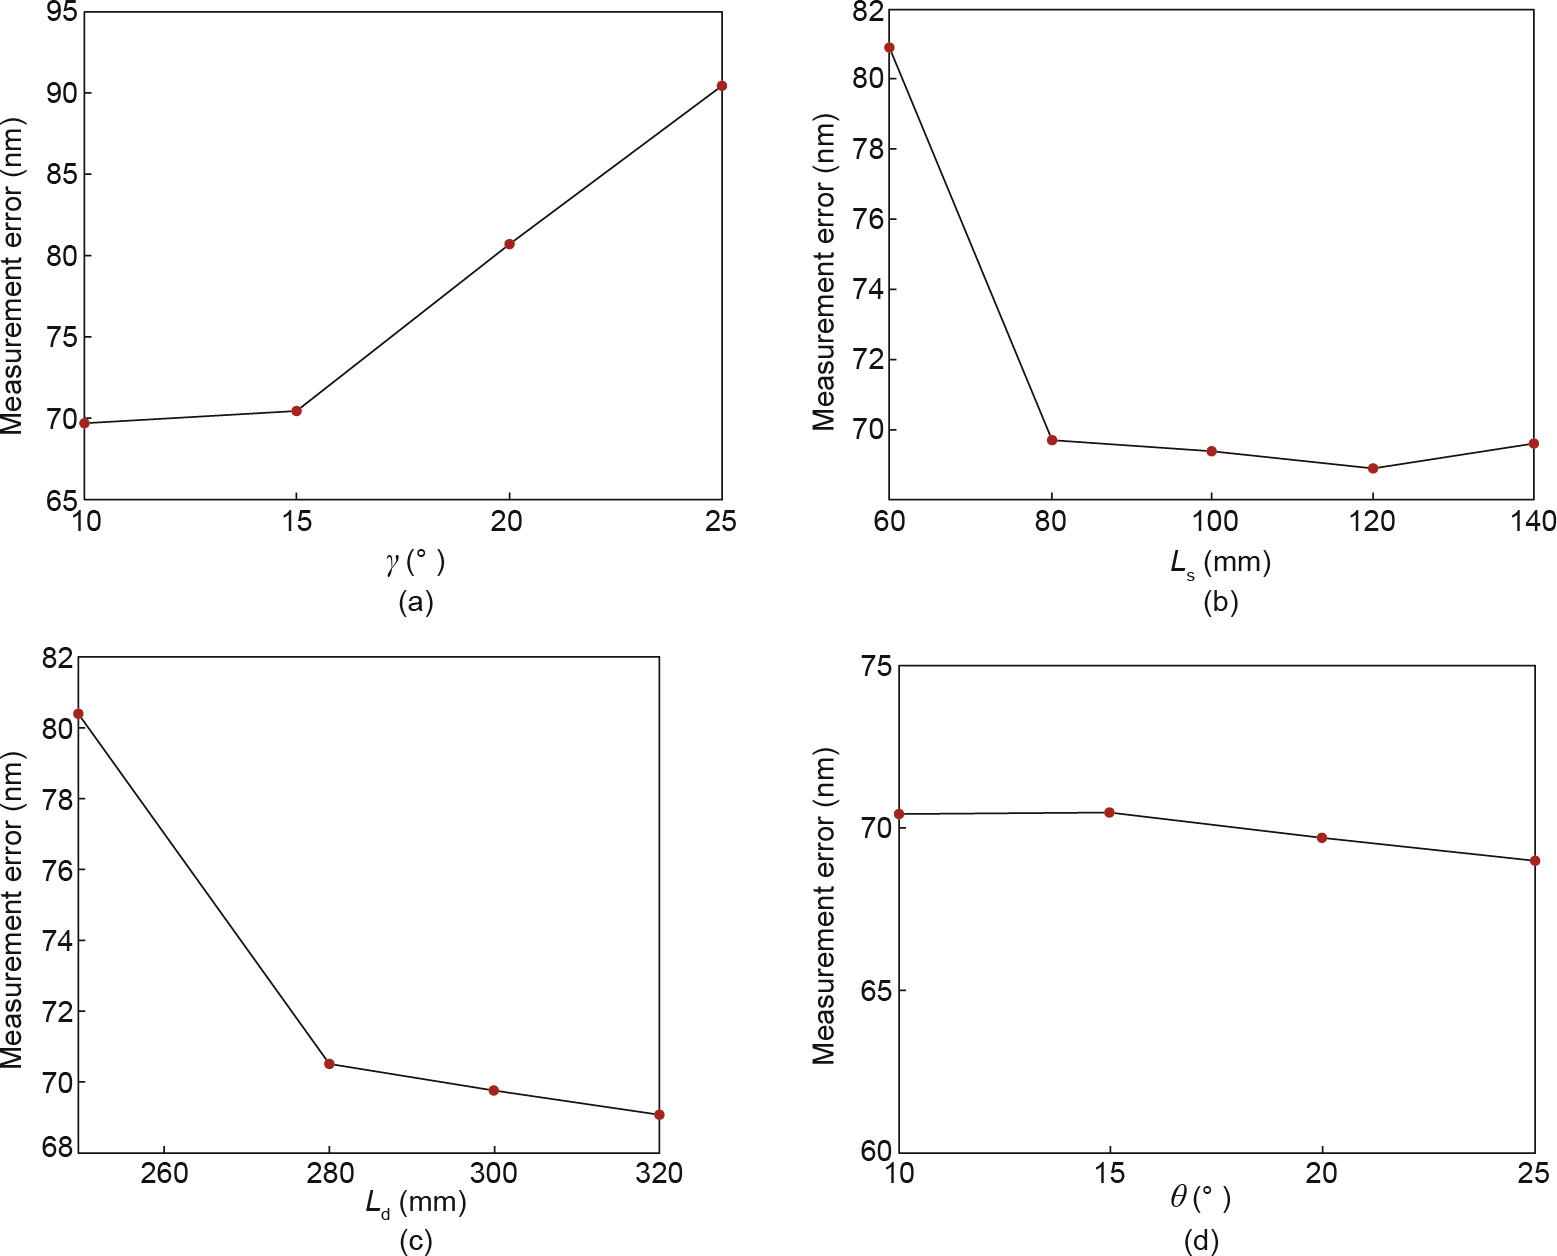
Fig. 14. Obtained relation between geometric parameters and measurement error based on actual experimental results. (a) Relation between γ and measurement error; (b) relation between Ls and measurement error; (c) relation between Ld and measurement error; (d) relation between θ and measurement error.
The geometric parameters of the measurement system were determined according to the proposed performance analysis. θ was set at 10° and Ld was set at 300 mm in consideration of the size limit of the measurement system. Ls was chosen to be 80 mm. γ was designed to be 10 in order to ensure that the displayed patterns could be "seen” by the cameras. In order to quantitatively evaluate the measurement accuracy of the stereo deflectometry system, a concave mirror (stock #40-913) from Edmund with λ/8 surface accuracy was measured. Fig. 15(a) shows one of the images captured from the main camera with deformed fringe information. The diameter of the measurement field of the system is about 2 in. The test mirror was larger than the measurement field; therefore, the central section of the mirror was measured. Fig. 15(b) shows the measured form of the test mirror. The peak value (PV) of the difference between the measurement result and the surface parameters provided by the manufacturer was 154.2 nm, as shown in Fig. 15(c). These measurement results demonstrate that a measurement system design based on the proposed performance analysis can acquire the form of a specular surface with high precision.
《Fig.15》

Fig. 15. Measurement result of a stock concave mirror. (a) Captured image of a concave mirror; (b) obtained form of the mirror; (c) measurement difference.
《4. Conclusions》
4. Conclusions
In order to improve the measurement accuracy of stereo deflectometry, the influence of four geometric parameters was investigated through error model analysis, simulation testing, and experimental verification. This performance analysis will optimize the design of a stereo deflectometry system and decrease the measurement error caused by system component positioning error.
Future work will include applying the designed stereo deflectometry system to industrial applications, such as by embedding stereo deflectometry into an ultra-precision machining system in order to achieve online measurement, and using stereo deflectometry in vehicle detection for the inspection of defects in car windows and bodies.
《Acknowledgements》
Acknowledgements
The authors gratefully acknowledge the UK’s Engineering and Physical Sciences Research Council (EPSRC) funding of the EPSRC Centre for Innovative Manufacturing in Advanced Metrology (EP/I033424/1), the EPSRC Future Advanced Metrology Hub (EP/P006930/1), and the EPSRC funding (EP/K018345/1).
《Compliance with ethics guidelines》
Compliance with ethics guidelines
Yongjia Xu, Feng Gao, and Xiangqian Jiang declare that they have no conflict of interest or financial conflicts to disclose.


 京公网安备 11010502051620号


