
《1 Introduction》
1 Introduction
Water resources contribute significantly to economic and social development in Northwest China. As the main reserve of light, heat, and land resources in China [1], Northwest China provides significant benefit to the economic construction, social stability, and national defense security of China [2]. Agricultural development is indispensable to the promotion of Northwest China. However, Northwest China is the most water-deficient region in China; it is associated with an arid climate, low rainfall, and high evaporation. The total water resource in Northwest China constitutes only 5.7% of the country's level, and the amount of water resources per unit area is only 15% of the national average water level. In particular, agricultural water constitutes 80% of the total water consumption in Northwest China. The contradiction between the supply and demand of water resources is prominent, the allocation of water and soil resources is unbalanced, and the level of economic development is restricted significantly [3]. Therefore, fully alleviating the severe pressure faced by water resources, reliably carrying the sustainable development of the agricultural economy, and stably supporting regional food supply security are key to realizing healthy and sustainable development in Northwest China.
The concept of virtual water was proposed at the end of the 20th century [4], which provided a new research perspective for solving water shortage [5]. It allowed researchers to re-examine issues such as food security, water security, and agricultural product trade from the perspective of virtual water. After years of development, the academic community combined the concepts of virtual water and water footprint. Researchers believe that the demand for water resources during the production and consumption of agricultural products can be termed, “water footprint of agricultural product production (consumption),” and that the term virtual water is to be used only when agricultural products are traded [6]. Currently, water footprint and virtual water are the focus of research and application in relevant fields. In particular, changes in temporal and spatial differences, the calculation of water footprint of specific agricultural products, and the coupling relationship between water footprint/virtual water and the economic level are emphasized [7,8]. However, studies regarding trade and the method to solve the imbalance of water and soil resource allocation under the current virtual water flow are scarce.
Currently, almost all inland rivers in Northwest China are over-exploited. The center of gravity of areas that produce main crops, such as grain, cotton, and fruits, continues to shift northward, thereby causing the locals consume 30%–40% of water resources to maintain the trade of agricultural products. The local water resources cannot adequately support the sustainable development goals of the economy and society, and the water security in Northwest China is in jeopardy in the medium and long terms. Hence, in this study, we analyze the composition and spatio–temporal characteristics of the water footprint of bulk crop production, evaluate the effect of virtual water flow on regional water resources, and propose new development ideas to solve the safety of water resources in Northwest China such that improvement suggestions can be provided for maintaining the virtual water economy development model at the expense of the ecological environment.
《2 Demand analysis of water resource regulation in Northwest China》
2 Demand analysis of water resource regulation in Northwest China
《2.1 Shortage of water resources》
2.1 Shortage of water resources
Northwest China is an important reserve base for grain production in China. It produces 12% of the country’s grain [9] using 10% of the country’s water resources and 15% of the grain planting area, and participates in 65% of the tasks pertaining to new grain production. However, the multiyear average surface water resource in Northwest China is 1.426 × 10¹¹ m3, the groundwater resource is 6.996 × 10¹⁰ m3, and the multiyear average total water resource is only 1.593 × 10¹¹ m3 (by deducting the repeated amount, it constitutes only 5.7% of the national total). Therefore, it is the most water-scarce region in China [1].
In recent decades, climate warming and humidification in China have intensified. For example, the average temperature increase rate in Northwest China is 0.4 °C/10a, and the precipitation increase rate is 10.1 mm/10a [10]. However, from the perspective of regional water resources, the improvement afforded by this warm and humid trend is insignificant: (1) The precipitation depth in Northwest China is generally 150–250 mm/a, and the growth trend of 1 mm/a would not significantly change the rainfall characteristics; (2) owing to the severe drought in Northwest China, the evaporation of river and water surface is high, and the potential evapotranspiration is more than five times that of precipitation. The increase in water resources caused by warming and humidification did not significantly change the drought characteristics of this area; (3) the rainfall in the east of Northwest China did not increase.
《2.2 Significant amount of development and utilization but low efficiency》
2.2 Significant amount of development and utilization but low efficiency
The development and utilization rate of water resources in Northwest China is high, the water resources are severely overloaded, and water safety cannot be guaranteed. In recent years, the development and utilization rate of water resources in China has been 22.6%, whereas that in Northwest China reached 59.8%, including 62.6% in the Yellow River Basin and 56.3% in the inland river basin. In particular, the development and utilization rates of water resources in the Shiyang River Basin, Heihe River Basin, Tarim River Basin, and Junggar Basin reached maximum values of 154%, 112%, 91%, and 92%, respectively.
Meanwhile, the water use efficiency in Northwest China is relatively low. Under the comprehensive effect of objective (arid and semi-arid areas) and subjective factors, the farmland irrigation quota in Northwest China in 2018 is 476.59 m3/mu (1 mu ≈ 666.67 m2), which is 1.31 of the national average. The output of GDP per unit water is 44.6 CNY/m3, which is only 30 % of the national average.
《2.3 Unreasonable water structure》
2.3 Unreasonable water structure
From the perspective of water supply structure, the total water supply in Northwest China reached 9.29 × 10¹⁰ m3 in 2018, of which surface water constituted 7.16 × 10¹⁰ m3 (i.e., 77.1%), groundwater constituted 2.016 × 10¹⁰ m3 (i.e., 21.7%), and sewage reuse and rainwater utilization constituted 1.133 × 10⁹ m3 (i.e., 1.2 %). From the perspective of water use structure, the consumption of agricultural water is 7.71 × 10¹⁰ m3 (i.e., 83%), whereas those of industrial water and domestic water are 5.117 × 10⁹ m3 (i.e., 5.5%) and 3.581 × 10⁹ m3 (i.e., 3.8%), respectively. These data show that the consumption of agricultural water in Northwest China is excessive and that the water use structure is unreasonable. The development trend of water use shows that the importance of ecological construction in Northwest China has increased in the past two decades. However, owing to limitations by the development level and development model, agriculture remains the most important industry in China.
Whether water resources can continue to support the development of Northwest China based on agriculture remains unclear owing to restrictions arising from the fragility of water resources and ecological environment. Typically, most agricultural products in Northwest China are transferred to the central and eastern regions in the form of virtual water. For example, the Xinjiang Uygur Autonomous Region produces more than 80% of the country's cotton and supplies a significant amount of high-quality fruits for the country. The approach to maintain this "virtual water economy" at the expense of the ecological environment remains to be identified for the sustainable development of Northwest China.
《3 Research methods and data sources》
3 Research methods and data sources
《3.1 Study area》
3.1 Study area
Northwest China is demarcated by the three water lines (TWL), i.e., the Hu Huanyong Line, Yangguan Line, and Qice Line, which categorize the region based on characteristics such as landform, human geography, hydrometeorology, and water resource distribution [1]. Among those lines, the Hu Huanyong Line demarcates a region with 400 mm of precipitation. The Yangguan Line separates the extreme arid area (annual precipitation of less than 100 mm) from the arid area. The Qice Line demarcates Xinjiang into southeastern and northwestern regions with approximately the same area. In particular, the northwestern region constitutes 93% of the water resources, 87% of the population, and 89% of the GDP.
Combined with water resource zoning and municipal administrative counties, the TWL of Northwest China are classified into the northwest of the Qice Line (QCXXB), southwest of the Qice Line (QCXXN), northeast of the Qice Line (QCXDB), southeast of the Qice Line (QCXDN), Hexi inland river basin (HX), Qaidam Basin (CDM), semi-arid grassland area (BGH), and Yellow River Basin area (HH).
《3.2 Methods》
3.2 Methods
Crop production water footprint (𝑊, m3/kg) refers to the amount of water resources consumed by crops per unit mass during production and includes the green water footprint (soil water, 𝑊g𝑟𝑒𝑒𝑛) and blue water footprint (irrigation water, 𝑊b𝑙𝑢𝑒) [11,12]. The Water Footprint Evaluation Manual [13] specifies that the water footprint is to be calculated as follows:
\(W=W_{\text {green }}+W_{\text {blue }}=10 E_{c} / Y \) (1)
\(E_{\text {green }}=\min \left(E_{c}, P_{\text {eff }}\right)\) (2)
\(E_{\text {blue }}=\max \left(0, E_{c}-P_{\text {eff }}\right) \) (3)
\(E_{c}=E_{0} \times K_{c}\) (4)
where y is the yield pre crop (kg/hm2); the constant factor 10 is the conversion coefficient of converting the depth of water (mm) into the water volume per unit land area (m3/hm2); Egreen and Eblue are the effective precipitation and irrigation water of crop evapotranspiration (mm); Kc is the crop coefficient; Peff is the effective precipitation used during the crop growth period (mm); E0 is the potential crop evapotranspiration (calculated using the Penman–Monteith formula, mm/d).
Crop consumption water footprint (𝑊con) refers to the amount of water resources contained in consumer goods that is consumed by residents in the region. 𝑊con is calculated as follows:
\(W_{\text {con }}=\sum_{i=1}^{n} W_{i} \times P_{i}\) (5)
\(P_{i}=P_{\text {city }} \times N_{\text {city }}+P_{\text {country }} \times N_{\text {country }}\) (6)
where 𝑊con is the total water footprint of agricultural product consumption in the study area (m3); i represents the type of agricultural product consumed; Pi is the total annual consumption of this type of agricultural product; Pcity and Pcountry are the urban and rural per capita consumption of this type of agricultural product in the corresponding year, respectively; Ncity and Ncountry are the urban and rural resident populations in the corresponding year, respectively.
The virtual water flow process of regional agriculture in the production–consumption model is used to compare the relationship between the total production water footprint and the total consumption water footprint of agricultural products in the region [14].
When analyzing the virtual water flow in the region, the agricultural products consumed are assumed to be from the region, and all the remaining agricultural products after consumption are exported. The corresponding calculation formula is as follows:
\(W_{\text {flow }}=W-W_{\text {con }}\) (7)
where Wflow is the virtual water flow, W the regional virtual water production, and Wcon the regional virtual water consumption. If W > Wcon, i.e., the virtual water in the region is exported to other regions (countries), then the difference is the output. If W < Wcon, the regional virtual water must be input from other regions (countries), and the difference is the input amount.
The water stress index (β) [15] is used to reflect the occupancy of the regional production water footprint on the available water resources in the region. It is calculated as follows:
\(\beta=\frac{W}{G}\) (8)
where G is the amount of available regional water resources.
《3.3 Data sources》
3.3 Data sources
Daily meteorological dates were obtained from 181 meteorological stations in the TWL during the period 2000–2018 in this study. The meteorological data includes the daily maximum temperature, minimum temperature, wind speed, relative humidity, sunshine duration, precipitation, and water vapor pressure. The China Meteorological Data Service Center (http://data.cma.cn/) provided those data, whose missing data rate was less than 0.1%. A few missing data were interpolated based on data from neighboring stations. The data of crop yield, sowing area, consumption, and population were derived from the statistical and economic yearbooks of relevant provinces. The amount of available water resources was based on the water resource bulletin of relevant provinces.
《4 Trend analysis of agricultural production and trade water use in Northwest China》
4 Trend analysis of agricultural production and trade water use in Northwest China
《4.1 Crop production water footprint》
4.1 Crop production water footprint
From 2000 to 2018, the 𝑊 of the TWL first increased and then decreased. Specifically, it increased from 1.243 × 10¹¹ m3 in 2000 to 1.7 × 10¹¹ m3 in 2015, and then decreased continuously owing to the decrease in the crop planting area. From the perspective of water use structure, the proportions of 𝑊g𝑟𝑒𝑒𝑛 and 𝑊blue remained at 67.2%–72 % and 28.0%–32.8%, respectively (Table 1), which were associated with the lower amount of rainfall in the TWL and the necessity for supplementing more irrigation water.
《Table 1》
Table 1. 𝑊 and proportions of 𝑊g𝑟𝑒𝑒𝑛 and 𝑊blue in TWL(2000–2018).
| Type | 2000 | 2005 | 2010 | 2015 | 2018 |
| 𝑊blue (×108 m3) | 894.9 | 887.6 | 1027.3 | 1202.7 | 1080 |
| Raito (%) | 72 | 69.7 | 67.2 | 70.7 | 67.5 |
| 𝑊g𝑟𝑒𝑒𝑛 (×108 m3) | 347.8 | 386.5 | 502.4 | 497.5 | 520.8 |
| Raito (%) | 28 | 30.3 | 32.8 | 29.3 | 32.5 |
| 𝑊 (×108 m3) | 1242.7 | 1274.1 | 1529.7 | 1700.1 | 1600.8 |
The temporal and spatial changes in the 𝑊 of the TWL from 2000 to 2018 differed significantly (Fig. 1). From the perspective of time distribution, QCXXN, QCXXB, and HH changed significantly. Based on year 2015 as the cutoff point, the 𝑊 first increased and then decreased. The 𝑊 of BGH and HX had been increasing in the past two decades, with annual growth rates of 23.2% and 27.8%, respectively. The changes in the 𝑊 of QCXDB and QCXDN were slight, i.e., it increased by only 9.4 × 10⁸ m3 and 34.5 × 10⁹ m3, respectively. The 𝑊 of CDM differed significantly from those of the other districts, which remained at 6 × 10⁸–8.9 × 10⁸ m3.
《Fig.1》
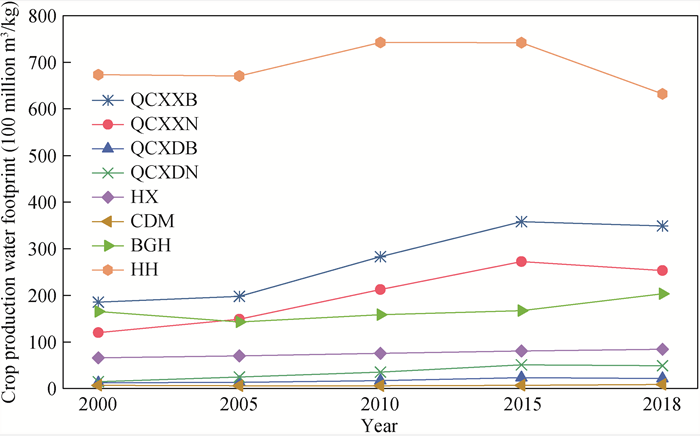
Fig.1. Change trend of crop production water footprint in TWL (2000–2018).
Spatially, the W of HH was the largest (6.319 × 10¹⁰ m3), followed by that of QCXXB (Fig. 1). The crops in these two regions constituted more than 60% of the total production, and the agricultural water consumption was high. The W of BGH and QCXXN was 1 × 10¹⁰–3 × 10¹⁰, whereas those of the other four regions were less than 1 × 10¹⁰ m3. Among them, CDM constituted the smallest proportion (only 0.4%–0.6%), which was associated closely with the local crop growth pattern. The average annual crop yield of CDM was only 2.7 × 10⁵ t, and the annual average crop planting area was only 7.42 × 10⁴ hm2, which constituted 0.5% of the planting area of the TWL.
From 2000 to 2018, the evolution of the proportion of W in the TWL is as shown in Fig. 2. The average W ratio of specific crops over the years is ranked in the following order: grain > fruit > cotton > oilseeds > vegetable > grass. The proportion of W of grain decreases (from 67.4% in 2000 to 54.3% in 2018), whereas the proportion of W of fruit and cotton increases significantly (from 9.1% and 7.4% in 2000 to 15% and 13.8% in 2018, respectively). This is associated closely with changes in the crop planting area and planting structure. The planting area of grain decreases by 13.1% from 2000 to 2018, whereas the planting areas of cotton and fruit increase by 7.1% and 5.8%, respectively.
《Fig.2》

Fig.2. Evolution of proportion of crop production water footprint in TWL (2000–2018).
The structure characteristics of W in specific districts of the TWL in 2018 is shown in Fig. 3. Fruits constituted the largest proportion of W in QCXDB (55.9%). The W of QCXDN is primarily cotton (45.6 %). The W of HX, CDM, BGH, and HH is primarily grain (constituting 68.2%, 64.6%, 69.9%, and 65.4%, respectively). The W of QCXXB and QCXXN are primarily grain and cotton, respectively.
《Fig.3》

Fig.3. Structure characteristics of W in TWL (2018).
《4.2 Crop virtual water flow》
4.2 Crop virtual water flow
The TWL is a virtual water export area whose output increased from 8.55 × 10⁹ m3 in 2000 to 2.178 × 10¹⁰ m3 in 2018. BGH, HX, QCXXN, QCXXB, QCXDN, and QCXDB were the main outflow areas. Among them, the output of QCXXB virtual water was the highest, i.e., 49.7%– 83.5% of the total output of the Qice Line, and it increased continuously (from 9.87 × 10⁹ m3 in 2000 to 1.528 × 10¹⁰ m3 in 2018). HH was the main inflow area, and the inflow increased from 7.96 × 10⁸ m3 in 2000 to 1.144 × 10¹⁰ m3 in 2018. Under the effects of production and the consumption structure, the Wflow in CDM changed significantly from the outflow area to the inflow area since 2005 (Table 2). Virtual water outflow gradually became an important reason affecting the shortage of water resources in the TWL, which posed a direct threat to the local water security.
《Table 2》
Table 2. Evolution trend of Wflow in TWL (2000–2018).
| Area | 2000 | 2005 | 2010 | 2015 | 2018 |
| BGH | 26.8 | 26.5 | 12.1 | 5.4 | 50.5 |
| HH | −79.6 | −90.0 | −0.7 | −100.8 | −114.4 |
| HX | 17.5 | 18.2 | 21.7 | 20.8 | 22.6 |
| CDM | 2.7 | −1.2 | −1.3 | −4.3 | −2.2 |
| QCXDB | 0.4 | 0.1 | 4 | 5.6 | 3.9 |
| QCXDN | 2.8 | 7.6 | 18.6 | 26.7 | 27.2 |
| QCXXB | 98.7 | 81.2 | 129.4 | 130.2 | 152.9 |
| QCXXN | 16.3 | 19.9 | 77.4 | 99.5 | 77.2 |
| Total | 85.5 | 62.2 | 261.1 | 183.1 | 217.8 |
Note: The positive and negative values of Wflow are expressed as the output and input amounts, respectively.
The export volume of virtual water from the TWL increased from 2000 to 2018, where cotton and fruit were the main crops (Fig. 4). The average annual yield of these two crops constituted 23.5% of the total crop yield in the TWL; their export volumes increased from 7.59 × 10⁹ and 6.68×10⁹ m3 (2000) to 2.026 × 10¹⁰ m3 and 1.186 × 10¹⁰ m3 (2018), respectively. The import of virtual water was primarily due to grain, as the grain consumption of residents in the region relies on imports. The water footprint of regional grain production could not satisfy the regional consumption.
《Fig.4》
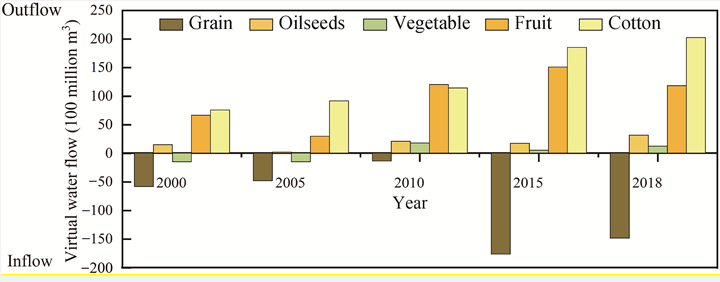
Fig.4. Evolution trend of virtual water flow of specific crops in TWL (2000–2018).
In 2018, grain virtual water inflow areas were concentrated in HH and QCXXN. The virtual water outflow areas of cotton were primarily concentrated at QCXXB, QCXXN, QCXDB, and QCXDB, whereas those of fruits were concentrated in QCXXB, QCXXN, QCXDB, QCXDN, and HH (Table 3). Because of the local water shortage, the excessive development and utilization of physical water posed a threat to the regional water security.
Table 3. Wflow of specific crops in TWL (2018).
| Area | Wflow (×108 m3) | Total | ||||
| Grain | Oilseeds | Vegetable | Fruit | Cotton | ||
| QCXXB | −2.6 | 19.2 | 9.4 | 22.7 | 104.1 | 152.9 |
| QCXXN | −36.0 | −8.5 | −1.4 | 38.1 | 85.1 | 77.2 |
| QCXDB | −9.1 | −1.0 | −0.4 | 10.7 | 3.7 | 3.9 |
| QCXDN | −7.2 | −0.8 | 4.7 | 8.3 | 22.2 | 27.2 |
| HX | 14.9 | 3.4 | 6.6 | −2.6 | 0.3 | 22.6 |
| CDM | −2.7 | 1.9 | −0.4 | −0.8 | −0.1 | −2.2 |
| BGH | 23.5 | 36.7 | −2.1 | −5.7 | −1.9 | 50.5 |
| HH | −128.8 | −18.8 | −3.8 | 47.9 | −10.8 | −114.4 |
| total | −148.1 | 32 | 12.7 | 118.6 | 202.6 | 217.8 |
《4.3 Pressure assessment of regional water resources》
4.3 Pressure assessment of regional water resources
The distribution of water resource pressure index in the TWL is shown in Fig. 5. As shown, the water resource pressure indexes of HH, BGH, QCXXB and HX exceed 1. Furthermore, the water footprint of crop production in these areas is larger than the amount of available water resources, whereas the regional water resources are overloaded. The agricultural production water consumption of CDM constituted the smallest proportion of the available water resources in the area. The water stress number is only 0.1, which is associated closely with the regional production structure.
《Fig.5》

Fig.5. Spatial distribution of multiyear average water resource pressure index in TWL (2000–2018).
An analysis of the production–consumption–trade pattern in the TWL from 2000 to 2018 shows that the proportion of local consumption decreased from 93.1% in 2000 to 86.4% in 2018. As the product transportation volume increased, the output of virtual water increased in the TWL (Fig. 6). This shows that the planting scale and output of crops in the TWL not only satisfied the consumption demands within the basin itself, but also satisfied the demands of other places through trade to achieve greater benefits. However, this regional economic development model based on agriculture resulted in a significant amount of virtual water consumption and output, which necessitates more physical irrigation water support. Consequently, the local agricultural water consumption increased continuously.
《Fig.6》

Fig.6. Evolution trend of virtual water production/consumption of crops in TWL (2000–2018).
The production–consumption–trade pattern of fruits and cotton in the TWL was further investigated based on the virtual water flow of crops. From 2000 to 2018, the virtual water output of fruits and cotton in the TWL constituted 21.5%–59.1% and 82.9%–91.6% of W, respectively (Fig. 7). Water resources was embedded in fruits and cotton and exported from economically underdeveloped regions in the Northwest to economically relatively developed regions in the east, and from water-deficient to water-rich areas. Consequently, the demand for water resources in the northwest intensified.
《Fig.7》
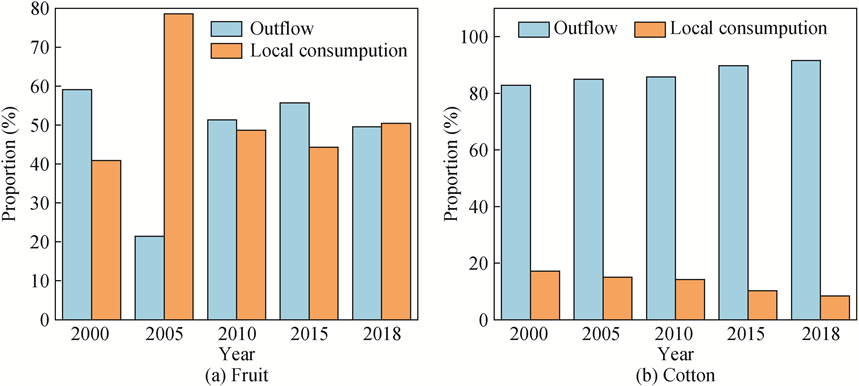
Fig.7. Proportion of virtual water output and local consumption of fruits and cotton in TWL (2000–2018).
《5 Conclusions and control strategies》
5 Conclusions and control strategies
《5.1 Conclusion》
5.1 Conclusion
The crop production water footprint in the TWL exhibited a fluctuating increasing trend from 2000 to 2018. Grain exhibited the largest water footprint in the production, followed by fruits and cotton. The temporal and spatial distributions of the water footprint of crop production in the TWL were uneven and different. The water footprint of crop production in HH was much larger than those in other regions.
The virtual water flow of crops in the TWL increased daily, i.e., from 8.55 × 10⁹ m3 in 2000 to 2.178 × 10¹⁰ m3 in 2018. The export of fruits and cotton rendered the TWL a virtual water outflow zone. HH was the main virtual water inflow area, whereas QCXXB was the main virtual water outflow area.
From 2000 to 2018, 21.5%–59.1 % and 82.9%–91.6% of the water footprints of fruit and cotton productions in the TWL were used for trade to achieve greater benefits. The local water resources system was severely overloaded and could not support the demands of regional social and economic development. In this context, external water transfer can be considered to alleviate the shortage of water resources in this area and improve water security.
《5.2 Control strategies》
5.2 Control strategies
Comprehensively considering the economic benefits and the amount of local water resources, optimizing the planting structure, adjusting the trade structure, and implementing physical–virtual water regulation measures are some measures that can be implemented to alleviate problems pertaining to the spatial dislocation of water and soil resources. Furthermore, the safety of water resources can be ensured through sustainable development.
5.2.1 Optimize crop planting structure and harness agricultural water saving potential
To ensure regional food security and maintain the self-sufficiency rate of rations, the relevant authorities in Northwest China can adjust the crop planting structure, reduce the area of crops with high water consumption, plan the crop planting space, and improve the fit of the planting layout. Additionally, they can actively develop development projects such as wind and solar power generation projects, as well as increase the intensity of new energy projects to provide indirect conditions for reducing the use of water resources and improving water security. Furthermore, they can strengthen clean agricultural production, promote the use of less pesticides and chemical fertilizers, reduce the discharge of agricultural gray water, and improve the recycling efficiency of agricultural water resources.
5.2.2 Adjust trade structure and promote coordinated development of virtual water economy and regions
As the key location for the New Eurasian Continental Bridge Economic Corridor and the China–Central Asia–West Asia Economic Corridor, Northwest China contributes significantly to the Belt and Road initiative and the new round of western development. The five Central Asian countries are agricultural countries that are typically associated with animal husbandry and planting (grain, oil, and cotton). Their technical expertise for cotton breeding and planting, cotton physiology and biochemistry, and irrigation systems expertise is high [16]. China offers advantages in terms of agricultural technology, management, and finance. Meanwhile, cantaloupe, grape, safflower, tomato, and other cash crops from Northwest China are well known worldwide. Therefore, we can exploit the agricultural complementarity and mutual benefit between China and Central Asia to solve the problem of water shortage in the TWL from the perspective of product trade. For example, to ensure the self-sufficiency of local food, the relevant authorities can increase the local food import accordingly, increase the import of water resource intensive products, and alleviate the contradiction of local water resource shortage. Moreover, they can strengthen technical cooperation with Central Asian countries, overcome the restrictions of water resources and planting technology to increase unit yields, and promote the application of various water-saving irrigation technologies to achieve improvements.
5.2.3 Implement regulation measures of physical–virtual water cycle to alleviate spatial dislocation of water and soil resources
Water resources are vital in ensuring the production of cotton and fruits in Northwest China, as well as the stability of the national textile, fruits, meat, eggs, and dairy industries. The TWL has exported a significant amount of virtual water in the form of cotton, fruits, vegetables, and oil. The indirect output of virtual water caused by the outward transfer of agricultural products has disrupted the local available water resources in Northwest China. If the problem of water source for crop planting cannot be solved, then the balance of arable land occupation and supplementation as well as the guarantee of food security will be difficult to realize through the development of land in the northwest region [17]. Currently, water for the water transfer project in Northwest China is sourced from the interior, and no external water source is transferred. From the perspective of maintaining regional water balance, the continuous outflow of virtual water further intensifies the problem of water resource in Northwest China. Without the replenishment of external water resource, regional economic development will be hindered and ecological crisis intensified.
Hence, the inadequacy experienced in Northwest China should be compensated in the form of physical water. Meanwhile, the relevant authorities should promote the construction of a large national water network, ensure the safety of agricultural production through water transfer across river basins, and realize the sustainable development of physical–virtual water balance in Northwest China.
《Compliance with ethics guidelines》
Compliance with ethics guidelines
The authors declare that they have no conflict of interest or financial conflicts to disclose.


 京公网安备 11010502051620号


