
《1. Introduction》
1. Introduction
The water cycle, consisting of a series of hydrological processes, including atmospheric moisture transportation, precipitation, evapotranspiration, infiltration, runoff generation, and runoff concentration, is an essential component of the climate system [1,2]. Movement of water through the liquid, solid, and vapor phases is the most active process in the ecosystem involving the biological, chemical, and physical exchange of water, energy, and carbon between the land surface and the atmosphere [3,4]. Because climate dynamics, human activities, and land use/land cover changes on multiple spatiotemporal scales influence the complex water cycle processes [3,5–7], understanding and quantifying the complex hydrological processes in a changing environment has become a major scientific endeavor [4,8,9].
Experiments on and observation of water cycle elements are the foundation to understanding various hydrological processes. However, a lack of reliable data is a longstanding challenge to quantitatively understanding the global water and energy exchange [10,11]. Many experiments have been conducted to understand the local, regional, and global water and energy cycles in recent decades, such as the Global Energy and Water Cycle Experiment in the 1990s [11,12] and the Coordinated Enhanced Observing Period launched in 2001 [13]. The United States Department of Agriculture established the well-known Walnut Gulch Experimental Watershed in 1953 to study soil erosion and land degradation problems. It gradually evolved into a comprehensive experimental watershed with multiple functionalities for understanding hydrology and ecosystems and interactions between water supply and water quality in a typical semi-arid region [14–17]. Hydrological experiments have played a critical role in discovering hydrological mechanisms, advancing the hydrology discipline, and developing and verifying new and existing theories and models [16,18–21]. The experimental studies of hillslope hydrology under different conditions worldwide [22–26] have boosted the development of hillslope hydrology and provided a basis for discovering important hydrological theories such as the runoff generation mechanisms under saturated storage and variable contributing area, assuming that only partial catchment areas with saturated storage contribute to runoff [27–30]. It further catalyzed the development of hydrological models, such as the Hydrologiska Byråns Vattenbalansavdelning model [31,32], topography based hydrological model [33], Xin’anjiang model [27], variable infiltration capacity model [34], hydrologic model system (HMS) [2,8], and gridtopography-based distributed hydrological model [35]. More recently, with the availability of new data and techniques, significant progress has been made on identifying and representing the spatial heterogeneity of runoff generation based on topographyand physics-based estimation of root zone storage [36–38] and topography and land cover/land use [39].
In recent years, China has launched several field camps and regional observation programs in its northwestern semi-arid and arid regions and the Tibetan Plateau, including the Heihe Watershed Allied Telemetry Experimental Research, launched in 2012 to improve the observability of hydrological and ecological processes in the Heihe Watershed of northwestern China [40], multiscale soil moisture and freeze–thaw monitoring network in the Tibetan Plateau established in 2012 [41], and third atmospheric scientific experiment over the Tibetan Plateau to build integrated monitoring systems for the land surface, boundary layer, troposphere, and lower stratosphere [42]. These studies have provided valuable first-hand ground truths to validate model simulations and assess climate change impacts. Ground and satellite observations show that climate change has intensified the water cycle and altered the spatiotemporal distribution of water over large regions [9,43–45]. Because detailed information on fine-scale and multiscale hydrological processes is limited, further studies on the first-order hydrological processes and diurnal–seasonal-inter annual variations of various hydrological processes and mechanisms controlling the water cycle in the changing environment on fine and multiple scales [46,47] are required for more accurate future projections.
Hydrological data are the basis for an accurate understanding of the water cycle. Hydrological variables, such as rainfall, evaporation, soil water content, groundwater level, and streamflow, are obtained through remote sensing technology and in situ observations. Although remote sensing techniques can provide spatially continuous in situ observations of hydrological variables, they cannot provide temporally continuous coverage and capture fine-scale key processes [10,48]. Furthermore, remote sensing relies on in situ observations for calibration and performance evaluation [10,48]. However, scaling is hampered by the combined remote sensing and in situ observation data [49–51]. Addressing these challenges requires developing holistic, multiscale observations for more accurate quantification [52].
Humid regions, mainly located in eastern and southeastern China, account for approximately 32% of the total area. Topography in eastern China varies greatly in space and creates large landscape heterogeneity. The Xin’anjiang model [53] was developed based on the saturation–excess runoff generation mechanism inferred from the observed hydrological data in the Xin’anjiang Watershed in the eastern China humid zone. The Xin’anjiang Watershed has frequent high-intensity rainfall and rapid response to hydrological processes, which can easily lead to flash floods. Flooding due to extremely intense rainfall is among the most severe natural disasters in eastern China [54]. Some studies have shown that eastern China has experienced an increasing trend in extreme rainfall [55–57]. According to a recent Intergovernmental Panel on Climate Change (IPCC) report 2020, eastern China is projected to suffer large climate changes and experience intense climate change-induced hydrometeorological extremes. Understanding the hydrological processes at different scales and their responses to meteorological forcing is the key to preventing flood hazards and relieving their impacts in the region [2,8]. Accurate observation in the Xin’anjiang Watershed is critical to understanding the hydrological processes, flood formation mechanisms, and water cycle under the changing environment in eastern China humid zones and other similar regions.
In this study, we present the background, scientific objectives, experimental design, and preliminary achievements of the Xin’anjiang nested experimental watershed (XAJ-NEW), established in 2017, to understand the multiscale hydrological processes in China’s typical subtropical humid monsoon region.
《2. Scientific objectives》
2. Scientific objectives
The scientific objectives of the XAJ-NEW were to build a comprehensive, multiscale, and nested hydrometeorological monitoring and experimental system to strengthen the observation of the water cycle in a typical humid, hilly area of eastern China, discover the spatiotemporal scaling effects of hydrological processes through the observations of the multiscale nested watersheds, and reveal the mechanisms controlling runoff generation and partitioning and the interaction and feedback among various processes. XAJ-NEW observes key hydrometeorological variables, including rainfall, soil moisture, groundwater depth, interception, and runoff components. The observation instruments and facilities were constructed per the relevant standards and gradually implemented since August 2017.
Network observations provide key hydrometeorological variables and processes at a fine temporal scale and across multiple spatial scales in a spatially nested fashion to accurately measure hydrological processes and their spatial heterogeneities. Because hydrological processes are influenced by complex topography and meteorological conditions, observations of hydrological variables should be enhanced at both spatial and temporal scales. For example, rainfall stations are densely distributed in typical watersheds. In addition, the observations of these variables range from minutes to hours in the XAJ-NEW.
The experiments observe key hydrological processes and meteorological variables to better understand the important ecohydrological processes and underlying mechanisms. For example, the observations at the XAJ-NEW quantifies the canopy interception and runoff partitioning process through the rainfall gauging array and runoff component observing system, respectively. These important processes in hydrology are often simulated using empirical methods. The canopy rainfall interception instrument quantitatively observes the interception ratio under different rainfall intensities and canopy conditions and provides the ground truth to develop more accurate equations to simulate interception. In the Xin’anjiang model, runoff separation includes three components: surface, interflow, and subsurface runoffs [53,58–60]. The runoff component observation system directly measures the surface runoff and interflow under different soil depths, further improving our knowledge of the natural runoff partitioning process. Moreover, the root zone is the most active soil layer for the transfer and partitioning of water and energy and plays a key link between the water cycle and vegetation dynamics [61]. An array soil moisture gauging network, implemented in the XAJ-NEW, observes soil moisture from the topsoil to 60 cm below the ground. Groundwater monitoring platforms were also installed in the XAJNEW to monitor the groundwater dynamics and aeration zone. In addition, the flux tower in the XAJ-NEW observes the meteorological variables at different heights and capture the exchange of water vapor, CO2, and energy between the terrestrial ecosystem and atmosphere. These observations aid the development of accurate ecohydrological processes and improve the hydrological and land surface models.
《3. Experimental area and network design》
3. Experimental area and network design
《3.1. Study area》
3.1. Study area
3.1.1. Tunxi Watershed
The XAJ-NEW was implemented across the entire Tunxi Watershed (Fig. 1(a)). Tunxi Watershed is the headstream of the Xin’anjiang Watershed and is located in Huangshan, Anhui Province (Fig. 1(a)), China. The region has a humid climate and a drainage area of 2674 km2 [62–64]. The average annual rainfall and temperature were approximately 1800 mm·a–1 and 17 °C, respectively. In the XAJ-NEW, the Tunxi Watershed was divided into five-tier nested watersheds (Fig. 1) as follows: the 5th-tier Tunxi Watershed (Fig. 1(a)), 4th-tier Yuetan Watershed (Fig. 1(a)), 3rd-tier Zhonghecun Watershed (Fig. 1(a)), two 2nd-tier watersheds (2nd-tier Watershed I and 2nd-tier Watershed II) located within the Zhonghecun Watershed (Fig. 1(b)), and two 1st-tier watersheds (1st-tier Watershed I and 1st-tier Watershed II) located within the 2nd-tier Watershed II (Figs. 1(c) and (d)). Vegetation in this region is dominated by evergreen broadleaf forest, evergreen needleleaf trees, and bamboo.
《Fig. 1》

Fig. 1. Location and configuration of the XAJ-NEW: (a) geographical locations of the five-tier nested watersheds and spatial distributions of gauging stations, (b) locations of the two 2nd-tier watersheds and distributions of their gauging stations, (c) topography of 1st-tier Watershed I within the 2nd-tier Watershed II, and (d) topography of 1st-tier Watershed II within the 2nd-tier Watershed II. DEM: digital elevation model.
3.1.2. 2nd-and 1st-tier watersheds
The two typical 2nd-tier watersheds, located in the Mukeng village, Huangshan, are part of the Zhonghecun Watershed (Fig. 1(b)). Named the Xin’anjiang Monitoring and Experimental Field Center (hereinafter referred to as typical catchments), they are adjacent with a drainage area of 0.35 km2 (2nd-tier Watershed I on the left) and 0.23 km2 (2nd-tier Watershed II on the right), respectively. The mean slope of the 2nd-tier watersheds is approximately 30°. The soil in this region is mainly sandy and clayey, and soil depth varies between 5–8 m. The two watersheds represent the topography, geomorphology, geology, and meteorology across the Tunxi Watershed. The two 1st-tier watersheds are heavily and intensely gauged to observe the hydrometeorological states to study the canopy interception, surface runoff, interflow, soil water content, and evapotranspiration.
《3.2. Network configuration》
3.2. Network configuration
The design of the XAJ-NEW is based on the idea of building a comprehensive, multiscale, and nested hydrometeorological monitoring and experimental system. It comprises five tiers of nested watersheds with areas ranging from 0.003 to 2674 km2 (Fig. 1). Tunxi Watershed is the ultimate outlet of the XAJ-NEW (Fig. 1). The implementation of the XAJ-NEW takes advantage of existing gauging systems, including hydrological stations and rain gauges implemented by the Hydrological Bureau of Anhui Province. The layout and location selections of all hydrological gauges follow the Technical Regulations for Hydrologic Network Design (SL 34–2013) [65] issued by the Ministry of Water Resources, the People’s Republic of China. The densities and spatial distributions of all gauges meet the Technical Regulations for Hydrologic Network Design (SL 34-2013) [65] requirements.
Ground observations were conducted across the Tunxi Watershed with intense measurements within two representative 2ndtier watersheds. There are three major types of general gauging stations across the Tunxi Watershed: rainfall gauging stations, comprehensive gauging stations that measure rainfall, soil moisture, and groundwater, and hydrological stations that measure streamflow and evaporation (Table 1). A network of nested hydrological stations serves as the fundamental gauging system for measuring streamflow and exploring the runoff concentration and propagation on multiple spatial scales. Within the 2nd-tier watersheds (Fig. 1(b)), more instruments are deployed, including integrated rainfall and soil moisture measurement systems, groundwater level monitoring platforms, flow weirs, array soil moisture gauging networks, rainfall gauging array, runoff component gauging systems, evaporation pan, meteorological station, lysimeter, and flux tower (Table 2 and Fig. 2). The rainfall and groundwater stations were roughly evenly distributed across the Tunxi Watershed and typical catchments. Soil moisture involving three spatial scales (Tunxi Watershed and 1st-tier and 2nd-tier watersheds) was also recorded. Three river discharge gauges are implemented in the Zhonghecun Watershed, Yuetan Watershed, and Tunxi Watershed. In addition, several critical hydrological processes are observed within the typical catchments. The array rainfall station was instrumental in observing canopy rainfall interception. The runoff component gauging system observes the runoff components.
《Table 1》
Table 1 Types and features of generic gauging stations implemented across the XAJ-NEW.

《Table 2》
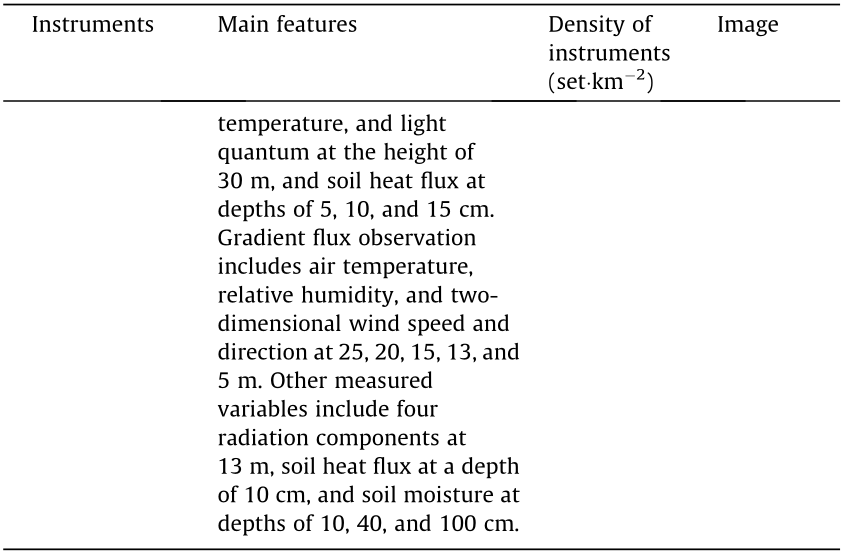
Table 2 Types and features of instruments installed across the 2nd-tier watersheds within the XAJ-NEW.


《Fig. 2》

Fig. 2. Images of the instruments installed across the 2nd-tier watersheds: (a) integrated rainfall and soil moisture station, (b) groundwater level station, (c) flow weir, (d) array soil moisture gauging network, (e) rainfall gauging array, (f) runoff component gauging system, (g) evaporation pan, (h) meteorological station, (i) lysimeter, and (j) flux tower.
In summary, the instrument can observe hydrological processes, such as rainfall, soil water content, groundwater level, canopy interception, surface runoff, and interflow. The meteorological station and flux tower within the typical catchments also provide observations for meteorology, momentum, energy fluxes, and CO2 fluxes. Observations in the XAJ-NEW, especially within the typical catchments, cover almost all important hydrological processes and key meteorological variables, providing a solid foundation for studying the hydrometeorological processes in this region, and mechanisms controlling these processes, and developing numerical methods to simulate these processes accurately. The data are automatically stored and transmitted through the wireless network. The reliability of the data was guaranteed through strict quality control software and manual post-processing and quality control. Moreover, the data and observation equipment are routinely checked and maintained.
《3.3. Data analysis methods》
3.3. Data analysis methods
3.3.1. Spatial interpolation
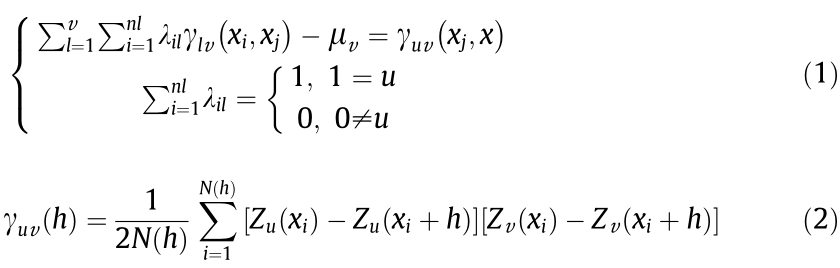
Based on the characteristics of hydrological variables, appropriate spatial interpolation methods are used to obtain the spatial distributions of hydrological variables from site-level observations. The CoKriging interpolation method was used to estimate the groundwater depth considering the relatively low station density and impact of terrain on the observed groundwater depth as follows [66,67]:
where i and j are the origin and extremity number of the vector, n is the number of primary variables,  is the number of covariate variables, u and
  are the primary (groundwater depth) and covariate (elevation) variables, respectively,
  is the weight associated with the data,
  is the value of the variogram,
  indicates the magnitude of the variable, and
  is the total number of pairs of attributes that are separated by a distance h. Additionally, we applied the inverse distance weighting method to obtain the precipitation distribution in space.
3.3.2. Analysis of the spatial scaling effect of rainfall
The product moments (PM) method was used to assess the spatial scaling effect [68,69]. If a hydrological variable on one spatial scale can be transformed to another scale of equivalent distribution, it is considered scalable. Simple and multiscaling approaches are the two most common methods used to evaluate the scaling effects of hydrological variables [70,71]. If a hydrological process/- variable (Xi) at watershed i follows simple scaling, its moments and drainage area meet the following relationships:
where  is the moment of order k for Xi, Ai is the drainage area,
  is the moment of order k for Xj of the reference watershed, bk is the fitted slope, and β is the scaling factor, which is a constant. The multiscaling approach is followed if the scaling factor is variable. Based on the observed rainfall data on multiple spatial scales, we evaluated the scaling effect of rainfall and assessed whether it met simple scaling.
3.3.3. Analysis of observed key water cycle components
We calculated the inter-site spatial correlation coefficients (R) of the soil water content at the four depths to investigate its spatial variability. The box–whisker plot, or box plot, represents the distribution of these correlation coefficients.
For canopy interception, we analyzed the statistical relationship between the canopy rainfall interception ratios (CRIR) measured by the array rainfall stations and the corresponding canopy leaf area index (LAI) measured using the LAI-2000 Plant Canopy Analyzer (Li-Cor, Inc., USA). Finally, we analyzed the observed runoff components at the 1st-tier Watershed I and compared the discharge processes across the XAJ-NEW on multiple spatial scales.
《4. Preliminary results》
4. Preliminary results
《4.1. Spatial scaling effect of rainfall》
4.1. Spatial scaling effect of rainfall
It is well known that rainfall exhibits great variability in space [72]. In this study, 30 rainfall stations, evenly distributed across the Tunxi Watershed (with a drainage area of 2674 km2 ), were selected to identify the spatial scaling effects of rainfall. Correspondingly, 11 and 2 of the 30 rainfall stations are located within the Yuetan (drainage area of 854 km2 ) and Zhonghecun watersheds (drainage area of 140 km2 ), respectively. The PM method was used to examine the scaling effect of rainfall. The coefficient of variation ( ) was used to evaluate the spatial variability of rainfall.
《Fig. 3》

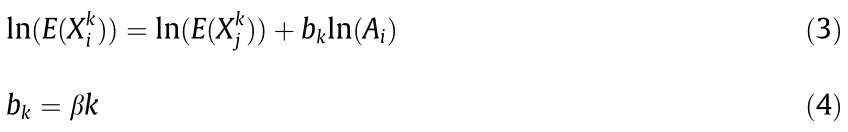
Fig. 3. Relationships (a) between the logarithm of mean value of coefficient of variation of the rainfall ln(E()) and the logarithm of the watershed area (ln(A)), and (b) between the fitted slope bk and the moment of order k.
First, the linear relationship between ln(E()) and ln(A) indicate that the drainage area reflects the main characteristics of the spatial variability of rainfall (Fig. 3(a)). Second, the fitted slope bk (i.e., the slope of theln(E( )) ~ ln(A) curve) is a linear function of k with the intercept close to zero (Fig. 3(b)), showing that the scaling factor of is a constant (0.4258). The above results indicate of rainfall across the Tunxi Watershed follows simple scaling and increases as the drainage area increases, leading to larger spatial heterogeneity.
《4.2. Rainfall and soil water content》
4.2. Rainfall and soil water content
The soil water content and rainfall were analyzed at two spatial scales: the Tunxi Watershed and typical catchments. The spatialaveraged soil water content of the Tunxi Watershed has a similar seasonality to that of the typical catchments (Fig. 4). The seasonal variations in the observed 5-min spatial-averaged soil water content in 2018 are shown in Figs. 4(a) and (b). The soil moisture of the top layer (10 cm) shows large variability and fluctuations between March and September for both the Tunxi Watershed and typical catchments (Fig. 4). The regional average soil water content shows an apparent vertical gradient, with soil moisture increasing with soil depth (Fig. 4), demonstrating the buffering effects of the soil column on the soil moisture. To investigate the spatial variability of soil water content, we also calculated the inter-site spatial correlation coefficients of the soil water content at depths of 10, 30, 40, and 60 cm (Figs. 4(c) and (d)). The mean inter-site correlation coefficient of the first layer (10 cm) is relatively high for the Tunxi Watershed, and typical catchments at 0.7758 and 0.8839, respectively, and decreases as soil depth increases, with the lowest values at the 60 cm layer (0.4882 and 0.7231) (Figs. 4(c) and (d)). Therefore, soil moisture has a higher spatial correlation on the surface and a lower spatial correlation underground. The mean inter-site correlation coefficient of the Tunxi Watershed at different depths ranges from 0.4882 to 0.7758 (Fig. 4(c)), while those of the typical catchments are above 0.7231 (Fig. 4(d)). These results demonstrate the distancedependent correlation of soil moisture.
《Fig. 4》
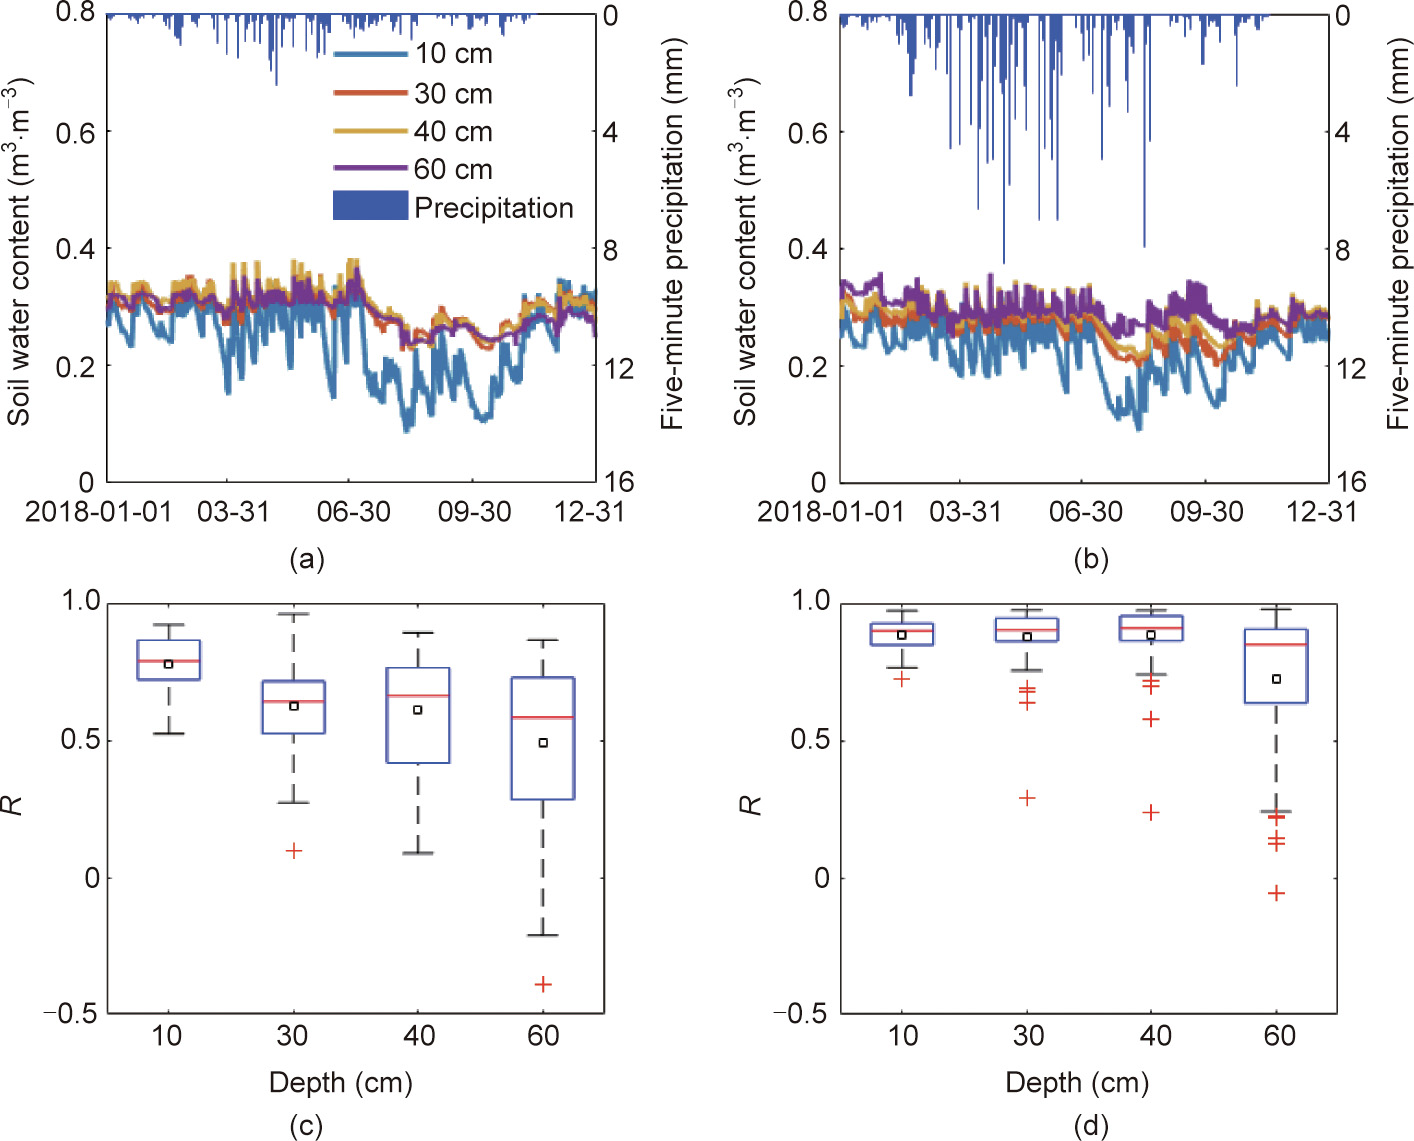
Fig. 4. Five-minute time series of site-averaged volumetric soil water content at four soil layers and rainfall in 2018 for (a) the 5th-tier Tunxi Watershed and (b) the 2nd-tier Watersheds I and II, and boxplots of inter-site correlation coefficients (R) at the four soil depths for (c) the 5th-tier Watershed Tunxi and (d) the 2nd-tier Watersheds I and II.
《4.3. Groundwater depth》
4.3. Groundwater depth
Groundwater depth was observed at the Tunxi Watershed and typical catchments. The temporal variations in the groundwater depth anomalies in 2018 are shown in Fig. 5. The groundwater level rises significantly from April to June and declines after July (Figs. 5(a) and (b)). The groundwater depth across the Tunxi Watershed ranges between –1.35 and 4.97 m relative to the 2018 yearly average (Fig. 5(a)), whereas the typical catchments have a much lower fluctuation, varying between –0.89 and 2.49 m (Fig. 5(b)). Tunxi Watershed has a larger elevation range and a much larger drainage area (1523 m and 2674 km2 , respectively) than the 2nd-tier typical watersheds (318 m and 0.58 km2 , respectively), contributing to the large spatial variability. In addition, the spatiotemporal distributions of precipitation, soil properties, and other geographical factors may also impact the variability of the groundwater level. We applied the CoKriging interpolation method [66] to estimate the spatial distribution of groundwater depth based on station observations. For the Tunxi Watershed, yearly average groundwater depth ranges from –7.64 to –0.07 m, with shallower water tables near the drainage network and downstream areas (Fig. 5(c)). Groundwater depths across the typical catchments have a much lower spatial variability (Fig. 5 (d)) than the Tunxi Watershed because of the small area (only 0.58 km2 ). In addition, the groundwater depths near the outlets and streams are lower (Fig. 5(d)). The ground surface elevation for the Tunxi Watershed and typical catchments is 96–1619 and 188–506 m, respectively. We conclude that topography variability and scale play an important role in controlling the spatial variability of groundwater depth across the Tunxi Watershed.
《Fig. 5》

Fig. 5. Five-minute time series of site-wise (colored lines) and site-averaged (black lines) groundwater depth anomalies in 2018 for (a) the 5th-tier Tunxi Watershed and (b) the 2nd-tier Watersheds I and II, and spatial distributions of the 2018 yearly average groundwater depth across (c) the 5th-tier Tunxi Watershed and (d) the 2nd-tier Watersheds I and II interpolated by the CoKriging method; positive anomalies means shallow depth.
《4.4. Canopy rainfall interception》
4.4. Canopy rainfall interception
Using the LAI-2000 Plant Canopy Analyzer, the canopy LAI over each rain bucket was measured on March 16, 2019. The LAI values over the nine rain buckets were 1.560, 1.150, 1.210, 0.388, 0.054, 0.000, 0.620, 0.010, and 0.301. Accordingly, we divided the samples into three categories: LAI ≥ 0.5, LAI < 0.5, and all LAI values. Rainfall above the canopy was selected as a reference to evaluate the interception function of the canopy. Twenty-nine rainfall events were used to analyze the relationship between CRIR and accumulated rainfall and LAI. CRIR decreases as the LAI decreases (Fig. 6). In addition, there is a logarithmic relationship between the interception ratio and accumulated rainfall (Fig. 6), consistent with the findings of Yu et al. [73]. As the accumulated rainfall increases, the CRIR decreases rapidly and gradually levels off (Fig. 6). In addition, LAI has a large impact on CRIR. Canopy with LAI ≥ 0.5 can intercept 20% of a rainfall totaling 51 mm, while canopy with LAI < 0.5 can only intercept 20% of a rainfall totaling 9 mm (Fig. 6). The relationship between CRIR, accumulated rainfall, and LAI can be used to estimate the canopy interception required in hydrological and ecological models [74,75].
《Fig. 6》
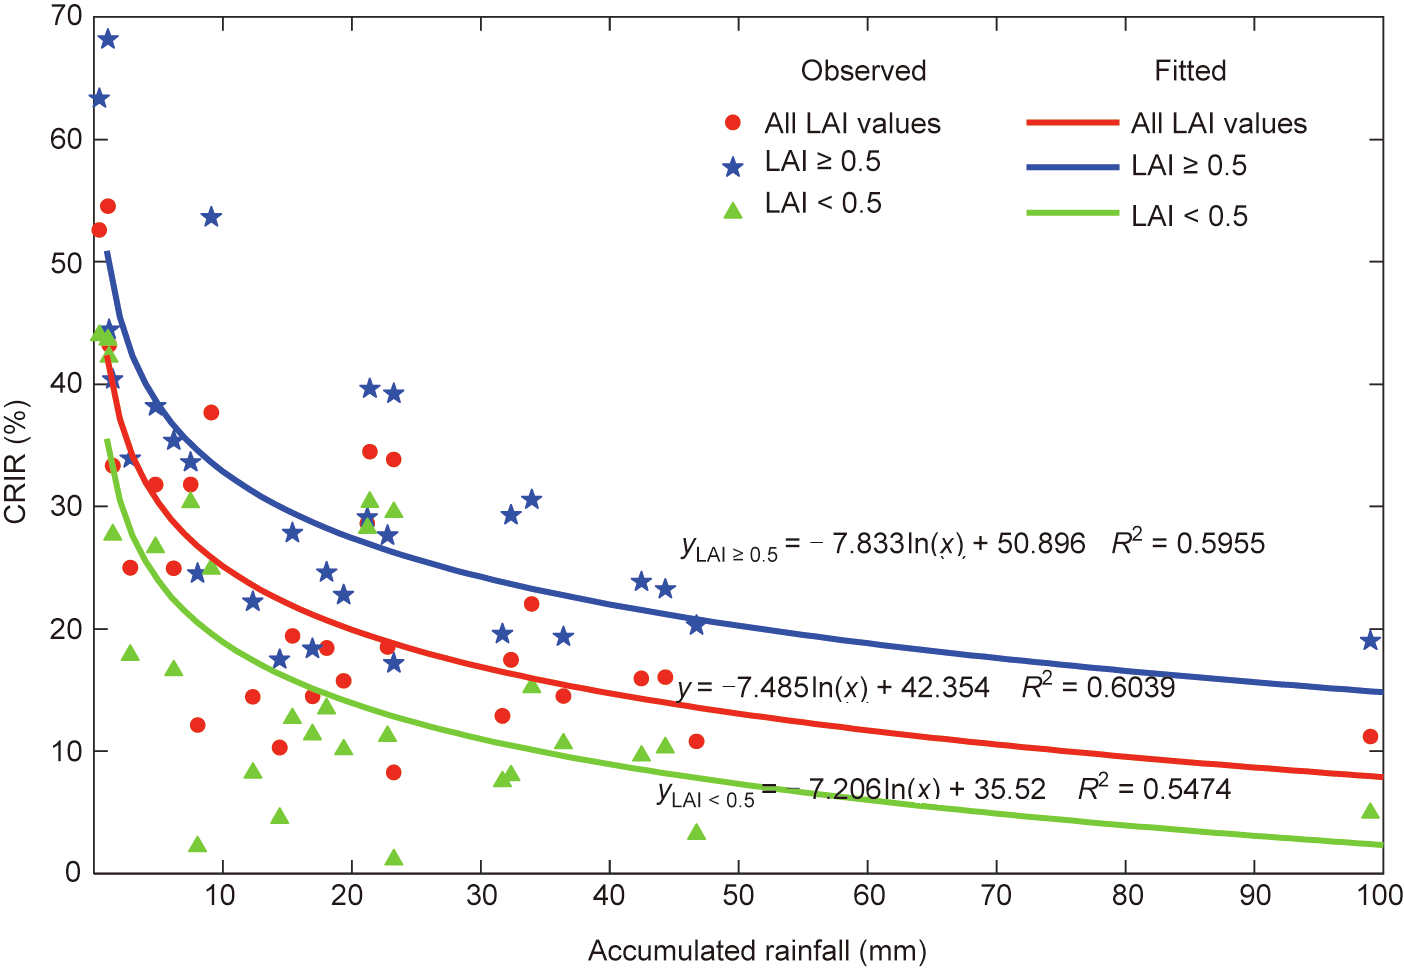
Fig. 6. Relationships between event-level canopy rainfall interception ratios (CRIR) and accumulated rainfall under different canopy densities (LAI). Point-level samples are grouped by their corresponding LAI categories (i.e., LAI < 0.5, LAI ≥ 0.5, and all LAI values) and averaged to produce the data points.
《4.5. Separation of runoff components》
4.5. Separation of runoff components
The gauging system can observe the surface runoff and interflow between 0–1, 1–2, and 2–3 m below ground in the XAJNEW. We chose a typical rainfall–runoff event of the 1st-tier Watershed I to analyze the surface runoff and interflow processes in 2018 (Fig. 7). Before this rainfall event (#2018042302), the typical catchments did not receive rainfall for several days, making the soil relatively dry and the mean soil water content at the 10 cm layer was 0.2 m3 ·m–3 . Rainfall started at 2:10 AM on April 23, 2018. During the first 12 h, the rainwater infiltrated into the soil to fill the soil water deficit, and no runoff was generated (Fig. 7). As rainfall continued, runoffs start to yield and reach the peaks around 15:35 with surface runoff depth of 0.43 mm per 5 min and level 3 interflow depth (2–3 m) of 0.09 mm per 5 min around 15:55 (Fig. 7). For this event, the accumulated rainfall is 126.30 mm, while runoff depths for the surface, 0–1, 1–2, and 2– 3 m layers, are 16.3 mm (12.9%), 2.24 mm (1.78%), 1.96 mm (1.55%), and 8.28 mm (6.55%), respectively. The 0–1 and 1–2 m layers yielded little interflow, suggesting that rainfall intensity may surpass the infiltration capacity during the peak period [76], and gravity plays an important role in interflow partitioning. In addition, surface runoff during this event shows a rapid rise and fast recession, while the interflow runoff in the 2–3 m layer is slower and flatter, indicating the regulation of the soil column on the hydrological processes.
《Fig. 7》
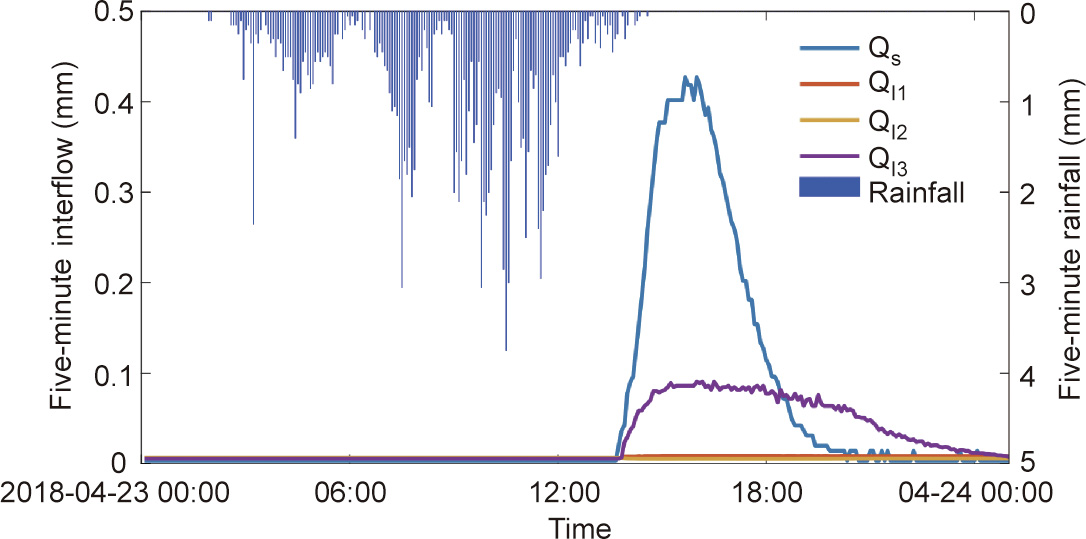
Fig. 7. Five-minute time series of observed four runoff components, namely, surface runoff (Qs), and interflows of level 1 (0–1 m) (QI1), level 2 (1–2 m) (QI2), and level 3 (2– 3 m) (QI3) at the outlet of the 1st-Tier Watershed I during the typical rainstorm event #2018042302.
《4.6. Multiscale discharge》
4.6. Multiscale discharge
The discharge gauges were installed at the outlets of the Zhonghecun, Yuetan, and Tunxi Watersheds. As shown in Fig. 8, the hydrographs at the three discharge gauges show steep rising and falling limbs but with different durations. Tunxi has the longest flood, lasting (175.00 ± 73.61) h, followed by Yuetan ((160.33 ± 62.63) h) and Zhonghecun ((131.00 ± 36.89) h), indicating the influence of the size and water storage capacity of the watershed on flooding. Flood events #2019051220 and #2019052508 have narrow, steep, and single-peaked hydrographs at all three stations (Fig. 8). However, for flood event #2019061615, the hydrograph of Tunxi station has a double-peaked hydrograph corresponding to the double-peaked hyetograph, whereas the hydrographs of the Yuetan and Zhonghecun stations have a single-peak (Fig. 8). Because the Tunxi station is the outlet of the entire Tunxi Watershed and has a larger contributing area, more complex geographical characteristics and spatial variability of rainfall can produce a more complex hydrograph. Moreover, as a part of the Yuetan Watershed, the Zhonghecun station tends to reach flood peaks earlier than the Yuetan station (Fig. 8). However, the flood peak time at the Tunxi station is slightly shorter than that at the Yuetan station (Fig. 8). Furthermore, we produced a map of accumulated rainfall for each flood event using the inverse distance weighting method (Fig. 9). The first two events (#2019051220 and #2019052508) have relatively even rainfall across the region than the third event (#2019061615). The uneven temporal and spatial distributions of rainfall (Fig. 8 and Fig. 9(c)) can explain the doublepeaked hydrograph at Tunxi and the earlier flood peak occurrence at Yuetan than at Tunxi.
《Fig. 8》
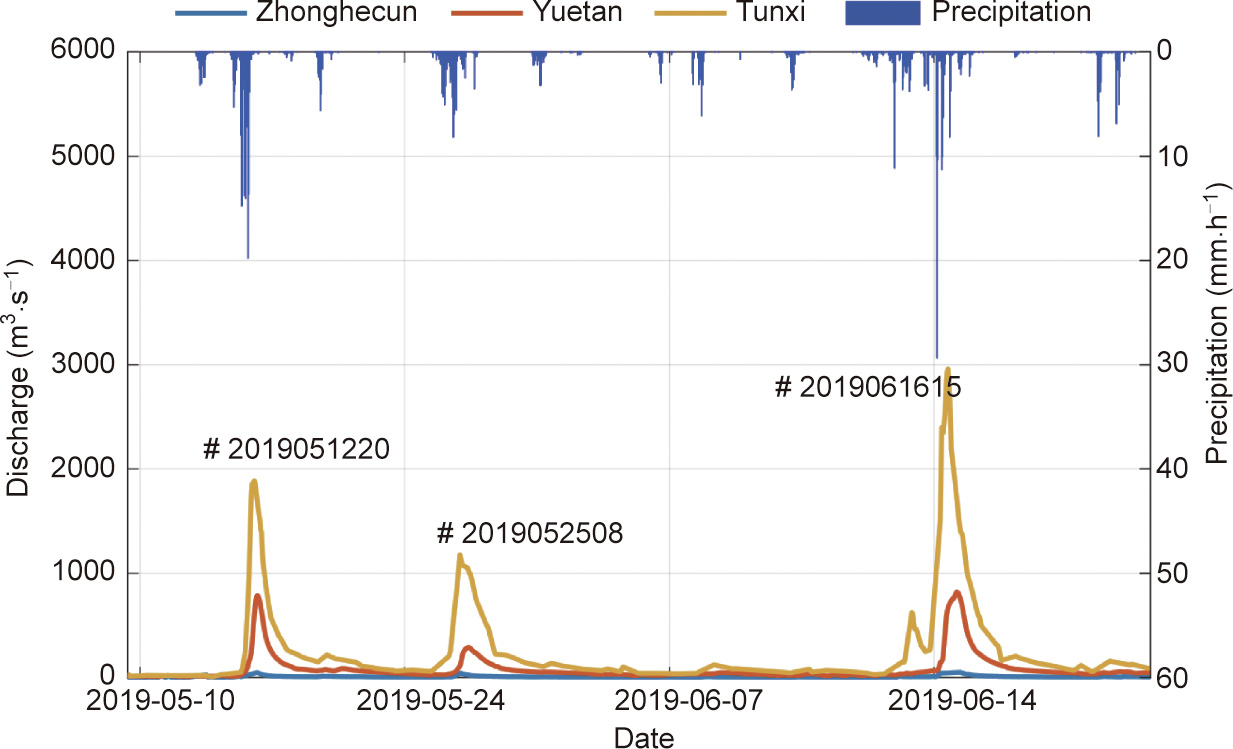
Fig. 8. Hourly time series of observed streamflow during the flood season of 2019 at the outlets of the 3rd-tier Zhonghecun Watershed, 4th-tier Yuetan Watershed, and 5thtier Tunxi Watershed; there are three flood events (#2019051220, #2019052508, and #2019061615) during this period.
《Fig. 9》
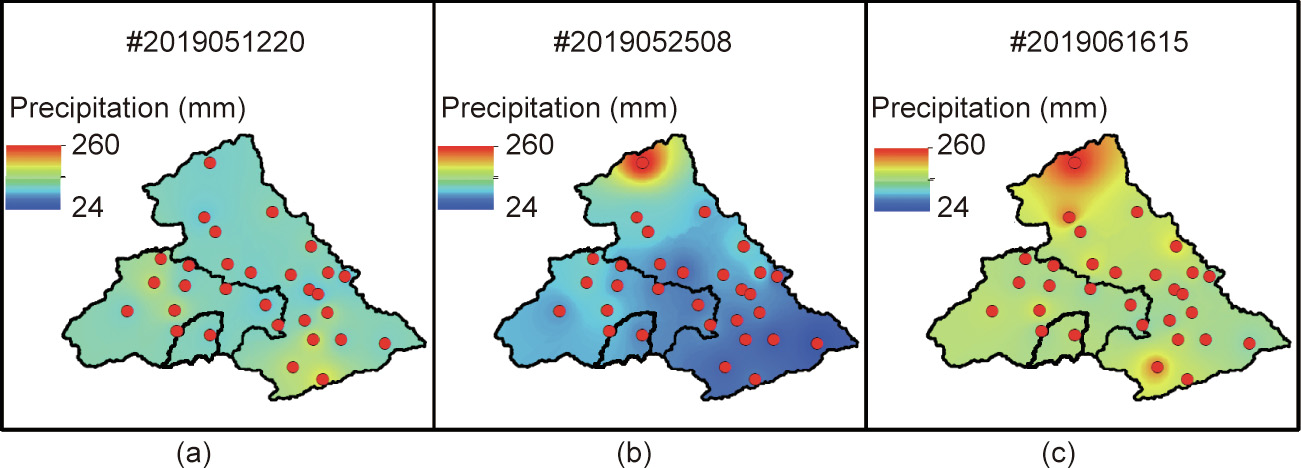
Fig. 9. Spatial distributions of observation-based accumulated rainfall during the three flood events in 2019: (a) Event #2019051220, (b) Event #2019052508, and (c) Event #2019061615.
《5. Summary》
5. Summary
A spatially nested experimental watershed named XAJ-NEW was successfully built in the Xin’anjiang Watershed, making it the very first of its kind in the eastern China humid zone. Aimed at understanding the multiscale water cycle, this unique and comprehensive system can aid in observing a set of key hydrological elements and meteorological states. The system is designed for long-term operation and can provide more data in the future. The comprehensive experiment can quantify critical hydrological processes and reveal the underlying mechanisms controlling the hydrological and other relevant processes in the typical Chinese humid, hilly region. The existence and continuous operation of the XAJ-NEW system will be valuable to support systematic studies on the mechanisms of runoff generation and concentration, especially in the context of changing environments, and promote the development and improvement of hydrological, ecological, and land surface models. Further development of the XAJ-NEW system should focus on enhancing soil moisture observation across the whole root zone and implementing additional flux towers across this region to better monitor carbon and energy processes.
《Acknowledgments》
Acknowledgments
This work was supported by the National Natural Science Foundation of China (51879067), the National Key Research and Development Program of China (2016YFC0402701), the Fundamental Research Funds for the Central Universities of China (B200204038), the Natural Science Foundation of Jiangsu Province (BK20180022), and Six Talent Peaks Project in Jiangsu Province (NY-004). The observation data used in this study are available from http://hydro-lab.hhu.edu.cn.
《Compliance with ethics guidelines》
Compliance with ethics guidelines
Ke Zhang, Yunping Li, Zhongbo Yu, Tao Yang, Junzeng Xu, Lijun Chao, Jin Ni, Liutong Wang, Yun Gao, Yuzhong Hu, and Zuoding Lin declare that they have no conflict of interest or financial conflicts to disclose.


 京公网安备 11010502051620号


