

《1. Introduction》
1. Introduction
Membrane technologies have been widely applied in environmental remediation and energy harvesting [1–3]. Specifically, ion exchange membranes (IEMs) are crucial in various fields, such as electrodialysis (ED) [4,5], reverse electrodialysis (RED) [6,7], proton exchange membrane fuel cells [8,9] and redox flow batteries [10–13]. However, ordinary IEMs with low perm-selectivity cannot meet the requirements of various specific fields, such as vanadium redox flow batteries (VRFBs) [14], NaCl production and Li+ extraction [15]. Furthermore, monovalent cation exchange membranes (M-CEMs) with high perm-selectivity of Na+ /Mg2+ or Na+ /Ca2+ have been utilized to generate NaCl from seawater or brine in Japan [16,17]. Considering the global demand of Li, extraction of Li+ is not only attractive but also extremely challenging because of their high ratio of competing ions. Some commercial M-CEMs have been employed to reduce the Mg/Li ratio in seawater or salt-lake brines [18], and M-CEMs with higher permselectivity might be promising candidates for extraction of Li+ during ED.
The size exclusion and Donnan effects are the two main ion separation mechanisms of M-CEMs, and surface modification is frequently applied to construct selective layers with smaller pore sizes and/or opposite charges [19–25]. Polyelectrolytes have comprehensive applications in various fields [26–30]. Specifically, polyelectrolyte multilayer membranes fabricated via layer-bylayer assembly have selective layers with opposite charges and a small pore size distribution [31–36]. However, the higher permselectivity of these membranes requires more deposition times, which increases the area resistance and decreases the stability of the membrane. In addition, a porous structure and a thin selective layer in porous cation exchange membranes (CEMs) reduce the mass transfer resistance and enhance the limiting current density. However, the low content of cation exchange groups in the porous substrate and a thin selective layer cannot completely suppress the migration of anions; thus, the total cation fluxes and the current efficiency of cations are reduced. Constructing an oppositecharged selective layer on the surface of the membrane is suitable, and such membranes can be regarded as Janus-charged M-CEMs owing to the charge difference between the two layers [37]. Conductive polymers with high cost, such as polyaniline and polypyrrole, are limited [38,39], although polyethylenimine (PEI) with highly branched poly-amino groups is a promising candidate for improving perm-selectivity [40]. The stability of PEI selective layer could be enhanced by co-deposition [41] or crosslinking reactions [42]; therefore, a stable PEI selective layer should be studied to enhance the perm-selectivity of M-CEMs.
Recently, selectrodialysis (SED) following the principle of conservation of total charge, has been applied in various fields, such as phosphate recovery [43–45] and Mg2+ enrichment [19,46]. A delicate combination of SED and bipolar membrane ED can obtain a base with target purity and an acid with high purity [47,48]. Because of the principle of conservation of total charge in the product chamber (PC), cationic SED with two anion exchange membranes (AEMs), a CEM, and an M-CEM is an ideal ED stack for enriching multivalent cations. Notably, the principle of conservation of total charge will not be applicable to SED once the MCEMs can permeate anions; hence, SED might be an effective ED stack for evaluating the performance of M-CEMs and a novel application for M-CEMs.
Herein, the Janus-charged M-CEM was fabricated by synthesizing a positively charged trimesic acid (TMA)/polyethylenimine (PEI) surface thin layer on the CEM surface. The effect of different fabrication conditions such as TMA concentration, PEI concentration, and post-treatment temperature on the performance of the membrane was systematically investigated. Various characterizations were performed to analyze the properties of the Janus-charged M-CEMs. Furthermore, the optimal Janus-charged M-CEM, thin film composite membrane (TFCM), and pristine CEM were further utilized in SED to determine the cause for the low total cation fluxes in TFCM. Because of the dense and negatively charged substrate in the Janus-charged M-CEMs, cations could carry more current, which ensured higher total cation fluxes. Moreover, our optimal membrane demonstrated long-term stability and excellent separation performance beyond the contemporary ‘‘Upper Bound” plot between Na+ flux and perm-selectivity.
《2. Materials and methods》
2. Materials and methods
《2.1. Materials》
2.1. Materials
CEM (sulfonated polypropylene) and AEM (aminated polypropylene) were acquired from Shandong Tianwei Membrane Technology Co., Ltd. (China). MgCl2 anhydrous (analytical reagent (AR), > 98%), NaCl (AR, 99%), KCl (AR, 99%), TMA (AR, 98%), Na2SO4 (AR, 99%), MgSO4 (AR, 99%), sodium dodecyl sulfate (SDS; AR, 98%), PEI (molecular weight (Mw) = 70 000, 50% solution), TMA (AR, 99%), piperazine (PIP; AR, 99%), and 1,3,5-benzenetrlcarbonyl trichloride (TMC, AR > 98%) were purchased from Aladdin Industrial Co., Ltd. (China).
《2.2. Fabrication of the Janus-charged M-CEMs》
2.2. Fabrication of the Janus-charged M-CEMs
The optimal membrane can be obtained through systematic optimization of the fabrication conditions. The membrane fabrication process is illustrated in Fig. 1. First, a pristine CEM was fixed in the frame to modify one side, then it was immersed in a TMA and SDS solution for 5 min, and the excess solution was removed using a hair dryer in cool mode. Second, the dried membrane was immersed in PEI solution for 2 min, and the excess PEI solution was removed using a hair dryer in cool mode. Finally, the membrane was placed in an oven for post-treatment. The fabrication conditions of the M-CEMs with Janus-charged structures are listed in Table 1. M-TMA-0.15 wt% and M-PT-90 °C were the different names for the optimal membrane.
《Fig. 1》

Fig. 1. Schematic illustration of the fabrication of the Janus-charged M-CEMs.
《Table 1》
Table 1 Fabrication conditions of M-CEMs with the Janus-charged structure.

In addition, an interfacial polymerization reaction was applied to construct porous CEMs, as shown in Fig. S1 in Appendix A. First, a polysulfone (PSF) membrane was immersed in 3 wt% PIP aqueous solution for 3 min. After removing the excess PIP solution, 0.1 wt% TMC hexane solution was added to the membrane surface for 10 s. Thereafter, the membrane surface was cleaned with hexane solution three times. Finally, the membrane was heat-treated in an oven at 60 °C for 10 min, and this membrane was named TFCM.
《2.3. Characterizations of the membrane 》
2.3. Characterizations of the membrane
The cation concentration was measured using inductively coupled plasma optical emission spectrometry (ICP-OES; iCAP 7400; Thermo Scientific, USA). The morphology and roughness of the membrane surface were measured via scanning electron microscope (SEM; Merlin Compact, ZEISS, Germany) and atomic force microscope (AFM; Bruker AXS, Germany). Attenuated total reflection flourier transformed infrared spectroscopy (ATR-FTIR; Nicolet iS50; Thermo Scientific) and X-ray photoelectron spectroscopy (XPS; ESCALAB 250Xi; Thermo Scientific) were employed to analyze the functional groups and chemical structure of the composite layer, respectively. SurpassTM3 (Anton Paar, Austria) was also utilized to analyze the surface zeta potential by varying the pH from 2 to 8.
《2.4. Perm-selectivity measurements and SED measurements》
2.4. Perm-selectivity measurements and SED measurements
The configuration and digital photo of the ED stack are shown in Figs. 2(a) and (b). The ED stack contained two AEMs and one M-CEM. The thin selective layer must face the diluted chamber to obtain optimal ion selectivity during ED. During the experiment, the diluted chamber (DC) contained 0.1 mol·L–1 NaCl and 0.1 mol·L–1 MgCl2. The concentrated chamber (CC) contained 0.01 mol·L–1 KCl. The volume of DC and CC were 250 mL. The electrode-rinsing chamber (EC) contained 0.3 mol·L–1 Na2SO4 with a volume of 500 mL. In addition, the current density was 10 mA·cm–2 and the effective membrane area was 20 cm2 . Furthermore, to explore the effect of current density on the permselectivity and normalized ion fluxes, current densities of 5, 7.5, 10, 12.5, and 15 mA·cm–2 were applied. The flow rate of DC and CC was twenty liter per hour (LPH), whereas that of EC was 40 LPH. The ED experiment lasted for 1 h. The as-prepared membranes were measured thrice to ensure repeatability. The optimal membrane was run for five cycles to investigate membrane stability.
《Fig. 2》

Fig. 2. Schematic diagram of the configuration of (a) ED stack (MCl: monovalent cation chloride; DCl2: divalent cation chloride; AM: anion exchange membrane, CM: cation exchange membrane), (b) the digital photo of the ED stack, (c) schematic diagram of the configuration of the SED stack (EC: electrolyte-rinsing chamber; DC: diluted chamber; CC: concentrated chamber; AEM: anion exchange membrane; CEM: cation exchange membrane; M-CEM: monovalent cation exchange membrane; FC: feed chamber; PC: product chamber; BC: brine chamber), and (d) the digital photo of the SED stack.
The perm-selectivity measurement for the optimal membrane was performed in a Li/Mg system. Here, DC contained 0.1 mol·L–1 LiCl and 0.1 mol·L–1 MgCl2, with a current density of 5 mA·cm–2 . The other measurement conditions were unchanged.
Unlike conventional ED stacks, cationic SED stacks are composed of two AEMs, CEM and M-CEM. The configuration and digital photo of SED are shown in Figs. 2(c) and (d). The initial feed chamber (FC) contained 10 mmol·L–1 Na2SO4 and 20 mmol·L–1 MgSO4, and its volume was 250 mL. The initial PC contained 20 mmol·L–1 Na2SO4, and its volume was 125 mL. The initial brine chamber (BC) contained 0.1 mol·L–1 Na2SO4, and its volume was 250 mL. EC contained 0.3 mol·L–1 Na2SO4, and its volume was 500 mL. Furthermore, the current density of SED was 5 mA·cm–2 . The conductivities of FC, PC, and BC were measured using a conductivity meter.
Ion flux can be calculated according to Eq. (1):

where  (mol·cm–2 ·s–1 ) denotes the ion flux of
  . Ct (mol·cm–3 ) and C0 (mol·cm–3 ) denote the concentration of ions at time t and 0 in CC, respectively. V (cm3 ) is the volume of CC and Am (cm2 ) is the effective membrane area.
The perm-selectivity can be calculated according to Eq. (2):

where P denotes the perm-selectivity of M-CEMs;  and
and  denotes the ion fluxes of N+ and Mn+ , respectively;
  and
and  are the concentrations of Mn+ and N+ in CC, respectively.
《Fig. 3》
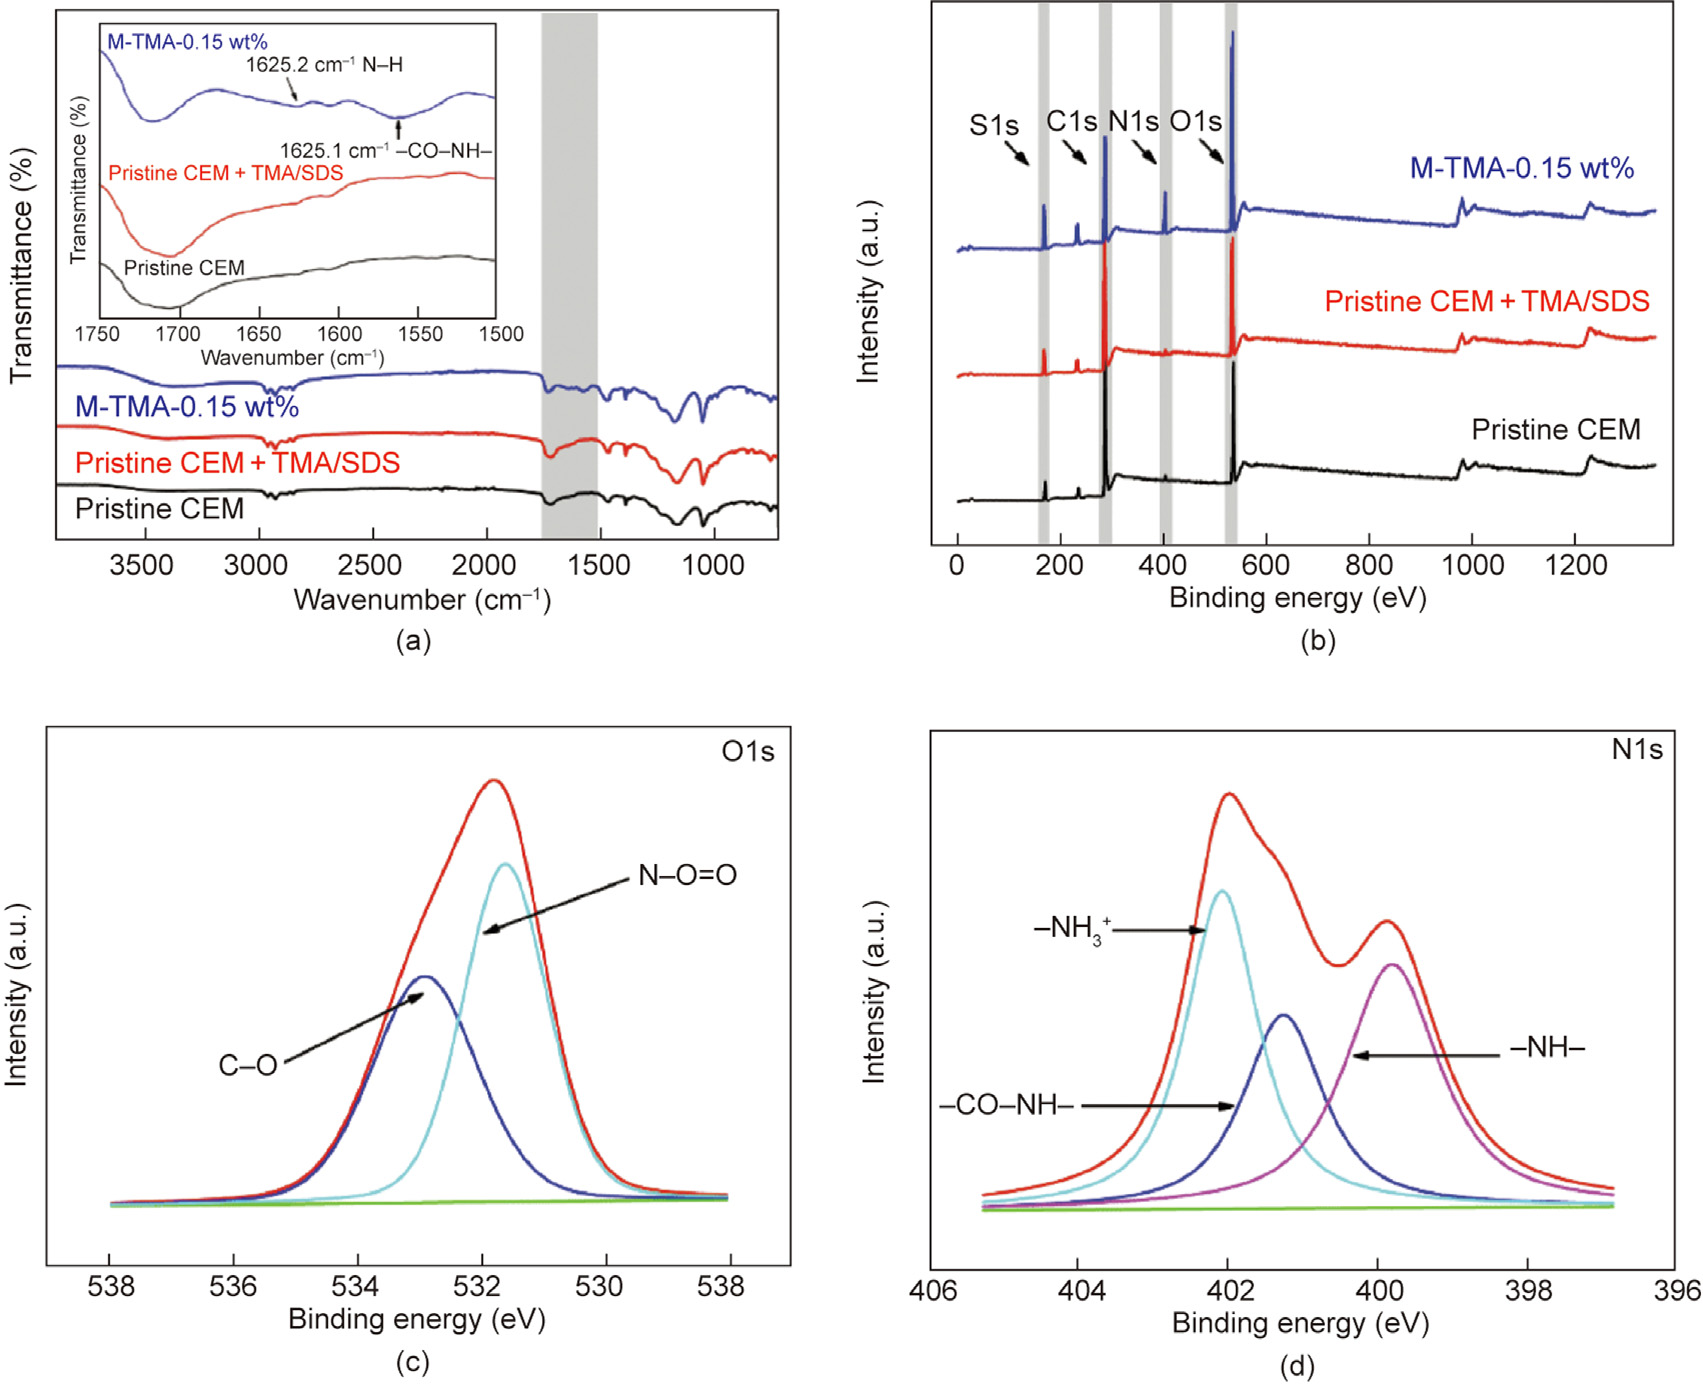
Fig. 3. (a) ATR-FTIR spectra of the pristine CEM, pristine CEM + TMA/SDS, and M-TMA-0.15 wt%, (b) XPS spectra of the pristine CEM, pristine CEM + TMA/SDS, and M-TMA0.15 wt%, (c) XPS O1s, and (d) XPS N1s spectra of M-TMA-0.15 wt%.
《3. Results and discussion》
3. Results and discussion
《3.1. Characterization of the membrane》
3.1. Characterization of the membrane
The chemical compositions of pristine CEM, pristine CEM + TMA/ SDS, and M-TMA-0.15 wt% were measured via ATR-FTIR, and the results are shown in Fig. 3(a). Notably, a new characteristic peak at 1562.1 cm–1 represents the amide II band (N–H in-plane bending and N–C stretching vibration of a –CO–NH– group) [49], and a new peak at 1625.2 cm– represents the aromatic amide (N–H deformation vibration) [49]. This indicated that the crosslinking reaction between –NH2 in PEI and –COOH in TMA successfully occurred on the membrane surface [19]. Furthermore, the XPS spectra of the pristine CEM, pristine CEM + TMA/SDS, and M-TMA-0.15 wt% are shown in Fig. 3(b), and in M-TMA-0.15 wt%, the clear peak of N1s, which could not be found in pristine CEM and pristine CEM + TMA/SDS, indicated that a TMA/PEI surface thin layer was successfully generated on the surface of the pristine CEM. In addition, N1s peaks could be deconvoluted into three peaks: –NH– at 399.8 eV, –CON– at 401.2 eV, and –NH3+ at 402.1 eV [50]. Furthermore, the O1s peak of the M-TMA-0.15 wt% could be divided into two peaks: C–O at 532.9 eV and N–C=O at 531.6 eV [42]. Therefore, the results indicate that a TMA/PEI surface thin layer was successfully formed on the surface of the pristine CEM.
The rapid crosslinking reaction between TMA and PEI led to the formation of highly crosslinked polymers, but the nascent crosslinked membranes delayed the diffusion of TMA molecules. This resulted in a TMA/PEI surface thin layer with a gradient structure, which had a significant effect on the morphology of the membrane (Fig. 4). Figs. S2–S7 in Appendix A show the morphology and roughness of the pristine CEM and modified membranes. Figs. 4(a), (b), (e), and (f) show that compared with the pristine CEM, the modified membranes exhibited a rougher surface morphology. As the concentration of PEI increased, the observation of a uniform morphology was attributed to a higher crosslinking degree and more PEI anchorage. Furthermore, the rougher morphology at a high TMA concentration was because the excess rigid TMA molecules enhanced the stiffness of the TMA/PEI network and reduced the freedom of the TMA/PEI network [29]. In addition, the lower porosity and smoother morphology of the membrane surface were ascribed to the higher crosslinking degree at higher posttreatment temperatures; however, SDS precipitation at a posttreatment temperature of 100 °C inevitably caused defects on the surface of the membrane. In addition, Figs. 4(c) and (d) show the cross-sections of the pristine CEM and M-TMA-0.15 wt%, respectively. A TMA/PEI surface thin layer in M-TMA-0.15 wt% could be easily observed and its thickness was 545 nm, which indicated that the TMA/PEI surface thin layer was continuous and stably generated on the surface of M-TMA-0.15 wt%.
《Fig. 4》
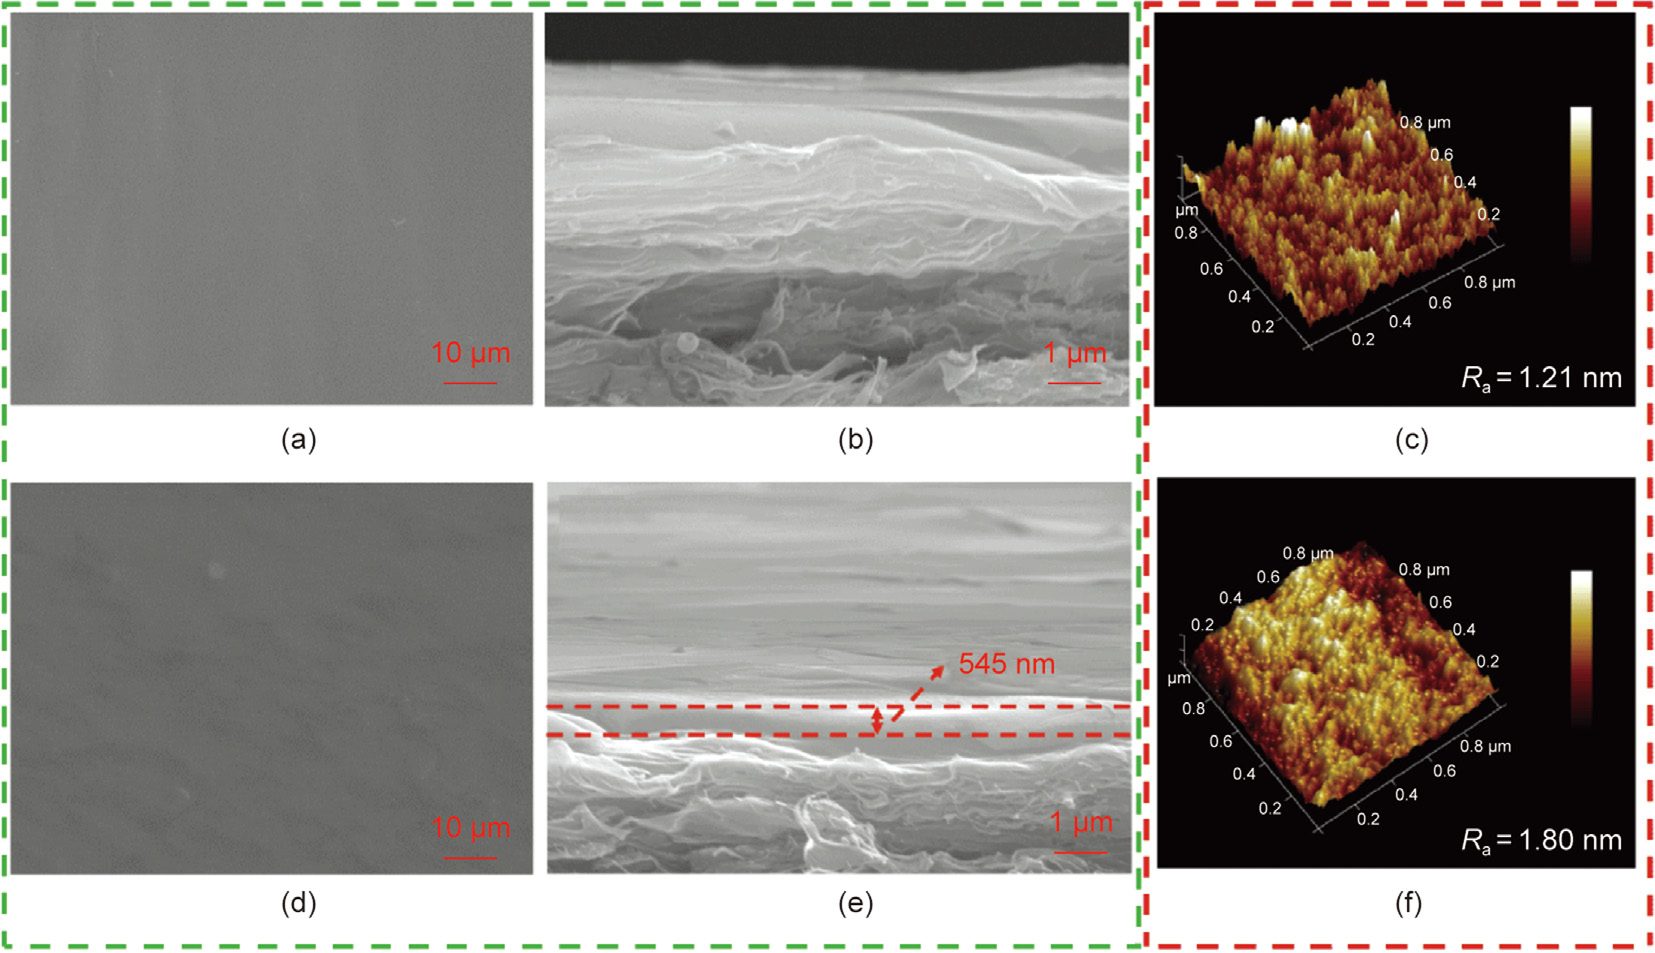
Fig. 4. SEM images of the membrane surface of the (a) pristine CEM and (b) M-TMA-0.15 wt%, membrane cross-section of the (c) pristine CEM and (d) M-TMA-0.15 wt%, as well as AFM images of the (e) pristine CEM and (f) M-TMA-0.15 wt%. Ra: roughness average.
The results of the surface zeta potential can reflect the intensity and amount of ionizable groups, demonstrating the electrostatic interaction between the selective layers and cations. Fig. 5 shows the surface zeta potential of the pristine CEM, three modified membranes with different PEI concentrations ranging from 0.2 to 1.0 wt%, and three modified membranes with different TMA concentrations ranging from 0.05 to 0.25 wt%. The surface zeta potential of the pristine CEM was lower than 0 in a pH range of 2 to 8, which was because of the dissociation of –SO3H in the pristine CEM. The protonation of the amino groups in the PEI molecules resulted in modified membranes with positive charges. Notably, the isoelectric points of M–PEI-0.20 wt%, M–PEI-0.6 wt%, and M–PEI-1.0 wt% were 3.58, 3.99, and 4.57, respectively, the higher isoelectric points were attributed to more PEI molecules anchored on the surface of the membrane [29]. The isoelectric points of M-TMA-0.05 wt% and M-TMA-0.15 wt% increased from 3.84 to 5.30 as TMA concentration increased from 0.05 to 0.15 wt%, which indicated that more PEI molecules could be anchored on the surface of the membrane to react with TMA molecules at higher TMA concentration. However, the amount of PEI molecules was insufficient at high TMA concentrations; thus, the residual –COOH in TMA could be dissociated to reduce the isoelectric points from 5.30 to 4.01.
《Fig. 5》

Fig. 5. (a) Zeta potentials of the pristine CEM and different Janus-charged M-CEMs prepared using different PEI concentrations (0.1 wt% TMA and 0.15 wt% SDS) as well as (b) different TMA concentrations (0.8 wt% PEI and 0.15 wt% SDS) in a 90 °C oven for 10 min.
《3.2. Optimization of the fabrication conditions of the Janus-charged MCEMs》
3.2. Optimization of the fabrication conditions of the Janus-charged MCEMs
For M-CEMs, the perm-selectivity of the membrane is determined by the properties of the selective layer. According to a previous study, the perm-selectivity of the CSO membrane (a commercial M-CEM) was 3.54 [51]. Various Janus-charged M-CEMs were systemically prepared to investigate the effect of the fabrication conditions such as PEI and TMA concentrations, as well as post-treatment temperature on the total cation fluxes and perm-selectivity. More PEI anchorage led to the formation of a denser surface with more positive charges as the PEI concentration increased (Figs. S2, S5, and 5(a)), which significantly enhanced the perm-selectivity of Na+ /Mg2+ from 0.76 to 10.83 (Fig. 6(a)). A further increase in sPEI concentration from 0.8 to 1.0 wt% could not enhance the perm-selectivity of the membrane further, indicating that the excess PEI molecules could not be anchored on the membrane surface, and thus the PEI concentration was determined as 0.8 wt%. Furthermore, as shown in Fig. 6(b), the permselectivity of Na+ /Mg2+ reached the highest value of 17.27 when the TMA concentration was 0.15 wt%. However, increasing TMA concentration further reduced the perm-selectivity of Na+ /Mg2+ from 17.27 to 6.27, which was owing to a rougher surface with less positive charges (Figs. S3, S6, and 5(b)). In addition, the effect of the post-treatment temperature on the total cation flux and permselectivity was investigated, as shown in Fig. 6(c). A high posttreatment temperature improved the crosslinking degree and formed a defect-free selective layer, thereby enhancing the permselectivity of Na+ /Mg2+ from 7.83 to 17.27 when the posttreatment temperature increased from 60 to 90 °C. However, the formation of SDS precipitation at a post-treatment temperature of 100 °C might cause the shedding of the selective layer and reduce the perm-selectivity of Na+ /Mg2+ from 17.27 to 4.24 [42]. Conversely, the total cation fluxes and perm-selectivity of the optimal membrane did not decrease significantly after five cycles (Fig. 6(d)), revealing its outstanding membrane stability.
《Fig. 6》
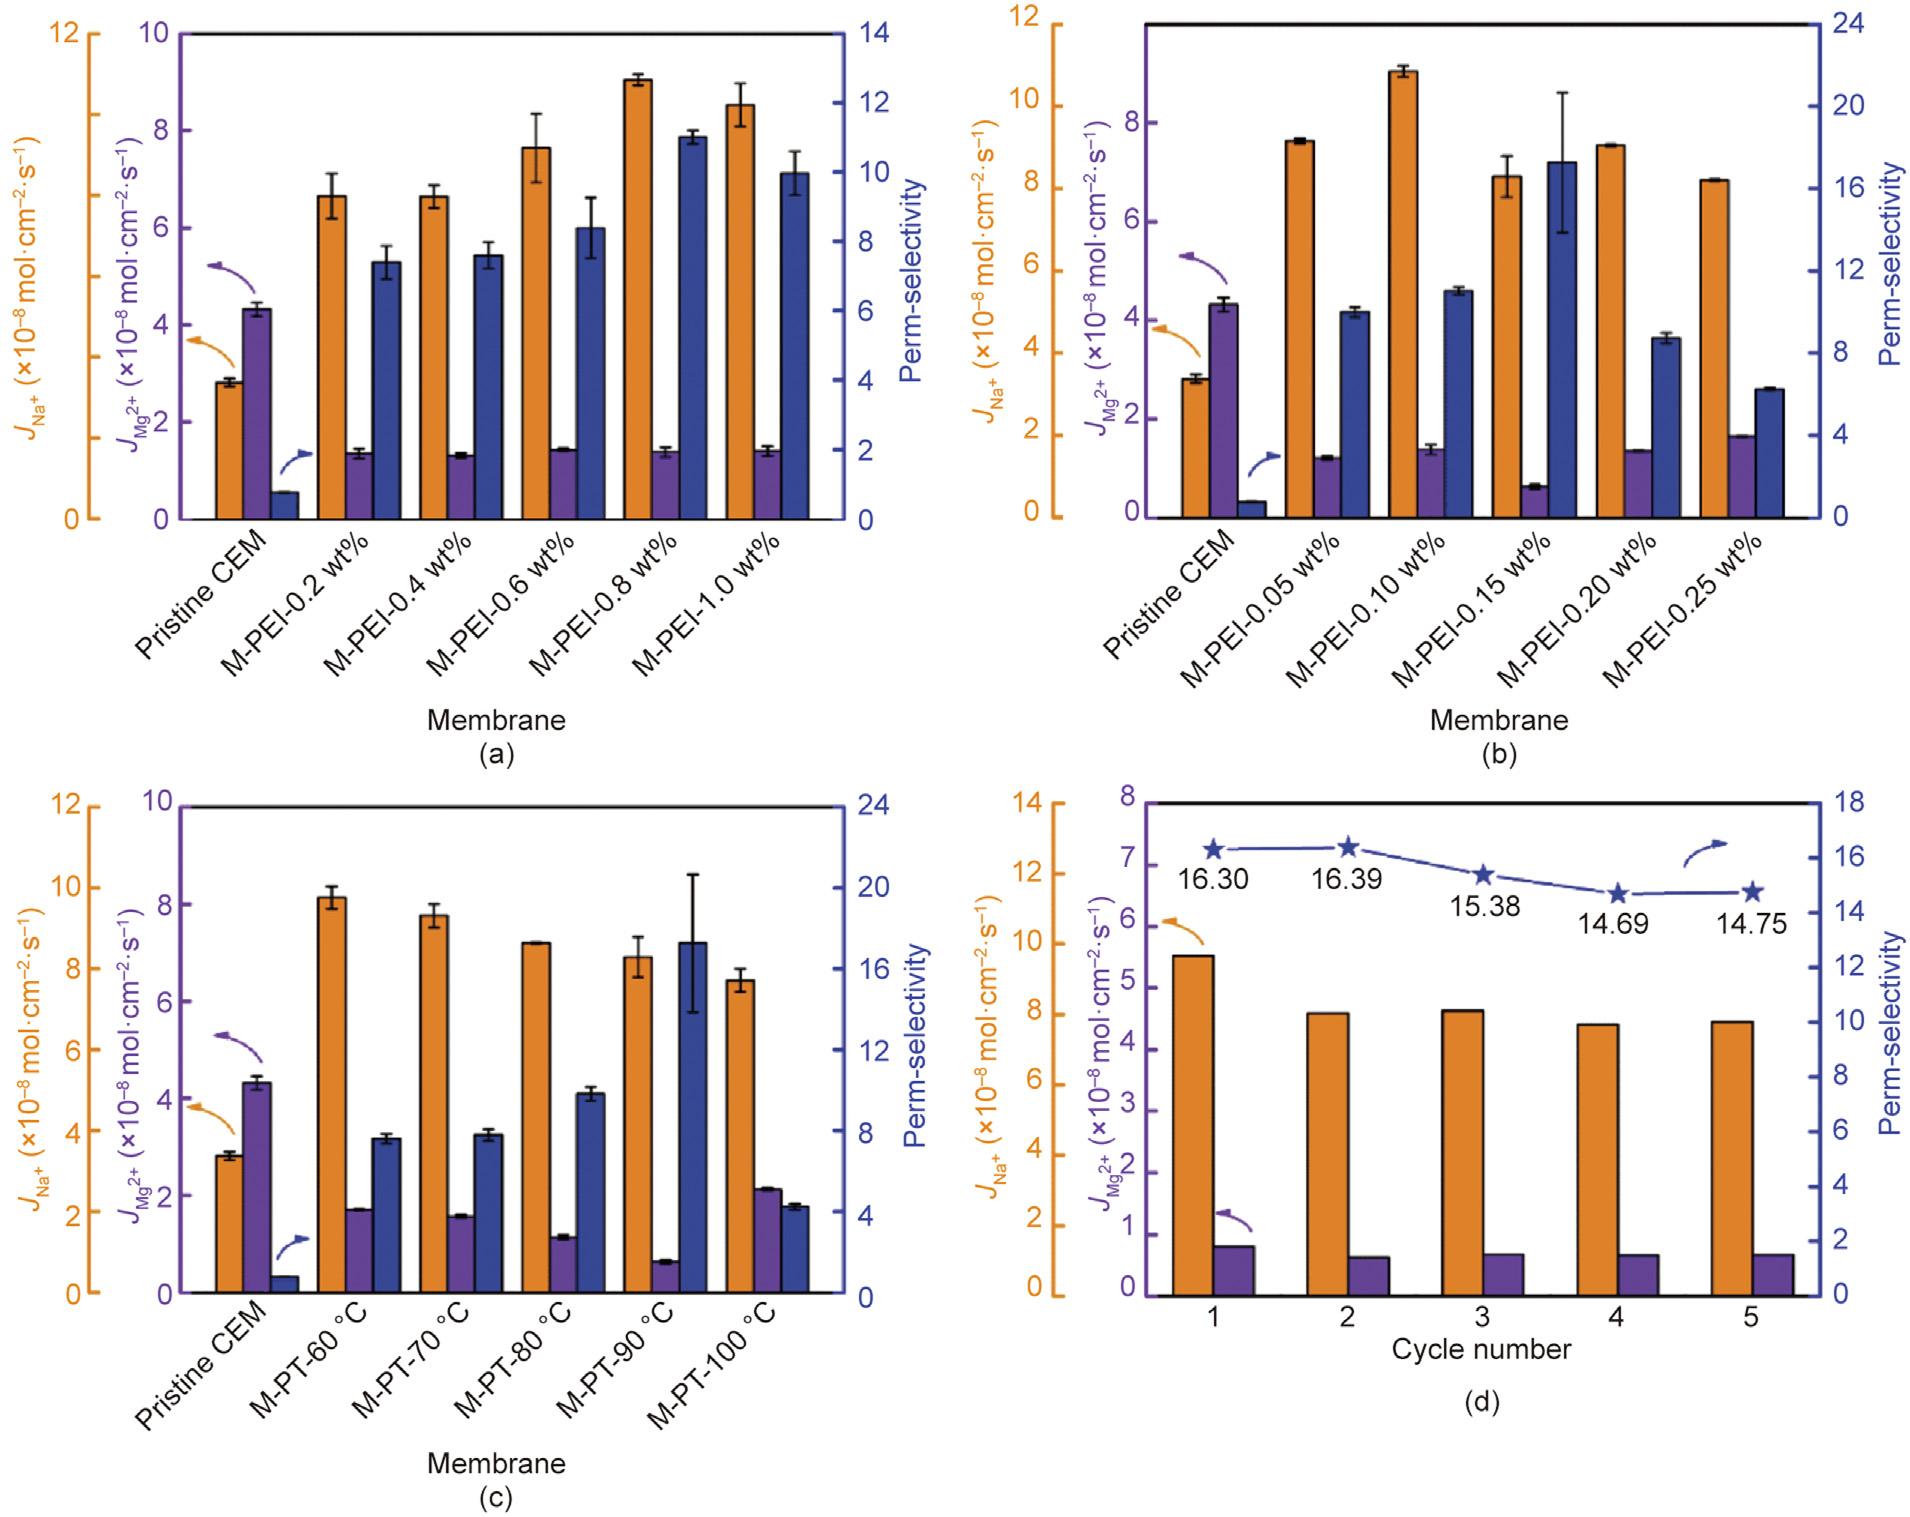
Fig. 6. The effect of (a) PEI concentrations, (b) TMA concentrations, (c) post-treatment temperature on cation fluxes and the perm-selectivity, and (d) the cation fluxes and the perm-selectivity for five cycles of M-TMA-0.15 wt%.
《3.3. Perm-selectivity at different current densities 》
3.3. Perm-selectivity at different current densities
For M-CEMs, the dominant factors for determining the permselectivity are the properties of the selective layer, and three mechanisms for ion transport in the membrane phase are diffusion, convection, and electromigration [19]. The effect of electromigration is more important than that of diffusion and convection when the electric potentials are the driving force. Notably, the normalized ion flux can be applied to compare the membrane performance at different current densities and can be calculated according to Eq. (3).

where  (mol·mA–1 ·s–1 ) denotes the normalized ion flux, and i (mA·cm–2 ) denotes the current density.
Figs. 7(a) and (b) show the effect of different current densities on the cation fluxes and perm-selectivity of the optimal membrane. Notably, the figures show that at a current density of 5 mA·cm–2 , the perm-selectivity of M-TMA-0.15 wt% for Na+ / Mg2+ and Li+ /Mg2+ were 145.77 and 14.11, respectively, and the perm-selectivity gradually decreased as the current density increased. The possible mechanism of electric double layer (EDL) is shown in Fig. 7(c). CEMs generally possess negative charges; therefore, compared with Na+ , Mg2+ with more positive charges is more likely to accumulate on the surface of the membrane to form a Mg2+ layer, increasing the positive charges to prevent further migration of Mg2+ [15]. However, the decrease in the perm-selectivity could be because of the EDL damage at higher current densities. Furthermore, the comparison of our optimal membrane and state-of-the-art M-CEMs in other works [40,51–61] is shown in Fig. 7(d), and our optimal membrane exhibited the highest perm-selectivity (145.77) for Na+ /Mg2+ beyond the contemporary ‘‘Upper Bound” plot between the Na+ flux and perm-selectivity. The general transport order of Mg2+ > Na+ > Li+ for CEMs with sulfonic acid groups indicated that the perm-selectivity of Na+ /Mg2+ was higher than that of Li+ /Mg2+. In addition, compared with the hydration diameter of Na+ (0.716 nm), that of Li+ (0.764 nm) was closer to that of Mg2+ (0.856 nm). As a result, the permselectivity of Li+ /Mg2+ was 14.11 at a current density of 5 mA·cm–2 , and it exhibited a decreasing trend with increasing current density, as shown in Fig. 7(b).
《Fig. 7》
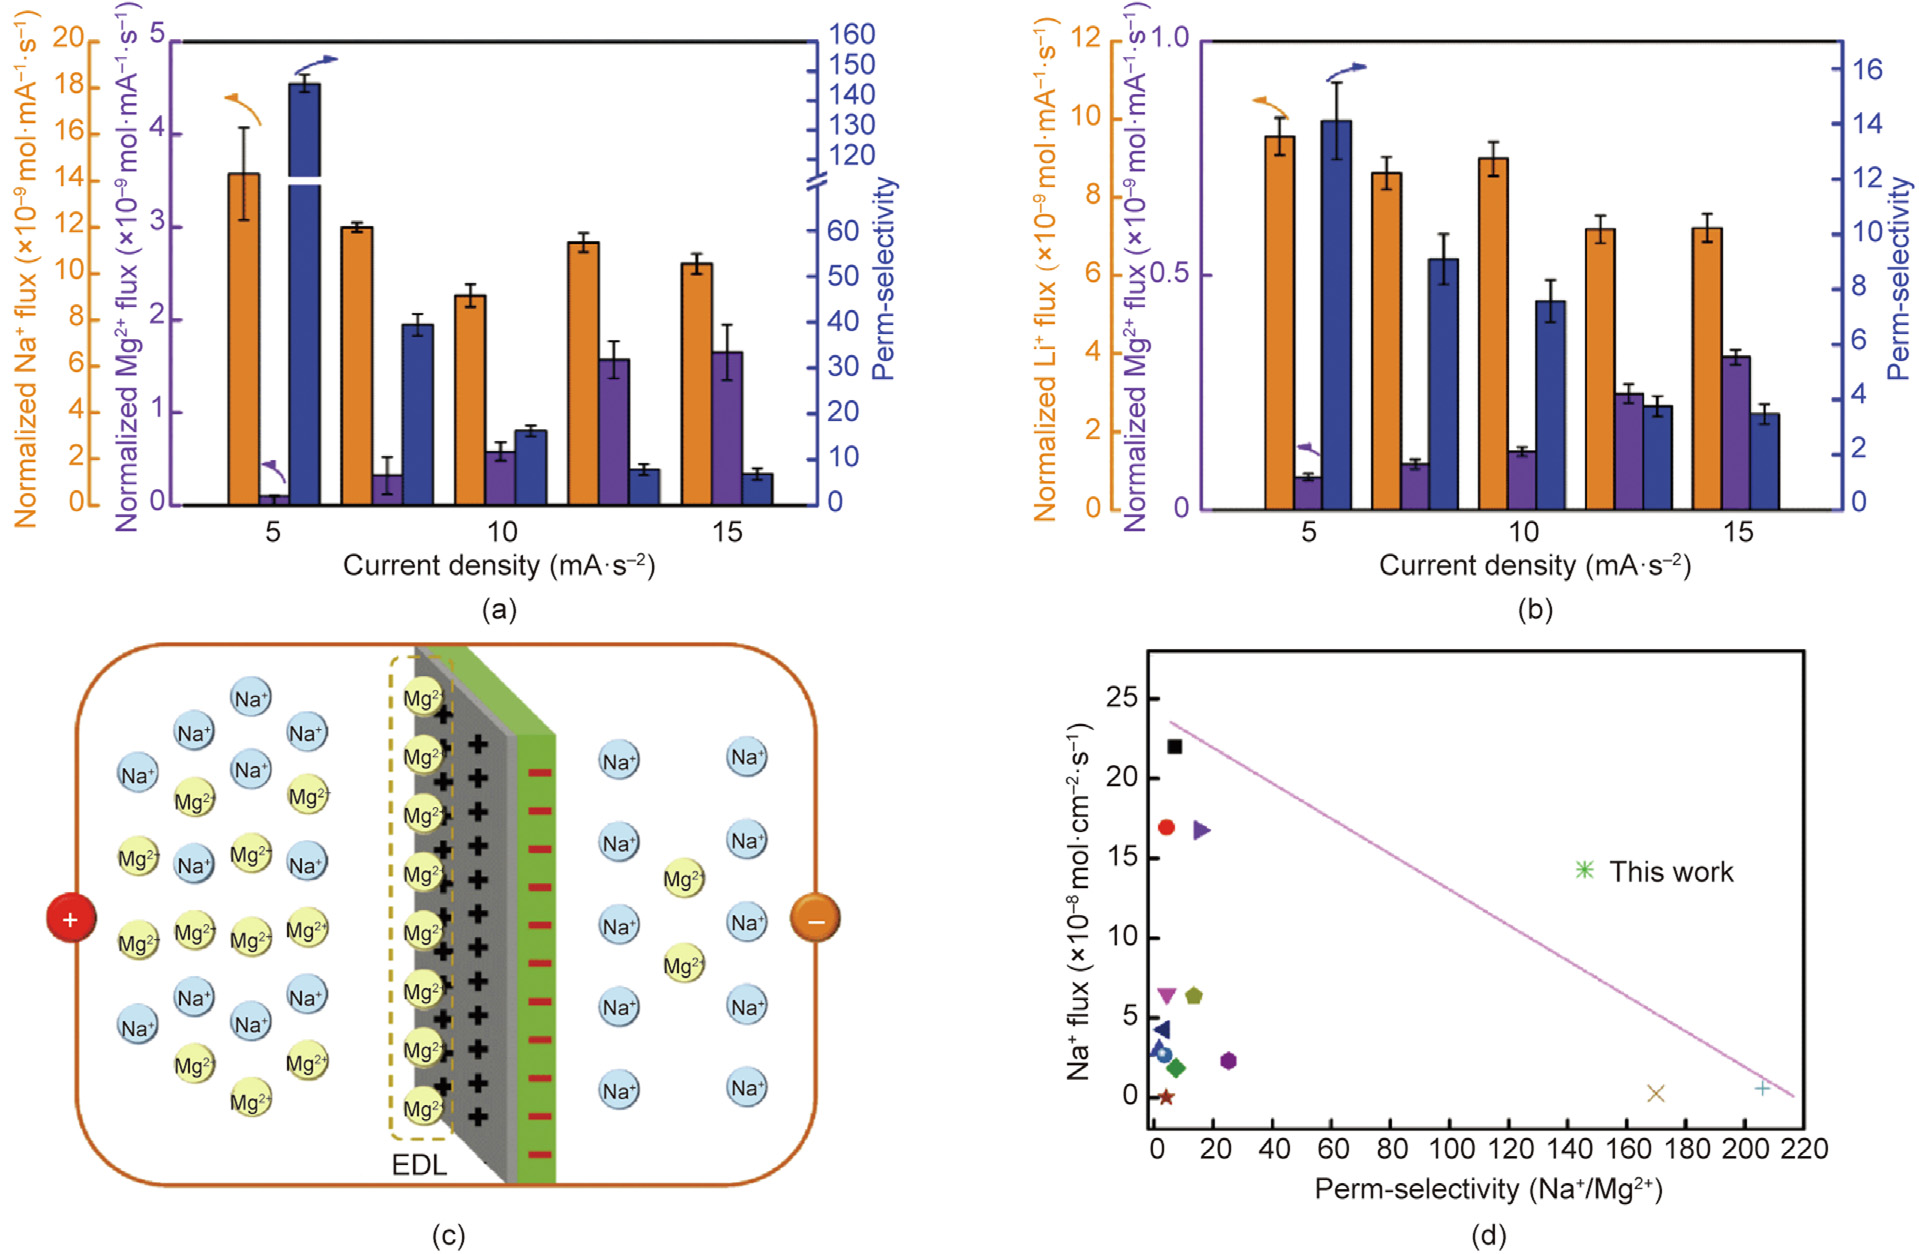
Fig. 7. (a) Perm-selectivity, normalized Na+ flux, and normalized Mg2+ flux of M-TMA-0.15 wt% at different current densities, (b) the perm-selectivity, normalized Li+ flux, and normalized Mg2+ flux of M-TMA-0.15 wt% at different current densities, (c) the separation mechanism of electric double layer, and (d) the contemporary ‘‘Upper Bound” plot between the perm-selectivity (Na+ /Mg2+) and Na+ flux of M-TMA-0.15 wt% and state-of-the-art M-CEMs. EDL: electric double layer.
《3.4. Determination of the membrane performance via SED》
3.4. Determination of the membrane performance via SED
The results of SED with the pristine CEM, M-TMA-0.15 wt%, and TFCM are shown in Figs. 8(a)–(c). The result of SED with TFCM was significantly different from that with the pristine CEM and M-TMA0.15 wt%. Owing to the dense structure in the pristine CEM, the results of SED with the pristine CEM and M-TMA-0.15 wt% followed the principle of conservation of total charge in PC, and the slight reduction in the conductivity of PC was attributed to the replacement of Na+ by Mg2+. However, the porous structure in TFCM could not completely suppress anion migration from BC to PC; thus, the result of SED with TFCM could not follow the principle of conservation of total charge in PC, which increased the PC conductivity (Figs. 8(a)–(c)) and the total cation concentrations (Figs. 8(d)–(f)) increase over time. In addition, we compared the perm-selectivity and cation fluxes of the pristine CEM, M-TMA0.15 wt%, and TFCM, and we established that the total cation fluxes and perm-selectivity of TFCM was significantly lower than that of M-TMA-0.15 wt%, as shown in Fig. 8(g). The possible separation processes of TFCM and the Janus-charged M-CEMs are shown in Figs. 8(h) and (i). The porous substrate without any cation exchange groups and a thin polyamide layer could not completely impede the migration of anions; thus, the migration of anions from CC to DC carries part of the current, which results in a low total cation flux. However, the Janus-charged M-CEMs possessed a dense structure and abundant cation exchange groups, which could prevent the migration of almost all anions, thereby exhibiting a higher total cation flux. Moreover, the positively charged selective layer in M-TMA-0.15 wt% could inhibit the migration of Mg2+. Considering the energy consumption and separation efficiency, the Janus-charged M-CEMs are promising candidates for practical applications.
《Fig. 8》

Fig. 8. Conductivity of FC, PC, and BC as a function of time when using SED with the (a) pristine CEM, (b) M-TMA-0.15 wt%, and (c) TFCM as the M-CEMs; the concentration of Na+ and Mg2+ in PC change over time of (d) the pristine CEM, (e) M-TMA-0.15 wt%, and (f) TFCM (current density 5 mA·cm–2 ); (g) the perm-selectivity and cation fluxes of different membranes (current density 10 mA·cm–2 ); (h) separation of TFCM during ED or SED, and (i) separation of the Janus-charged M-CEMs during ED or SED.
《4. Conclusions 》
4. Conclusions
This study proposed a facile method for fabricating the Januscharged M-CEMs. After systematically investigating the effects of the fabrication conditions on the perm-selectivity and cation fluxes, the optimal membrane exhibited that the permselectivities of Na+ /Mg2+ and Li+ /Mg2+ were 145.77 and 14.11 at a current density of 5 mA·cm–2 , and the perm-selectivity of the optimal membrane decreased with increasing current density. In addition, the SED results confirmed that the Janus-charged M-CEMs could effectively suppress the migration of anions, which often occurred in porous CEMs, thereby enabling the Janus-charged MCEMs to possess high total cation fluxes, which could provide insights for designing the Janus-charged M-CEMs for ion separation in diverse environmental and energy applications.
《Acknowledgments》
Acknowledgments
This work was supported by the National Natural Science Foundation of China (21878062), the Natural Science Foundation of Heilongjiang Province for Distinguished Young Scholars (JQ2020B001), Heilongjiang Touyan Team (HITTY-20190033), and Open Project of State Key Laboratory of Urban Water Resource and Environment (Harbin Institute of Technology) (QA202127).
《Compliance with ethics guidelines》
Compliance with ethics guidelines
Wenguang Wang, Yanqiu Zhang, Xiaobin Yang, Haixiang Sun, Yadong Wu, and Lu Shao declare that they have no conflict of interest or financial conflicts to disclose.
《Appendix A. Supplementary data》
Appendix A. Supplementary data
Supplementary data to this article can be found online at https://doi.org/10.1016/j.eng.2021.09.020.


 京公网安备 11010502051620号


