

《1. Introduction》
1. Introduction
Climate change is a global environmental challenge. Mitigating climate change, implementing the Paris Agreement, and promoting the low-carbon transition are common global goals. As the world’s second-largest economy, largest exporter, and largest energy consumer [1,2], China has implemented a proactive national strategy to address climate change, taking a series of measures from energy structure optimization to industrial structure adjustment. China has become a global leader in renewable energy growth [3,4], accounting for 45% of the world’s newly installed renewable energy capacity by 2020 [5]. China has set ambitious targets for carbon peaking by 2030 and carbon neutrality by 2060 [6], making it the first developing country to set a deadline for carbon neutrality among the world’s major emitters. Guidance on integrating and strengthening efforts related to climate change and ecological protection was issued by the Ministry of Ecology and Environment of the People’s Republic of China (PRC) in January 2021, which stated that carbon emission reduction is the key to collaborative control of greenhouse gas (GHG) and pollutant emissions [7]. Achieving the goals of carbon peaking and carbon neutrality over such a short time span requires extraordinary efforts. Cities are the main consumers of resources and emitters of pollutants and CO2. Hence, the low-carbon development of cities is of great significance to national carbon neutrality and global climate change mitigation.
As one of the national economic development strategies in China, the Guangdong–Hong Kong–Macao Greater Bay Area (GBA) development plan outline was issued by the State Council in February 2019, aiming to make the GBA a world-class city cluster and a model for green and low-carbon development [8]. The GBA is composed of nine cities in the Pearl River Delta (PRD) and the two special administrative regions of Hong Kong and Macao, contributing 12% of the country’s gross domestic product (GDP) and 5% of the country’s population. With an advanced manufacturing sector and well-established supply chain, the added value of traditional industries (textiles, papermaking and printing, petrochemicals, and steel and non-ferrous metals) accounted for 43% of the secondary industry of the GBA in 2020 [9]. A high dependence on coal has caused higher carbon emission intensity in the GBA than in other international bay areas [10]. With a growing economy and population, the total energy demand and CO2 emissions of the GBA will continue to grow, resulting in increasing pressure on resources and the environment [11]. Socioeconomic and industrial development among GBA cities is uneven, especially the gap between Hong Kong, Macao, Guangzhou, Shenzhen, and other cities. Exploring the trends, drivers, and differentiated mitigation pathways in the CO2 emissions of GBA cities is both a necessary way to achieve regional green and sustainable development and an important step to achieve carbon peaking and neutrality goals.
Previous studies on CO2 emission characteristics and socioeconomic drivers in GBA cities have encountered several challenges. First, as shown in Table 1 [12–17], the majority of studies in this field have only examined CO2 emissions for an individual city, year, and industry rather than the entire region, using a long time span, and for the whole industry. They have thus been unable to evaluate the overall CO2 emissions trend of the GBA. Second, the existing analyses focus on the driving factors of CO2 emissions for Guangdong Province and particular cities, making it difficult to examine the contributions of individual cities or industries to the CO2 emissions of the GBA [18–21]. Third, heterogeneities in the economic development, industry, and structure of the cities result in different patterns of low-carbon development [22,23]. Therefore, onesize-fits-all carbon mitigation approaches are undesirable for cities in the GBA. Fourth, the cities currently use different emission accounting methods, making the data incomparable.
《Table 1》
Table 1 Previous studies on CO2 emissions in the GBA.

To fill the existing gaps, this study constructed city-level CO2 emission inventories for GBA (2000–2019) that are comparable and consistent with national and provincial levels based on the Intergovernmental Panel on Climate Change (IPCC) methodology. The contribution of key drivers (i.e., factors, cities, and sectors) to the CO2 emissions of GBA was examined based on the logarithmic mean Divisia index (LMDI) model, and differentiated cities’ reduction pathways and low-carbon development roadmaps are proposed. Exploring the CO2 emission drivers of GBA cities under the new normal and tailor-made low-carbon development roadmaps can provide a scientific basis for developing an action program for carbon peaking and carbon neutrality in the GBA. The low-carbon development of the GBA will provide valuable sustain able development experience for the Yangtze River Delta region, Beijing–Tianjin–Hebei region, as well as guidance for the GBA in formulating its carbon peaking and carbon neutrality targets.
《2. Literature review》
2. Literature review
An accurate CO2 emission inventory provides a quantitative basis for the development and implementation of carbon emission mitigation policies. Kennedy et al. [22] calculated GHG inventories for 22 cities worldwide using a bottom-up approach based on the United Nations Framework Convention on Climate Change. Wang and Liu [24] assessed city-level CO2 emissions based on defense meteorological satellite program’s operational linescan system (DMSP/OLS) ‘‘City Light” satellite data. Du et al. [25] applied monthly nighttime light data to create a rapid accounting China carbon watch system to calculate monthly data on provincial urban and rural household carbon emissions from January to May 2020. Most of the data used in these studies were sourced from urban statistical documents, remote sensing images, published reports, and the literature. However, these data must be systematically reviewed to ensure consistency and accuracy. Carbon emission accounts and datasets (CEADs) have developed methods for constructing CO2 emission inventories for Chinese cities in terms of both fossil energy consumption and industrial production processes [26,27], which can provide uniform and comparable energy and emission statistics for Chinese cities [28].
Econometric and decomposition analysis models have been applied to identify the socioeconomic drivers of CO2 emissions [29,30]. In the econometric analysis model, CO2 emissions were chosen as the dependent variable and potential influences as the independent variables, such as foreign direct investment and urbanization rate [31–34]. Econometric analysis is based on the assumption of conditional mean functions, with model estimation and testing at its core, and is irreversible, time-varying, and nonexperimental in its practical application [30,35].
Decomposition analysis is generally based on a constant equation that decomposes carbon emissions into scale, structural, and technological effects [36]. Structural decomposition analysis (SDA), index decomposition analysis (IDA), and production-theoretical decomposition analysis (PDA) are representative decomposition methods [37]. By combining production theory, the distance function, and environmental data in envelopment analysis [38–40], PDA can quantify the effect of efficiency and production technology on changes in CO2 emissions [41–43]. However, PDA cannot capture the impact of structural components (i.e., the industrial and energy mix), which are important drivers of carbon emissions [30,44].
The SDA approach was first used for structural analysis of the economy and then extended to the analysis of the effects of energy consumption and carbon emissions [45–47]. The methodology allows for the simultaneous assessment of production and consumption side effects based on input–output models and the ability to distinguish between technology effects and final demand effects. To further trace trade-embodied emissions, CO2 emissions can be decomposed into the effects of consumption, investment, exports, and imports [48–50]. The SDA approach relies heavily on input–output tables; owing to the lack of subnational input–output data, it is not suitable for the city-level analysis of CO2 emission drivers [46].
The IDA approach is widely used for production-based CO2 emission driver analysis with low data requirements, which is suitable for additive and multiplicative decomposition analyses of multiple drivers of environmental pressure [36,51,52]. Among the various IDA methods, the LMDI introduces a logarithmic mean weight function to eliminate decomposition residuals, which has the advantages of adaptability, convergence, and consistency, as well as ease of use and interpretation [53,54]. Based on past studies and empirical evidence, the LMDI is favorable for analyzing the socioeconomic drivers of CO2 emissions and providing policyrelevant insights [23,55–57].
《3. Methodology》
3. Methodology
《3.1. CO2 emission accounting》
3.1. CO2 emission accounting
Following the IPCC guidelines, we accounted for the CO2 emissions inventory within the administrative-territorial boundaries of GBA cities from 2000 to 2019, and quantified the emissions from socioeconomic sectors and residential activities directly within regional boundaries [58]. The trend of the CO2 emissions of GBA cities from fossil fuel combustion and industrial processes was analyzed, covering 47 socioeconomic sectors, 17 fossil fuels, and 7 industrial processes [26] (Tables S1–S3 in Appendix A). The energy consumption used as chemical raw materials and losses during transportation were removed from the total energy consumption to avoid double counting [59]. The emissions of electricity and heat generated within city boundaries were calculated based on the primary energy input. The administrative region emission inventory excludes emissions from imported electricity and heat consumption from outside the city boundary as well as the energy consumed by inter-city transportation.
3.1.1. Energy consumption
According to the IPCC method [58], the CO2 emitted from energy consumption (Cenergy) was calculated by multiplying the energy activity (energy consumption) of different socioeconomic sectors and the corresponding emission factors, as in Eq. (1):

where i represents the energy type and j represents the socioeconomic sector. Cij means CO2 emissions by energy type i and socioeconomic sector j. ADij denotes the activity data, namely fossil fuel consumption. NCVi, CCi, and Oij are emission factors that represent the net caloric value, carbon content, and oxygenation efficiency, respectively. The emission factors were collected by Liu et al. [28] and are considered to be more accurate for China’s energy consumption and have been widely used by many scholars [60–62]. In this study, emission factors were fixed in the time-series emission estimations for specific energy types.
3.1.2. Industrial processes
CO2 emissions from industrial processes (Cprocess) represent the emissions from the chemical and physical transformations of materials in industrial processes, such as cement and lime production. The CO2 emissions associated with this process were calculated using Eq. (2):

where k represents the industrial process; Ck and EFk represent process-related CO2 emissions and emission factors, respectively; ADk represents the activity data, namely production of industrial products. The emission factor for cement production was obtained from Liu et al. [28], and other emission factors for industrial processes were sourced from the IPCC.
《3.2. LMDI method》
3.2. LMDI method
The contributions of driving factors, key cities, and industries to the CO2 emissions of the GBA were explored using the LMDI method (Eqs. (3) and (4)). Previous studies have demonstrated that scale, structure, and technology are the main factors driving CO2 emissions [57,63–65]. Based on the constant equation, the CO2 emission drivers of the GBA were decomposed into six factors: fuel quality, energy structure, energy intensity, industrial structure, GDP per capita, and population. Fuel quality and energy intensity represent technology effects, industrial structure and energy structure represent structural effects, and GDP per capita and population represent scale effects. The LMDI calculations in this study were conducted for nine cities in the PRD and Hong Kong. Owing to the lack of data on energy consumption by sector and its small share of GBA CO2 emissions (0.3%), Macao was excluded from the decomposition analysis.
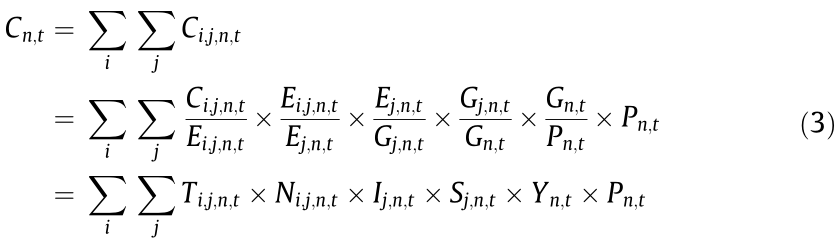
where n and t refer to region and year, respectively. Cn,t represents the CO2 emissions from region n in year t;  represents the emission intensity of fuel type i in sector j for year t in region n, reflecting the upgrading of fuel quality (for example, using anthracite instead of brown coal);
  is the share of the i energy consumed by sector j for year t in region n, which is used to represent the energy structure;
  is energy intensity, representing energy consumption per unit of GDP for year t in region n;
 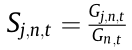 is the proportion of the GDP of sector j in the whole industry for year t in region n, used to express the industrial structure;
  is the per capita GDP for year t in region n, which is used to measure economic development; and Pn,t is the permanent population for year t in region n. Forty-seven socioeconomic sectors were aggregated into six categories: energy production, heavy manufacturing, light manufacturing, high-technology industry, service sector, and others. The 17 types of fossil fuel were classified into three categories: coal, oil, and gas.

In Eq. (4),  , which is the logarithmic average weight factor, and
  is the change in CO2 emissions from year t – 1 to year t for region n.
  and
and  represent the contributions of fuel quality, energy structure, energy intensity, industrial structure, economic development, and population growth, respectively, to CO2 emissions.
《3.3. Data sources》
3.3. Data sources
The permanent population, GDP, industrial added value, industrial energy consumption, and output of industrial products in PRD cities in the period 2000–2019 were derived from the statistical yearbooks of these cities. Missing energy consumption data in PRD cities were derived from the provincial energy consumption data for that year or the energy consumption data of the city in the adjacent years converted by the share of each industry’s value-added and the population. Energy consumption and carbon emissions in Hong Kong by sector were allocated based on an equal share of GDP. GDP was converted into a constant price based on 2010 data, thereby eliminating the influence of price factors. The permanent population and GDP of Hong Kong and Macao from 2000 to 2019 were sourced from the Hong Kong Census and Statistics Department of the Government of the Hong Kong Special Administrative Region and Government of Macao Special Administrative Region Statistics and Census Service. The CO2 emissions data for Hong Kong and Macao were sourced from the International Energy Agency and the Emissions Database for Global Atmospheric Research. The CO2 emissions of cities in the GBA were updated based on our previous studies [27], and more accurate accounting was provided by adjusting the energy consumption data, which can be downloaded for free from the CEADs website↑ .
↑ https://www.ceads.net/.
《3.4. Uncertainty analysis》
3.4. Uncertainty analysis
This study applied the Monte Carlo method recommended by the IPCC to assess the uncertainty of energy-related CO2 emissions [58]. The energy consumption data and emission factors were assumed to be normally distributed with the coefficient of variation (CV; standard deviation divided by the mean) [28]. The CVs of the emission factors were 3% (for coal), 1% (for oil), and 2% (for natural gas), and the CVs for energy activity data ranged from 5% to 30%, depending on the industry [28]. Twenty-thousand-time Stochastic simulations were performed in the Monte Carlo analysis [28]. The 97.5% confidence intervals for the CO2 emissions of PRD cities were estimated, and the uncertainty of energy-related emissions was [–5.07%, 5.15%] with the highest uncertainty in Jiangmen in 2013 [–4.99%, 5.15%] and the lowest uncertainty in Shenzhen in 2009 [–1.30%, 1.29%]. Due to their small contribution (4%–7%) in the GBA, process-related CO2 emissions were ignored in the uncertainty analysis [66].
《4. Results》
4. Results
《4.1. Trends in the CO2 emissions of the GBA》
4.1. Trends in the CO2 emissions of the GBA
By experiencing rapid growth by an average of 3.8% per year from 2000 to 2019, CO2 emissions in the GBA have reached a plateau in 2017 (Fig. 1). From 2000 to 2007, the GBA’s CO2 emissions rose dramatically, at an average of 8.6% a–1 . Emissions exhibited an obvious fluctuation during 2007–2009, rebounded quickly after the global economic crisis, and reached 387 Mt in 2019, which was 8% less than the simulation results (419 Mt in 2017) in the literature [10]. There was large variability in CO2 emissions among GBA cities. PRD cities accounted for 89% of total GBA emissions. Cities with high levels of industrial development, such as Guangzhou, Hong Kong, Shenzhen, Foshan, and Dongguan, were the main sources of CO2 emissions in the GBA. Guangzhou contributed the largest amount of CO2 emissions (26% of the GBA total in 2019), followed by Shenzhen (12%), Hong Kong (11%), Foshan (11%), and Dongguan (11%). Macao is dominated by the gaming industry, which produced the lowest amount of CO2 emissions. As the basis for industrial transfer from the central cities in the GBA, Zhaoqing, Jiangmen, and Huizhou have shown a significant upward trend in CO2 emissions. The low-carbon development of the GBA achieved remarkable results; the CO2 emissions of GBA cities slowed obviously after 2017 and have already been decoupled from GDP growth (Fig. 2).
《Fig. 1》
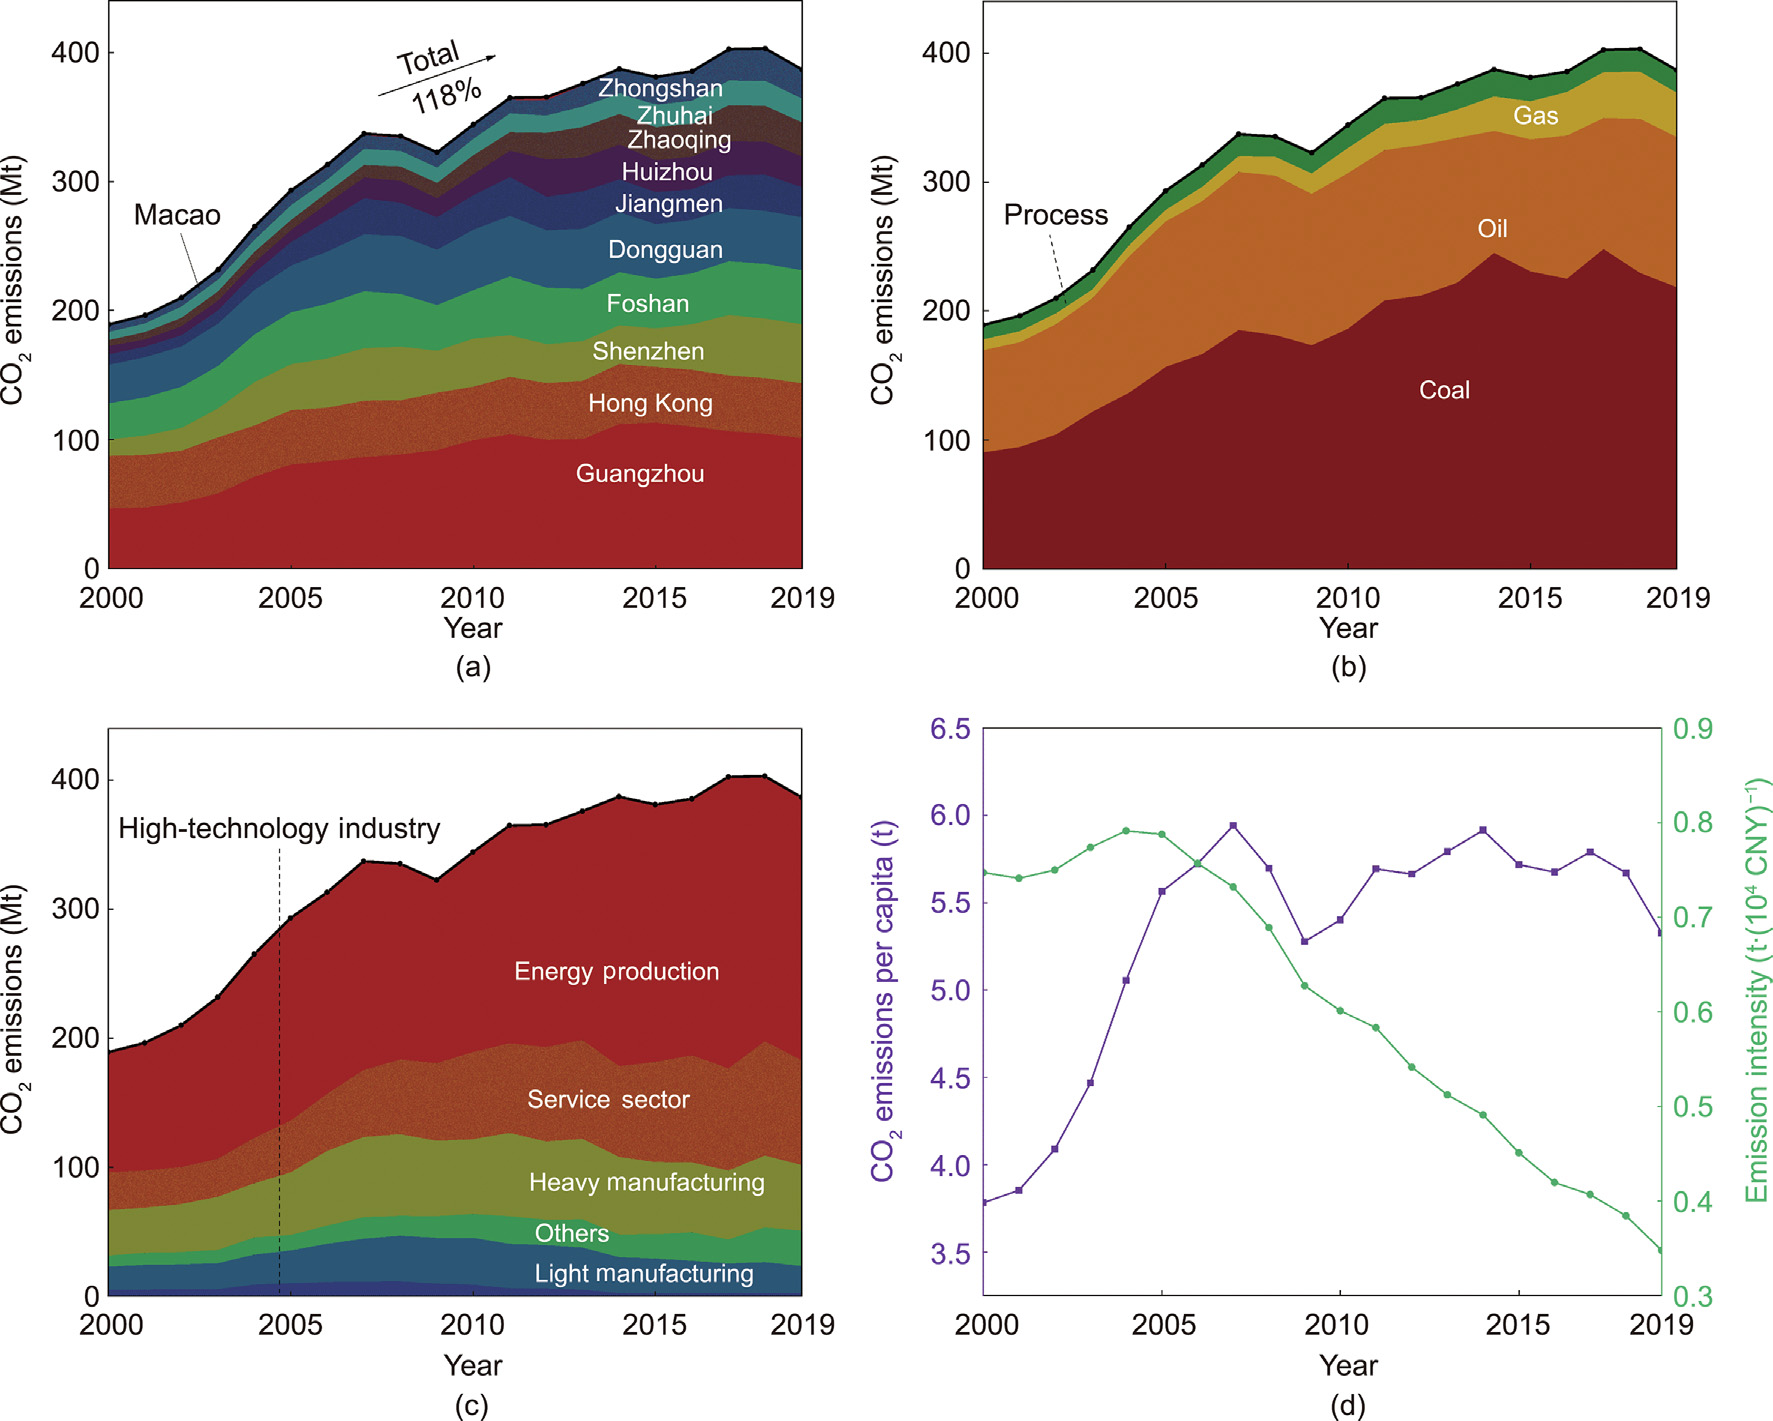
Fig. 1. CO2 emissions trends in the GBA: (a) CO2 emissions of GBA cities; (b) CO2 emissions by energy types; (c) CO2 emissions by sectors; and (d) CO2 emission per capita and emission intensity of the GBA.
《Fig. 2》
Fig. 2. CO2 emissions and economic growth of GBA cities.
The GBA’s reliance on coal remained strong, and coal-related CO2 emissions accounted for 56% in 2019 (Fig. 1(b)). The share of oil-related and process-related CO2 emissions continued to decline from 42% and 6% in 2000 to 30% and 5% in 2019, respectively, and the share of natural gas-related CO2 emissions increased from 4% in 2000 to 9% in 2019. After strong efforts in the 13th Five-Year Plan to eliminate backward production capacity and adjust the energy structure, the energy structure of the GBA remained uneven in 2019. The low-carbon transformation of energy in the GBA requires comprehensive efforts in various areas, such as energy technology, energy layout, and clean energy utilization.
The energy production sector is the main CO2-emitting sector in the GBA, accounting for 53% of the CO2 emissions in 2019, with production of electricity and steam accounting for 51% of the GBA’s CO2 emissions (Fig. 1(c)). CO2 emissions from the service sector continue to rise, overtaking heavy industries as the secondlargest CO2 emitter in 2010 and contributing 21% of the GBA’s CO2 emissions in 2019. Transport was the largest contributor to CO2 emissions in the service sector (18% of the GBA total in 2019). Heavy industry was the third-largest contributor to CO2 emissions (13%). The industrial value-added of PRD cities accounted for more than 93% of the GBA in 2019, in which advanced manufacturing (i.e., computers, communication, and other electronic equipment manufacturing; electrical machinery and equipment manufacturing; and automobile manufacturing) accounted for 42% of the industrial value-added of the GBA and generated 1% of its industrial CO2 emissions. The industrial transformation and upgrading effects of the GBA are remarkable, and industrial development patterns have been formed with high-end manufacturing industries represented by dominant industries, such as electronics, electrical, automotive, and general equipment manufacturing. CO2 emissions from traditional manufacturing industries (i.e., electricity, heat production and supply, metal products, chemical raw materials, and chemical products manufacturing) accounted for 72% of the CO2 emissions in the GBA. More attention should be paid to accelerating the electrification of the energy consumption sector and the transformation and upgrading of the petrochemical and metal product industries.
As shown in Fig. 1(d), per capita CO2 emissions in the GBA experienced a dramatic increase from 2000 to 2007, peaked at 5.9 t in 2007, and then declined slowly to 5.3 t in 2019, which was 76% of the national average [66]. The CO2 emission intensity of the GBA fell by 53% over 19 years, reaching 0.35 t·(104 CNY)–1 by 2019. The carbon intensity of the GBA (0.25 kg CO2 per 2012 US dollar purchasing power parity) was less than three-fifths of the national average in 2018 [66], 1.7 times higher than that of California (0.15), and two times higher than that of New York (0.12) in the same year [67], and there is still a gap with the international bay areas. The deployment of industrial structure upgrades in the GBA should be further accelerated.
《4.2. Drivers of CO2 emissions in the GBA》
4.2. Drivers of CO2 emissions in the GBA
4.2.1. Key factors
To facilitate the discussion regarding the driving factors contributing to GBA’s energy-related CO2 emissions, the results from 2001 to 2019 were subdivided into six three-year periods. The economic growth was the main driver of the increase in the GBA’s CO2 emissions (Fig. 3, red bars). Since China gained access to the World Trade Organization in 2001, GBA cities have served to transfer production capacity for labor-intensive industries in East Asia. Industrialization has driven the rapid growth of the GDP in the GBA, and the scale effect of economic development has driven a significant rise in CO2 emissions. With the development mode of ‘‘front shop and back factory” in the GBA, the manufacturing industry has become highly dependent on foreign direct investment. The global financial crisis in 2007–2008 weakened the scale effect of economic development in the GBA, and the contribution of economic growth to CO2 emissions decreased by 10% from 2007 to 2010. After 2010, the GBA gradually recovered from the global financial crisis, and the positive contribution of economic growth to CO2 emissions increased slightly but was smaller than before the crisis. The national ‘‘12th Five-Year Plan” (2010–2015) [68] further deepened the goal of low-carbon development, with goals including an increase in the technological content of economic growth, reducing energy consumption and CO2 emissions per unit of GDP, and pursuing high-quality economic development [69]. After 2013, GBA cities entered a new phase of economic development, weakening the drivers of economic growth. After integrating the contribution of economic growth to CO2 emissions in the six periods, it was found that economic scale, national and regional policies, and the international financial environment directly affected the CO2 emissions of the GBA.
The fuel quality in the decomposition analysis reflected the changes in the fuel carbon content upgrades of the GBA. The results showed that the fuel quality always curbed the increase in the GBA’s CO2 emissions (Fig. 3, blue bars), mainly owing to the guidance and control of a series of policy measures, such as the phaseout treatment of industrial boilers and small thermal power units. Since 2000, GBA cities have successively shut down industrial boilers with high energy consumption and pollution. The outline of the environmental protection plan for the Pearl River Delta (2004–2020) proposed that all small thermal power plants with capacities below 50 000 kW would be shut down by the end of 2005, and desulfurization treatment of coal-fired and oil-fired power plants above 125 MW would be completed by 2007 [70]. These measures enabled fuel quality to curb 26.3% of the growth in the CO2 emissions of the GBA between 2004 and 2007. Large power generation units, such as the Foshan Sanshui Hengyi Power Plant (1200 MW), were commissioned in 2011. The GBA replaced small, inefficient, and highly polluting thermal power plants with large-capacity, high-parameter, low-consumption, and low-emission units to significantly improve fuel quality. Through continued phasing out of small thermal power units and industrial boilers, the fuel quality in the GBA has reached a high level and the potential of carbon emissions reduction is narrowing.
《Fig. 3》
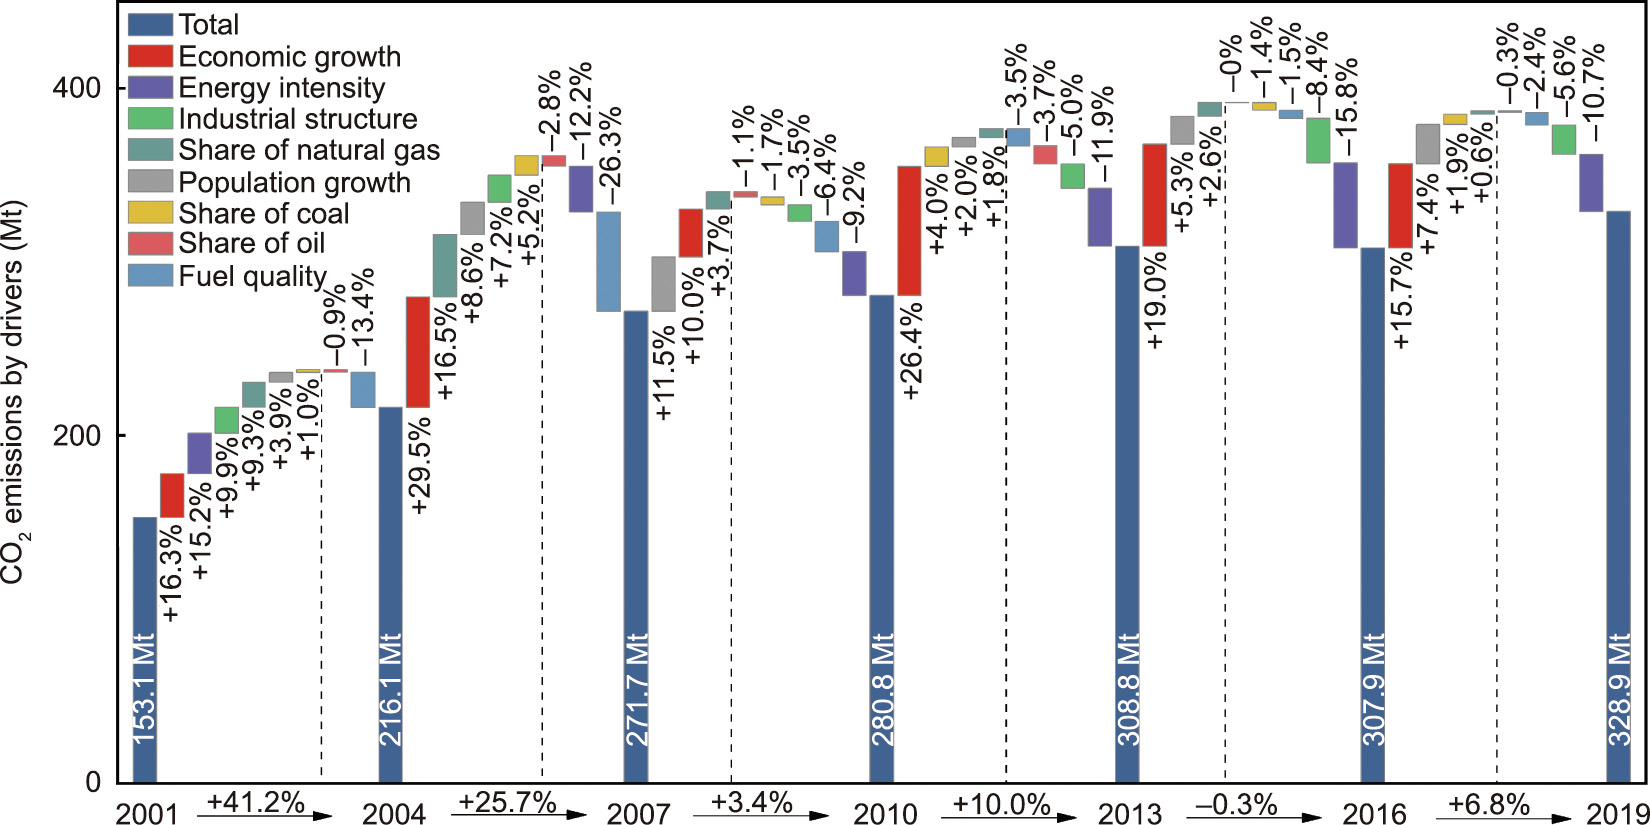
Fig. 3. Contributions of socioeconomic factors to the changes in the GBA’s energy-related CO2 emissions in the periods 2001–2004, 2004–2007, 2007–2010, 2010–2013, 2013–2016, and 2016–2019.
The energy intensity greatly hindered CO2 growth in the GBA (Fig. 3, purple bars). With the use of clean energy, the popularization of new power generation technologies, and the implementation of the ‘‘developing large electric generating sets and suppressing small ones” and ‘‘oil-to-gas” policies [71], the energy intensity of the energy production sector in GBA cities, such as Guangzhou and Shenzhen, was greatly reduced from 2001 to 2019. The energy intensity of the high-technology industries and service sectors, mainly in Guangzhou and Shenzhen, has significantly suppressed the GBA’s CO2 emissions since 2007. The energy intensity of these two sectors reduced CO2 emissions by 8.9 and 48.1 Mt, respectively, from 2007 to 2019. Accelerating the transformation and upgrading of industries in the GBA and the development of high-technology industries and service sectors can significantly curb the increase in CO2 emissions.
The energy structure of the GBA is gradually being optimized, and its contribution to CO2 emissions is diminishing. The implementation of policies such as ‘‘oil-to-gas” has led to a continued decline in oil as a component of industrial primary energy consumption, while the consumption of natural gas continues to increase. After the first pilot project of imported liquefied natural gas (LNG) in China (Guangdong Dapeng LNG receiving station and Zhuhai Hengqin Island offshore gas receiving station project) began in 2006, a multi-source gas supply pattern of coastal imported LNG, onshore long-distance pipeline gas, and offshore gas was formed, and a gas pipeline network covering major PRD cities was built. Following the completion of the West–East Gas Pipeline II and its connection to Guangdong in 2010, the share of natural gas in Guangdong’s primary energy consumption reached 7.8% in 2013, two percentage points higher than the national average. It is worth noting that Hong Kong and Shenzhen were the first to shift their energy mix before the completion of West–East Gas Pipeline II. The increase in the share of natural gas consumption drove an increase of 16.5% and 3.7% in CO2 emissions in the GBA in the second and third phases, respectively. Further strengthening the leading role of Hong Kong and Shenzhen in the transformation of the energy mix in the GBA, accelerating the promotion of new energy technologies, and reducing reliance on coal consumption in Guangzhou and Foshan will help accelerate the decline of CO2 emissions in the GBA.
The industrial structure mainly inhibited CO2 emissions in the GBA (Fig. 3, green bars). During 2001–2007, policies of ‘‘developing large electric generating sets and suppressing small ones” and ‘‘oilto-gas” were gradually implemented. The share of value-added in electricity and heat production and supply, plus oil and gas extraction, increased slightly, resulting in an industrial structure that increased CO2 emissions in the GBA by 9.9% (2001–2004) and 7.2% (2004–2007) (Fig. S1 in Appendix A). GBA cities shut down small-capacity thermal power units by 2009, allowing the valueadded share of the energy production sector to drop significantly and curbing the effect of that sector on CO2 emissions. In the period 2007–2010, a double transfer strategy was proposed, and the labor-intensive industries of the GBA were gradually transferred to the mountainous areas of northern Guangdong and eastern and western Guangdong. The cities cooperated to establish industrial parks, such as Zhaoqing Dawang Industries Relocation Industrial Park (metal materials and electronics industries) and Guangzhou (Qingyuan) Industries Relocation Industrial Park, to support the development of biomedical industries, advanced machinery, and equipment manufacturing. After 2013, the contribution of the energy production sector continued to decrease, and the service sector developed into the main sector that increased the GBA’s CO2 emissions. Shenzhen has deepened the ‘‘industry–academia–research” development model, accelerating the rapid development of the service and high-tech industries in the GBA. The transformation and upgrading of traditional industries in the GBA should be accelerated into modern service industries (i.e., logistics, conventions and exhibitions, finance, tourism, and information) and technology- and knowledge-intensive industries (i.e., the electronic information industry and advanced equipment manufacturing) to give full play to the role of the industrial structure in promoting low-carbon development. As population growth continues to drive the increase in CO2 emissions in the GBA (Fig. 3, gray bars), increasing employment in knowledgeintensive and modern service industries can be used to reduce the contribution of population growth to CO2 emissions.
4.2.2. Key cities
To further discuss the contributions of cities to the GBA’s CO2 emissions between 2016 and 2019, six CO2 emission drivers were decomposed by city (Table S4 in Appendix A). Fig. 4 showed that growth in CO2 emissions was not entirely determined by GDP growth. Shenzhen ranked seventh in terms of economic growth contribution to CO2 in the GBA during 2016–2019 (the top contributor was Guangzhou), its GDP growth rate (30%) ranked first in the GBA. The industrial structure was one of the key factors curbing the GBA’s CO2 emissions during the period 2016–2019. The industrial structures of Dongguan, Guangzhou, and Foshan had the strongest inhibitory effects on the growth of CO2 emissions. Dongguan vigorously promoted industrial restructuring, eliminating backward production capacity in coal power, paper, iron and steel, flat glass, and aluminum smelting. During the ‘‘13th Five-Year Plan” period, the electronic information manufacturing industry’s revenue in Dongguan exceeded one trillion CNY, constituting half of the city’s total industrial output value. New industries, such as high-end electronic information, solar photovoltaics, intelligent equipment, and new energy vehicles, are rapidly increasing. The tertiary industry’s average contribution to the GDP growth for Guangzhou was 74% from 2016 to 2019. The advanced manufacturing industries in Guangzhou played a leading role. The industrial development of Guangzhou has resulted in industrial clusters (i.e., automobile, electronics, petrochemical, and electric power and heat manufacturing) with output values exceeding 100 billion CNY, and service clusters (wholesale and retail, real estate, finance, information services, and transportation) with an added value exceeding 100 billion CNY. The proportion of added value of Foshan’s advanced manufacturing industry in the abovescale industry increased from 35.6% to 50.2%. The industrial restructuring of Dongguan, Guangzhou and Foshan reduced CO2 emissions in the GBA by 22.4 Mt from 2016 to 2019, while Zhongshan, Jiangmen, and Huizhou drove a 9.2 Mt increase in CO2 emissions; therefore, their industrial restructuring and upgrading should be accelerated. Foshan’s energy consumption in the nonmetallic mineral products sector was reduced owing to the relocation of part of its ceramics industry to Zhaoqing, which effectively curbed CO2 emissions in the GBA.
《Fig. 4》
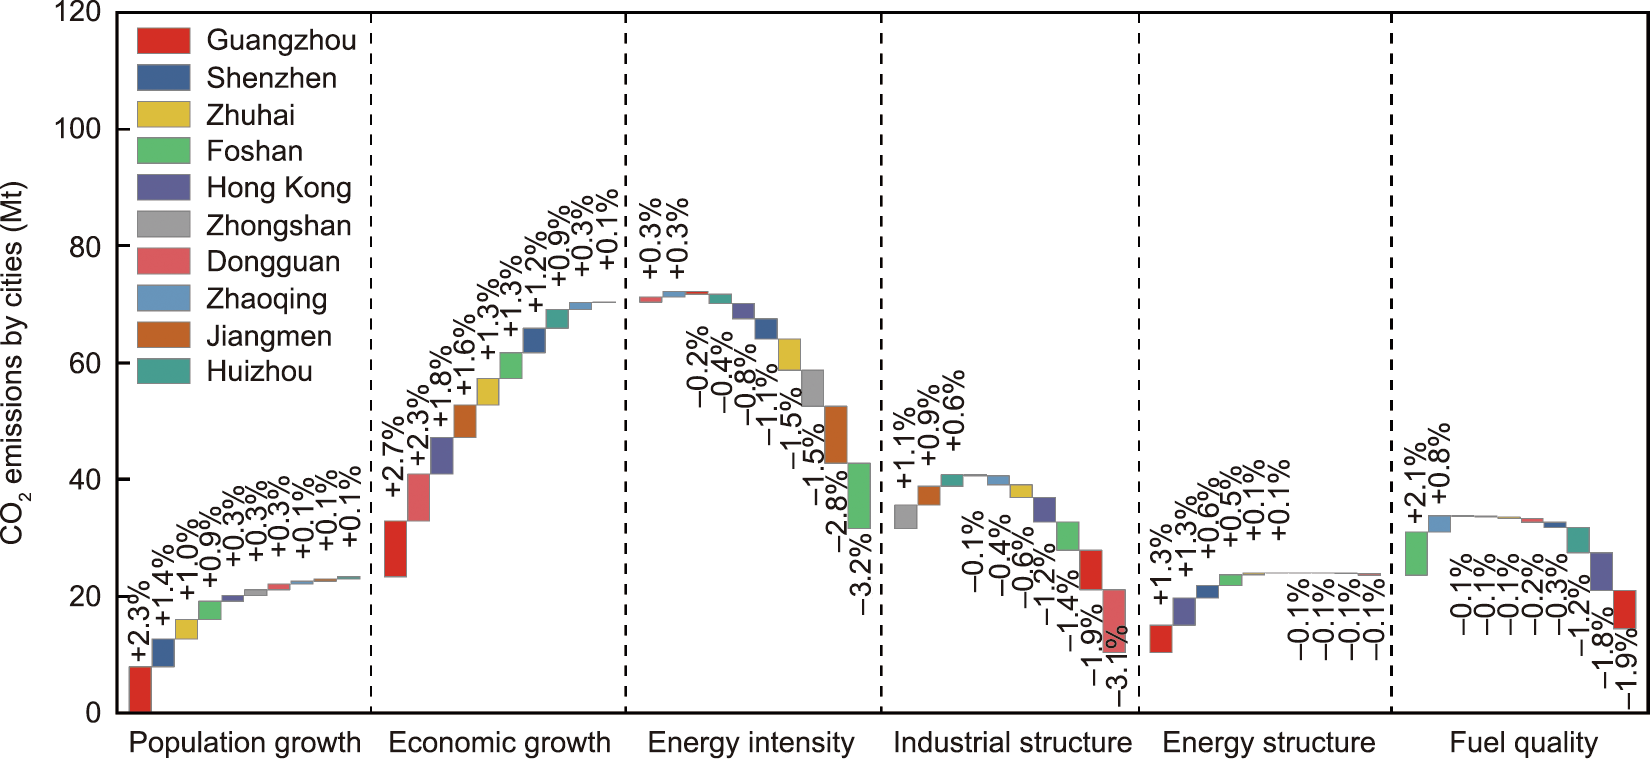
Fig. 4. Contributions of cities to GBA’s energy-related CO2 emissions in the period 2016–2019.
《5. Mitigation of CO2 emissions in the GBA》
5. Mitigation of CO2 emissions in the GBA
The uneven regional development and differences in CO2 emissions of GBA cities significantly increase the complexity of lowcarbon roadmap formulation. To explore tailor-made emission reduction strategies, we analyzed the contribution of various sectors to CO2 emissions in each city of the GBA in 2019 (Fig. 5) and their industry value-added share (Table S5 in Appendix A). The results showed that the GBA gradually formed the gradient development pattern of Guangzhou–Hong Kong–Shenzhen–Macao, Foshan–Dongguan, Zhuhai–Huizhou–Zhongshan, and Zhaoqing– Jiangmen. Guangzhou, Shenzhen, and Hong Kong played major roles in the GBA’s CO2 emissions, accounting for 49% of the area’s CO2 emissions. Their service sectors accounted for 75% of the CO2 emissions of the GBA service sector, with the transport sector accounting for 64%. Changes in CO2 emissions are sensitive to the transport sector, and the energy intensity of the transport sector can be lessened by reducing its dependence on oil consumption. The energy production sector of Guangzhou and Hong Kong contributed 44% of the CO2 emissions of the GBA energy production sector.
《Fig. 5》
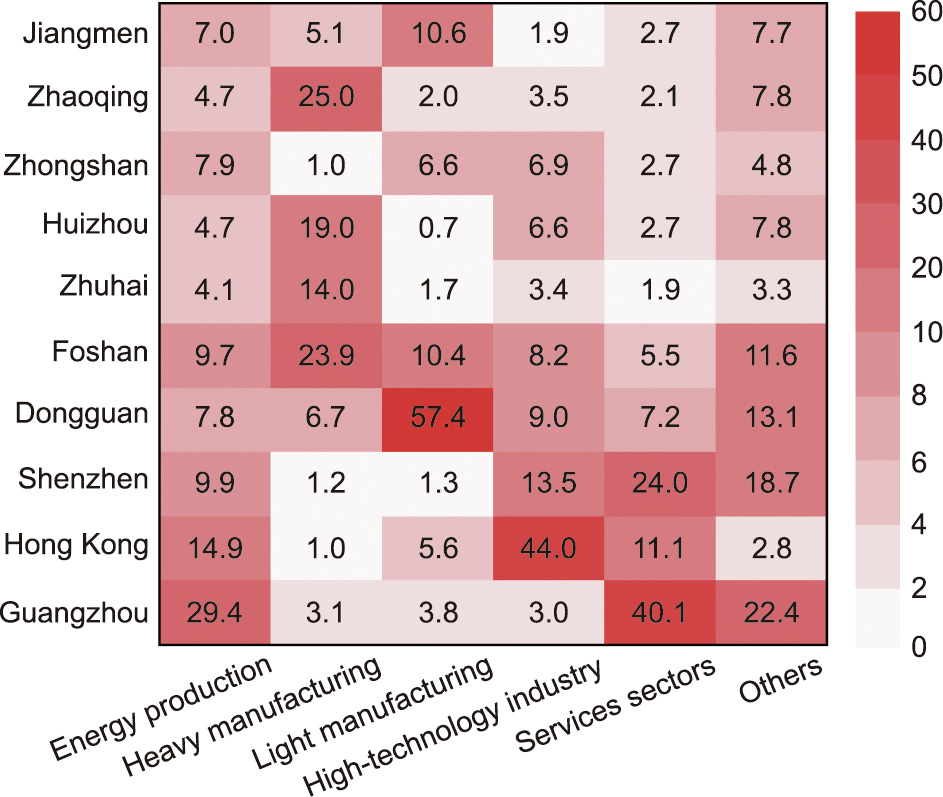
Fig. 5. Contributions (%) of various sectors of cities in the GBA to CO2 emissions in 2019.
Automobile manufacturing, electronic product manufacturing, and petrochemical manufacturing are the three pillar industries in Guangzhou, whereas biomedicine, aerospace manufacturing, information technology, and the financial industry are experiencing rapid development. Achieving energy savings and emission reductions in traditional pillar industries, leading to the development of new-generation industries and radiating related industries in neighboring cities, is the goal of Guangzhou’s future industrial development. Shenzhen transformed its traditional manufacturing industry into an advanced manufacturing industry. With the information technology industry as the core industry, Shenzhen has experienced rapid development of its advanced manufacturing industries, such as equipment manufacturing, medical devices, pharmaceuticals, and new materials, and corporate cooperation and technical support are the main modes of development for Shenzhen to drive other cities in the GBA.
Foshan and Dongguan are important drivers of future manufacturing development and economic growth in the GBA and the main contributors in terms of the GBA’s CO2 emissions by heavy manufacturing and light manufacturing, accounting for 24% and 57%, respectively. Foshan’s non-metallic mineral products industry accounted for 18% of the heavy-industry CO2 emissions in the GBA, and Dongguan’s papermaking and paper products industry accounted for 52% of the light-industry CO2 emissions in the GBA. In the process of building an ‘‘international manufacturing innovation center” in Foshan and an ‘‘international manufacturing center” in Dongguan, the CO2 emissions from the non-metallic mineral products industry and the paper and paper products industry should be effectively controlled. Foshan’s high-end electronic information and new energy automobile industries (relocated from Guangzhou), Dongguan’s information technology (relocated from Shenzhen), and electrical machinery and equipment manufacturing have become new-generation pillar industries. With the complete manufacturing industry system, the industrial CO2 emissions of Dongguan and Foshan can be further reduced through industrial structure optimization and adjustment.
By contrast, the scale of industrial development in Zhuhai, Huizhou, and Zhongshan has been small, with the CO2 emissions of the three cities accounting for only 15% of the GBA total. Zhuhai has electric power and energy industry, biomedical industry, petrochemical industry, home appliance and electrical industry, precision machinery manufacturing industry, and electronic information industry as its pillar industries. The energy consumption of traditional industries such as electricity production and petrochemical processing in Zhuhai can be replaced with clean energy (i.e., LNG and offshore wind power), to achieve city’s lowcarbon development. As one of the two major petrochemical processing bases in Guangdong Province, Huizhou accounted for 73% of the added value of the petroleum-processing industry in the PRD in 2019. Building green industrial parks, promoting the circular economy, and developing decarbonization technologies (i.e., carbon capture, utilization, and sequestration (CCUS)) are the focus of CO2 emission reduction in Huizhou’s petrochemical industry. As a member of the Shenzhen metropolitan area, Huizhou has sufficient land bearing capacity and conditions to launch advanced manufacturing industries in Shenzhen and Dongguan. Zhongshan’s pillar industries are dominated by traditional manufacturing industries, such as textiles and garments, furniture manufacturing, and metal products, and are transforming into high-tech advanced manufacturing industries (i.e., pharmaceuticals, electronics, computers, and instrumentation manufacturing). However, the size of the advanced manufacturing industries is still small.
Among the cities that are lagging in economic development in the GBA, Zhaoqing and Jiangmen have the highest percentage of value-added in the primary industry among the cities in the GBA. Zhaoqing is the commodity food base of Guangdong Province and provides agricultural products to other cities in the GBA, with the value added by the primary industry reaching 17%. Dominated by nonmetal mineral products, Zhaoqing faces great pressure to reduce emissions, with traditional industrial CO2 emissions accounting for over 80% of its emissions. Zhaoqing could strengthen the division of labor and cooperation with Guangzhou and Foshan, and attract Guangzhou and Foshan’s new energy automobiles, advanced equipment manufacturing, biomedical industry, and other industries to create advantageous industries. Jiangmen’s transportation equipment manufacturing industry has taken shape, and rail transportation and heavy trucks are well developed and can replace traditional industries in the future.
Given the spatial heterogeneity and differences in economic development, industrial structure, and energy resource allocation, the differentiated emission reduction strategies for GBA cities can be summarized as follows: Guangzhou, Hong Kong, and Shenzhen have achieved absolute decoupling of economic growth from CO2 emissions in recent years (Fig. 2). These cities have developed modern service industries and led to the transformation and upgradation of high-tech, knowledge-intensive industries. In the future, they should vigorously develop green transportation, increase transport electrification, and accelerate the building of a green Internet of Things to control the growth of CO2 emissions in the service sector. The energy structure of Guangzhou and Hong Kong need to be optimized to promote low-carbon energy transition. Foshan and Dongguan need to accelerate the transformation and upgrading of traditional to advanced manufacturing industries and build green industrial systems. By developing new energy, promoting industrial clean energy alternatives, developing a circular economy, and realizing industrial ecology, CO2 emissions of Foshan and Dongguan could be further reduced. Zhuhai, Huizhou, and Zhongshan should prioritize the development of green technologies (i.e., offshore wind power and CCUS) and high-tech advanced manufacturing industries (i.e., electronic information and biomedicine). Zhaoqing and Jiangmen should accelerate the decarbonization of traditional industries and eliminate backward processes while pursuing new energy vehicles and advanced equipment manufacturing in Guangzhou, Shenzhen, and Foshan. As national and provincial low-carbon pilot cities, Shenzhen, Guangzhou, Zhuhai, and Zhongshan should promote green consumption and lowcarbon lifestyles by zero-carbon communities to force the lowcarbon transformation of the industry. Differentiated low-carbon development strategies of GBA cities could provide references for formulating roadmaps of the carbon peaking and neutrality of the GBA and exploring replicable and scalable carbon neutrality pathways.
《6. Conclusions and policy recommendations》
6. Conclusions and policy recommendations
As a highly open, economically dynamic, and innovation-driven region in China, the GBA aims to build a world-class city cluster with advantages in achieving peak carbon and carbon neutrality ahead of the national target. To explore the successful experience of low-carbon development in the GBA and replicable pathways to carbon neutrality, this study compiled inventories of CO2 emissions in the GBA (2000–2019) and analyzed the contributions of key factors, cities, and sectors to CO2 emissions. The trends of the GBA’s CO2 emissions were analyzed, changes in the various drivers were discussed, and differentiated emission reduction strategies in cities and sectors of the GBA were identified.
Based on results analysis, the following findings can be drawn: ① The low-carbon development of the GBA achieved remarkable results. The CO2 emissions of GBA cities slowed gradually and decoupled from GDP growth. The GBA is currently at the forefront of low-carbon development in the country. Its CO2 emission intensity was below three-fifths of the national level in 2019, but two times higher than that of California and New York. There is still a gap with the international bay areas. ② Economic growth was the main factor driving CO2 emissions and its contribution has weakened. Energy intensity has greatly dampened the increase in GBA emissions. Low-carbon development has been gradually achieved through industrial restructuring and upgrading. Industrial upgrades in Shenzhen and Hong Kong and technological advances in Shenzhen, Guangzhou, and Foshan have significantly curbed the growth of CO2 emissions in the GBA. ③ Gradient emission reduction strategies for Guangzhou–Hong Kong–Shenzhen– Macao, Foshan–Dongguan, Zhuhai–Huizhou–Zhongshan, and Zhaoqing–Jiangmen are proposed. Guangzhou, Shenzhen, and Hong Kong are dominated by the service sector and high-tech industries, and their emission reductions mainly lie in the transport sector. The CO2 emissions of GBA energy production sector mainly came from Guangzhou and Hong Kong. Their energy structures need to be further optimized to promote low-carbon energy transition. The non-metallic mineral products industry in Foshan and the paper and paper products industry in Dongguan contribute significantly to the GBA’s CO2 emissions, and the transformation of traditional manufacturing to advanced manufacturing and the green industry are key to low-carbon development. Zhuhai, Huizhou, and Zhongshan should expand the scale of industrial development and actively accepted the relocated industries such as electronic information and biomedicine from Shenzhen and Guangzhou. Zhaoqing and Jiangmen are the cities receiving relocated industries from other cities in the GBA, and heavy manufacturing and energy production industry are the biggest contributors to their CO2 emissions respectively, which should be prioritized to eliminate outdated processes and accelerate the decarbonization of traditional industries. Service-based cities should promote green consumption and low-carbon lifestyles by zero-carbon communities to force the low-carbon transformation of the industry.
The following suggestions are made for achieving carbon peaking and neutrality in the GBA. First, new energy technologies need to be developed vigorously to optimize the energy structure and accelerate the energy transition. The GBA currently has a large power supply gap, with a poor endowment of renewable resources and a limited scale of new nuclear power. Medium- and long-term energy transition policies and a technology roadmap for the GBA should be drawn based on a non-electricity supply technology pattern, with photovoltaic and energy storage as the main sources of electricity supply and coexisting hydrogen and carbon capture. Investment in technologies such as power grids, energy storage, and hydrogen energy would promote the large-scale application of new energy technologies.
Second, industrial transformation and upgrading can be accelerated by carbon labels and carbon emission trading. Traditional high-energy-consuming industries within the GBA account for a high proportion of industrial value added above the scale, and there is a need to accelerate the green and low-carbon transformation and upgrading of traditional industries. The development of high-tech and productive service industries must be accelerated to promote industrial structure adjustment and upgrading, promote industrial chain reengineering and value chain upgrading, and reduce the proportion of high-energy-consuming industries. The energy-saving and emission reduction standards at the product level of traditional high-energy-consuming industries could enhance energy efficiency benchmarking, low-carbon products, and carbon label certification, and make use of the existing market carbon reduction mechanisms, such as the Guangdong and Shenzhen carbon markets, to force the low-carbon transformation and development of enterprises in high-energy-consuming industries in the GBA.
Third, regional synergy and green development must be strengthened. Full reign should be given to the leading and overflowing roles of the three central cities of Hong Kong, Guangzhou, and Shenzhen in modern service industries and advanced manufacturing. This will allow China to utilize the advantages of scientific research and development, industrial innovation, and academic research in the three cities to strengthen basic scientific research in energy efficiency and other areas, strengthen technical support, and release the carbon reduction potential. Zhongshan, Zhaoqing, and Jiangmen should accept relocated high-tech and other high value-added industries. A situation in which cities in the GBA develop in a staggered manner and have complementary industrial clusters must be prioritized.
Fourth, there is a need to develop targeted emission reduction programs for key factors and industries in key cities in the GBA. Guangzhou, Shenzhen, and Hong Kong are transforming and upgrading to technology and knowledge-intensive industries, and further reducing their reliance on oil consumption for the development of service sectors, such as transportation, retail, accommodation, and catering. Dongguan and Foshan have further accelerated their transformation and upgrading of traditional industries to technology and technology-intensive hightech industries, while Zhuhai, Huizhou, and Zhongshan have expanded the scale of industrial development and accepted relocated industries of Shenzhen and Guangzhou (i.e., electronic information, biomedical manufacturing, and other hightechnology industries). Zhaoqing and Jiangmen accelerated the transformation of high-energy-consuming and high-polluting enterprises and vigorously promoted the deepening and extension of industrial and value chains from low-end links to highend products, high-end elements, and high-end services. Giving full reign to the role of the industrial structure will curb the growth of carbon dioxide emissions in the GBA and promote its development into a world-class city cluster with ecological safety, environmental beauty, and vitality.
Fifth, existing regulations and policies should be improved. CO2 emission statistics and accounting need to be further improved, especially when it comes to implementing the responsibility of each department for statistical accounting and data quality management (i.e., authenticity, accuracy, and traceability). Policies should make synergistic control of pollutants and GHG emissions a guiding principle. Amendments will need to be made to the Environmental Protection Law of PRC, Environmental Impact Assessment Law of PRC, and other relevant regulations and policies as soon as possible, and carbon emission need to be integrated into environmental impact assessment framework.
The lack of energy consumption data resulted in missing emission inventories for individual years in some cities, leading to uncertainty in the results. For example, owing to a lack of detailed energy data, we were unable to compile emission inventories for Hong Kong and Macao, which made it impossible to maintain consistency in the emission inventories of the GBA. The lack of energy consumption data for Dongguan before 2016 prevented its inclusion in the overall analysis of carbon emissions. Due to the lack of time-series CO2 emission factors for importing electricity from the Guangdong power grid and the export electricity of the regional power grid, indirect CO2 emissions were excluded outside of the city boundaries. The uncertainty of the results affects the accurate quantification of emission mitigation liabilities. Further research should focus on investigations to improve the data quality, and emissions from Scope 2 (emissions from purchased electricity and heat consumption) should be incorporated into the framework. A multi-criteria decision analysis should be applied to identify cost-effective emission reduction pathways and assess the synergistic benefits of emission reduction in the GBA city cluster. This will help explore the role and potential of regional cooperation in reducing emissions for cities in the GBA and along the Belt and Road.
《Acknowledgments》
Acknowledgments
This work was supported by the Consultative and Research Project of the Chinese Academy of Engineering (2020-XY-19 and 2019-ZD-34), the Guangdong Basic and Applied Basic Research Foundation (2020A1515011230), and the Humanities and Social Science Foundation of the Ministry of Education of China (16YJCZH162). We acknowledge Xuanhao Huang and Weijian Chen for the data contributions.
《Compliance with ethics guidelines》
Compliance with ethics guidelines
Ya Zhou, Kejun Li, Sheng Liang, Xuelan Zeng, Yanpeng Cai, Jing Meng, Yuli Shan, Dabo Guan, and Zhifeng Yang declare that they have no conflict of interest or financial conflicts to disclose.
《Appendix A. Supplementary data》
Appendix A. Supplementary data
Supplementary data to this article can be found online at https://doi.org/10.1016/j.eng.2022.03.017.


 京公网安备 11010502051620号


