

《1.Introduction》
1.Introduction
Exponential population growth and urbanization has given rise to the construction of cities of immense complexity; however, the rapid growth has outpaced intelligent system design, resulting in a lack of well-performing, robust infrastructure and subsequent degradation of water and air quality. At present, over half of Earth’s population lives in cities, with projections of urban migration increasing urban population distribution to over 65% by 2050 [1]. With this increasing urbanization comes an increased need for sustainable infrastructure that will meet current and future demand. The relationship of energy and material use to infrastructure can be examined using the concept of urban metabolism, which is defined by industrial ecologists as ‘‘the sum total of the technical and socio-economic processes that occur in cities, resulting in growth, production of energy, and elimination of waste” [2]. While studying the interactions of natural and human-centered systems within and around cities, the establishment of an urban metabolism model can aid in the description and analysis of the material and energy distribution structures within these systems. In order to increase sustainability, cities must account for these flows by making structural adaptations that increase efficient, productive, and resilient exchanges of these material and energy streams.
Despite its focus on overall energy and material use, the concept of urban metabolism has been critiqued for using an inaccurate model because many characteristics of urban centers do not map clearly onto organisms, from which the concept of metabolism is derived [3]. However, urban systems are functionally equivalent to ecosystems in that the material and energy transferred between autonomous actors gives rise to system properties [3–5]. Thus, ecological techniques and approaches can lend insight regarding material and energy flows in urban systems.
Water comprises up to 90% of all material entering an urban system [6]. As a result, proper management of water infrastructure has the potential to dramatically change the overall impact of urban infrastructure. Low-impact development (LID) technologies offer one option for cities in terms of water infrastructure. LIDs include bioretention areas, green roofs, permeable pavement, and more. These technologies have been shown to help preserve the natural hydrology of an area while reducing stormwater runoff, increasing pollutant filtration, and reducing water consumption [7]. A number of studies have looked at the impacts of LIDs in residential areas [8–10].
Within the City of Atlanta, residential water usage accounts for 53% of the total water consumption [11]. This study aims to assess the possible impact of LID technologies implemented in residential zones in the City of Atlanta. Our focus is on the infrastructure surrounding the residences, so this study does not include an analysis of the city water infrastructure. This paper does not attempt to dictate or prescribe structural improvements to Atlanta’s urban water system, but rather provides supplemental analytical tools for evaluation and future exploration. This study expands upon the work done by Jeong et al. [12] by further analyzing those results using an ecological perspective. The ecological perspective provides a new tool for the analysis of this same technology and provides additional assessment of LIDs.
《2.Methods》
2.Methods
《2.1.Methodology》
2.1.Methodology
In order to fully assess Atlanta’s urban and peri-urban water system, the structure of the existing systems must first be defined. The flow paths from extraction to primary treatment, use, secondary treatment, and discharge are characteristic of traditional, unidirectional, or ‘‘cradle-to-grave” flow paths in a conventional municipal water system. Using information regarding home use, supply, and treatment paths along with information provided by the Metropolitan North Georgia Water Planning District, we composed a model to reflect the transfer of water to and from the City of Atlanta’s demand.
《2.2.Ecological analysis》
2.2.Ecological analysis
Ecologists have a number of metrics to characterize and compare ecosystems. These metrics aim to evaluate ecosystem health by analyzing both the structure of connectivity between actors and the ways in which material and energy flow within a given system. These metrics can be calculated by representing the system as a matrix in which the rows and columns are actors of the system. Interactions between the actors are shown by populating the matrix with structural interactions between various actors within the system, as well as with numerical values of the material flow between each actor [13]. The units of the flow are fungible, but they must be consistent within the matrix. Ecologists use a number of different metrics; in general, such metrics give insight into the ecosystem health, maturity, efficiency, and robustness, in addition to more specialized characteristics [14–19]. The metrics fall into two categories: structure-based and flow-based metrics. Structure-based metrics simply examine the connections between actors, with no associated numbers for the amount of the unit being transferred. Flow-based metrics take into account the quantity of units transferred, in addition to the existing structure. The structure matrix is expanded, and the 1s and 0s of the structure matrix are replaced with flow values. The metrics of interest in this paper are three structure-based metrics—cyclicity, generalization, and vulnerability—and three flow-based metrics—ascendency, development capacity, and robustness. Since Layton [4] provided a detailed description of these metrics and how they are calculated, we provide a brief description of each below.
Cyclicity describes the recycling connectivity and strength of the cycling within a system by quantifying the rate of cycling pathway proliferation as a function of path length [13]. This value can be 0, 1, or greater than 1. A value of 0 means that no cycling is present, a value of 1 means that there is a single cycle in the system, and a value greater than 1 means that there are multiple cycles throughout the system [18]. A median value for the cyclicity of a natural ecosystem is 4.24 [4]. Generalization is a measure of the average number of prey species consumed per predator in a system [14,15]. A median value for the generalization of a natural ecosystem is 6.18 [4]. Similarly, vulnerability is a measure of the average number of predators for every prey actor in a system [15]. A median value for the vulnerability of a natural ecosystem is 5.34 [4]. Ascendency describes the amount of material that a system distributes efficiently [16,17,19]. Development capacity is a measure of the potential of a system to improve, and acts as the upper bound for ascendency [19]. Ascendency divided by development capacity acts as a measure of the efficiency of the system. This value compares how the system actually performs with its upper potential. Finally, robustness describes the organizational constraints of a system compared with its redundancy [20], and is taken as a measure of the ability of a system to respond to perturbations that alter flows to or from particular system components.
This ecological methodology has been adapted and applied to human systems, allowing subsequent analysis using these metrics in an attempt to quantitatively assess human-made system fitness from an ecological perspective. It is important to note that we present the numerical values of the ecological metrics as a means of comparison to assess the trend of a system as it is modified based upon these specific values. The ecological model we present here uses average water volume flows over a year. Although this model is greatly simplified, it presents a high-level view of the system that still gives insight into the overall dynamics and critical factors.
《2.3.Water system analysis》
2.3.Water system analysis
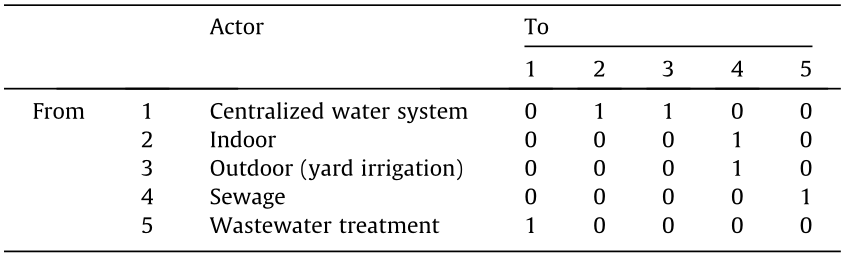
Using the data from Ref. [12], the impact of the LID technologies on the different residential zones within the City of Atlanta was analyzed by means of the ecological method discussed above. The residential zones are split into two main categories: singlefamily and multi-family residences. Single-family is denoted by ‘‘R” and multi-family is designated by ‘‘RG.” The single-family zones are split further based on lot size with the number following the ‘‘R” indicating the minimum lot size, where the smaller the number, the larger the lot size. The multi-family zones are split further based on the maximum floor area ratio, with a smaller number representing a smaller ratio [21]. Table 1 provides descriptions of the different residential zones analyzed. The LID technologies included xeriscaping, a bioretention area, and a rainwater catchment system. The overall system comprised five actors in the conventional system and six actors in the hybrid system as described in Ref. [12]. In both systems, the five actors were a centralized water treatment/distribution facility, the indoor water usage of the residence, the outdoor water usage of the residence, sewage system, and a wastewater treatment facility, as shown in Fig. 1, and the structure matrix is shown in Table 2. The hybrid system contained an additional actor (not shown in Fig. 1): a rainwater catchment system. These actors were placed in both the flow and structure matrices, and connections and flows were drawn between them. Table 3 shows a sample flow matrix using the R-1 residential zone.
《Table 1》
Table 1 Description of residential zones within the City of Atlanta[21].

a 1 acre = 4046.86 m2
《Fig. 1》

Fig.1.Flow diagram for conventional residential water system.Each actor is represented as a box,and the arrows between the actors represent connections between them.The direction of the arrow is the direction of flow.
《Table 2》
Table 2 Structure matrix for conventional water system.
《Table 3》
Table 3 R-1 conventional system flow matrix(unit:m3·a-1).
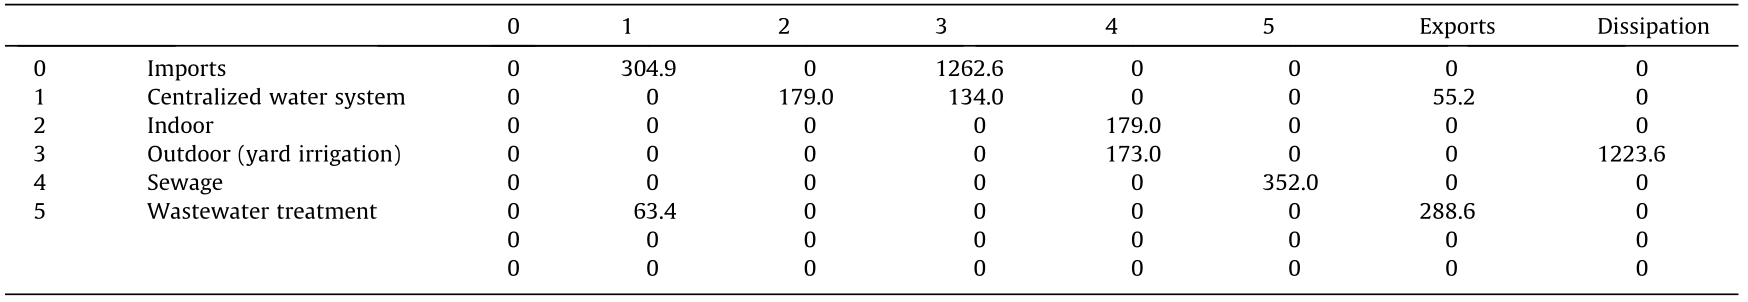
Water flows along each row from actors in the first column to actors in subsequent columns.
The City of Atlanta experiences an average water loss of 15%due to leakages and inefficiencies in the distribution of water from the centralized facility to residences[11].Meanwhile,18%of the water sent to the wastewater treatment facility is recycled back into the centralized system[11],which demonstrates a certain level of existing cycling within the present system.These percentages are accounted for in all of the residential zones.
Water flows to each residence from both rain and the central municipality.It is assumed that the majority of the water needed for outdoor irrigation comes from rain,and the rest of need of water coming into the system,each residential zone is normalized to 1000 m2 and multiplied by the annual rainfall for the City of Atlanta,which is 1.262 m[22].Over the course of the year,much of the total rainfall is underutilized due to impervious surfaces that do not absorb any water and to excess rainfall events,during which biomass is unable to retain all of the water.This excess is shown as an annual stormwater runoff number.In the hybrid system,the rain falling on residential zones is split into two flows:one that hits the yard and the other that hits impervious surfaces.It is assumed that the rain falling on impervious surfaces is where the captured rainfall is coming from.Not all of this rainfall is captured,so there is excess rainwater that enters the sewage system.
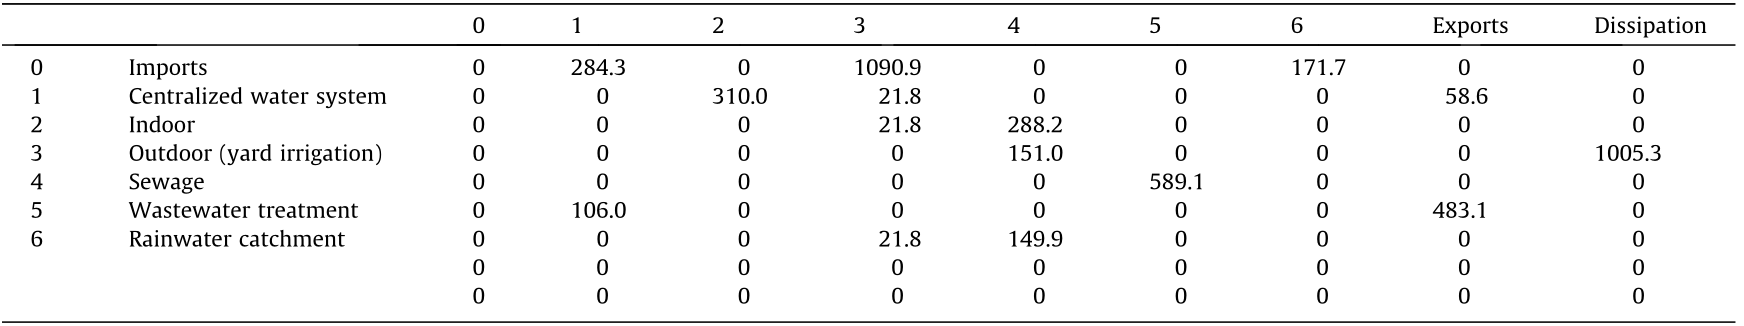
In addition to the hybrid system, an ideal case aims to maximize the ecological metrics by creating the maximum number of connections and distributing the flow evenly among those connections. In this way, no single actor is the majority provider of water. In this scenario, the water needed for irrigation is split evenly among centralized water, captured rainwater, and indoor graywater, in addition to the connections already established within the hybrid system. Table 4 shows an example of this updated ideal system, which can be compared with the conventional system portrayed in Table 3. Fig. 2 shows the updated flow diagram with the additional actor and additional connections drawn.
《Fig. 2》

Fig.2.Flow diagram for ideal residential water system.
《Table 4》
Table 4 R-3 ideal system flow matrix(unit:m3·a-1).
《3.Results and discussion》
3.Results and discussion
《3.1.Structure-based metric》
3.1.Structure-based metric
Cyclicity is the main structure-based metric analyzed here. Cycling is important because the more water can be recycled through the network, the less water must be taken from external sources such as lakes or rivers. Table 5 shows the calculated values for cyclicity for all scenarios and zones. All of the conventional systems have a cyclicity value of 1.189, meaning that there is cycling present in the system. A value greater than 1 means that there is more than one cycle present. The hybrid systems for R-1 and R-3 also have a cyclicity value of 1.189, while the other hybrid systems show a decrease in cyclicity to a value of 1. This decrease is due to a break in the connection between the outdoor irrigation actor and the centralized supply. In these residential zones, the outdoor usage is completely supplied by captured rainwater. In the ideal system, there is an increase in all zones to a value of 1.291. The increase here is due to an added connection between indoor and outdoor usage due to the graywater system.
《Table 5》
Table 5 Cyclicity of conventional,hybrid,and ideal systems for each residential zone.

The two other structure-based metrics analyzed are generalization and vulnerability. The conventional systems have a value of 1.2 for both of these values in all residential zones. For all of the hybrid systems, we see an increase in generalization to a value of 1.6 and an increase in vulnerability to a value of 1.33. The ideal systems show a further increase in these values, with two of the residential zones having a value of 1.8 for generalization and a value of 1.5 for vulnerability, and the remaining seven zones having a value of 2 for generalization and a value of 1.67 for vulnerability. As generalization and vulnerability relate to the number of predators and preys in a system in relation to the total number of actors, this increase indicates an increase in actor interaction; more specifically, there is a change in the inputs and outputs associated with the actors. The increase shows that one or more actors now ‘‘consume” (use water) additional actors (i.e., more ‘‘food” (water) sources are available in the network) and that one or more actors are now ‘‘consumed” by additional actors (i.e., more consumers of ‘‘food” are available in the network). There is a greater diversity of water sources for certain actors, which lessens dependency on any single source.
The total number of links only varies slightly between the conventional, hybrid, and ideal systems: six in the conventional systems, eight in the hybrid systems, and nine or ten in the ideal systems. This relatively large variance in the number of links shows the importance of each link, how critical each link is to the overall structure, and the impact slight changes can have on the ecological metrics. It also illustrates the role of the pattern of connections. The connections in the ideal systems are located in key places within the network, so the metrics change considerably compared with the conventional and hybrid systems. That said, these networks are much smaller than a typical ecosystem [4], so the addition of a single link has an exaggerated impact compared with a system with a greater number of actors.
《3.2.Flow-based metric》
3.2.Flow-based metric
The robustness, ascendency, and development capacity were calculated for each residential zone and each scenario using the flow-based metrics matrices created. As stated previously, the ascendency divided by the development capacity acts a measurement of efficiency. Table 6, Table 7, and Fig. 3 show these values. There is an inverse relationship between efficiency and robustness, as shown by the data here. As efficiency increases, robustness decreases, and vice versa. For the conventional systems, the efficiency ranges from 0.651 in R-1 to 0.739 in RG-5, while the robustness ranges from 0.403 in R-1 to 0.323 in RG-5. As population density increases from R-1 to RG-5, the efficiency tends to increase, although it does not follow a linear trend. Similarly, as the population density increases, the robustness generally decreases.
《Table 6》
Table 6 Robustness of conventional,hybrid,and ideal systems for each residential zone.

《Table 7》
Table 7 Ratio of ascendency over development capacity of conventional,hybrid,and ideal systems for each residential zone.

《Fig. 3》
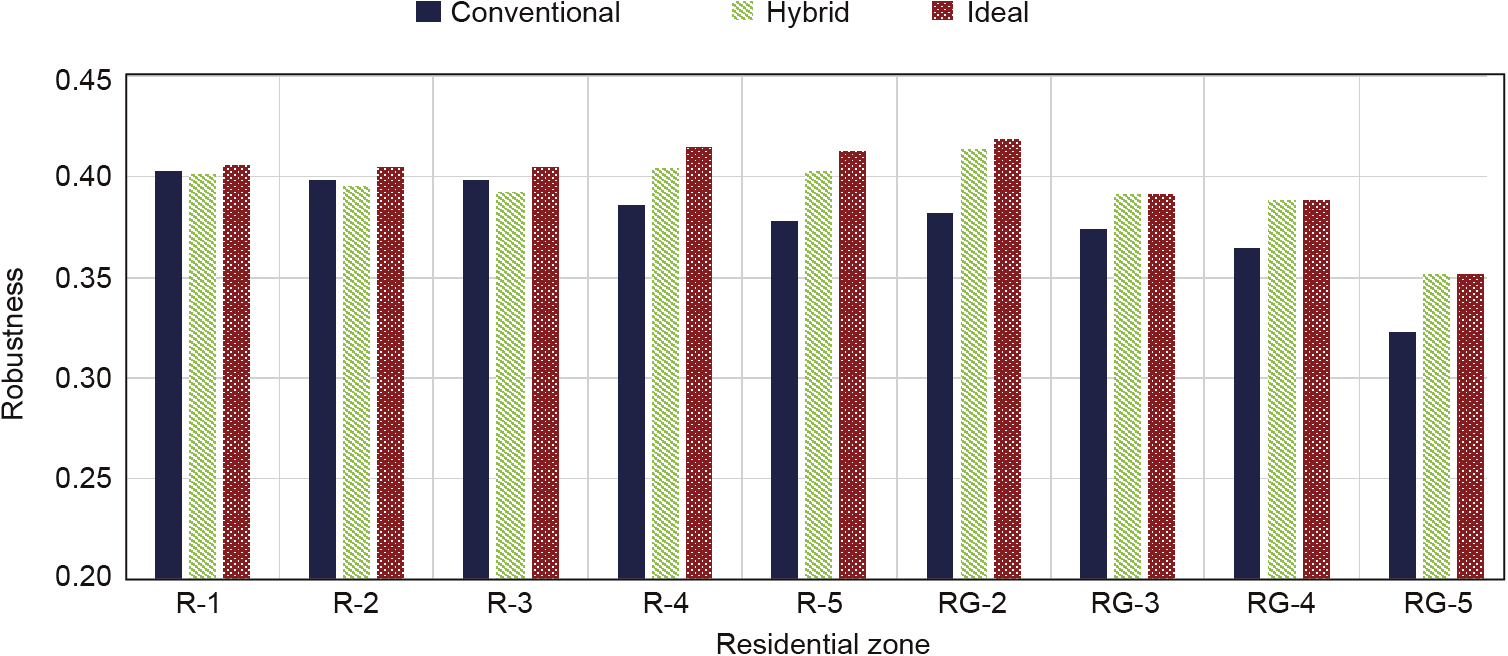
Fig.3.Robustness of conventional,hybrid,and ideal systems for each residential zone.
In the hybrid systems, robustness decreases slightly compared with the conventional systems for R-1, R-2, and R-3, and increases for all other residential zones. The highest value for robustness is for the RG-2 zone, which has a robustness value of 0.414, and the lowest value is for the RG-5 zone, which has a value of 0.351. The decreases in the first three zones are very small, ranging from 0.002 to 0.006 while the increases are more significant, ranging from 0.017 to 0.033. In general, the robustness increases in the hybrid systems. In the ideal systems, the robustness increases for all zones compared with the conventional systems, and shows the greatest increase when compared with the hybrid systems. The values for robustness range from 0.351 for RG-5 to 0.418 for RG-2. All increases in robustness are associated with a decrease in the value of ascendency divided by development capacity, and vice versa. Layton [4] looked at the tradeoff between efficiency and robustness for different ecosystems and human systems. This curve is shown in Fig. 4, which depicts the ecological systems at the top of this curve; the system currently under analysis falls in the same range as other water networks that have been analyzed (i.e., Italian municipalities). In general, this result indicates that the system under study has a greater focus on efficiency than on robustness, thus following the trend of many human-made systems.
《Fig. 4》

Fig.4.Ratio of ascendency over development capacity(ASC/DC)to robustness for numerous ecosystems and human-made systems.The parenthesis on the far right shows the range of the analyzed residential water systems.(Adapted from Ref.[4])
《3.3.Comparison of conventional,hybrid,and ideal systems》
3.3.Comparison of conventional,hybrid,and ideal systems
The results here show that most of the ecological metrics increase from the conventional system to the hybrid system and then increase further in the ideal system. From an ecological perspective, these increased metrics indicate superior ecological health. The ideal systems have the highest metrics, as expected, because these systems were designed to maximize the metrics. Decreases in robustness and cyclicity in some of the hybrid systems were also expected, due to the sole reliance on rainwater for the outdoor irrigation system. Diversification of supply sources or increased linkages improve structural and flow indicators, whereas fewer supply sources or structural simplification through the removal of linkages have negative impacts on ecological indicators.
《4.Conclusions》
4.Conclusions
In this paper, the LID technologies proposed in Ref. [12] were successfully analyzed from an ecological perspective. It was shown that the ecological performance—as indicated by the cyclicity and robustness metrics—of the conventional residential water system can be improved by the introduction of these technologies, with potential for further improvement provided by the addition of a graywater system. These water systems fall in the same range as other water networks and human systems that have been analyzed showing that typically there is a focus on efficiency over robustness. The limitations of this analysis lie in the system boundaries and scale. Each residential zone was analyzed using a single representative household. Ecological performance is typically evaluated from a system standpoint, whereas our model does not take into account the greater network that each of these residences fits into—that is, the overall water network system of the City of Atlanta. Furthermore, we assumed that there was an infinite water supply to each house, although this amount is finite in reality, depending on the water sources. Future analysis needs to be done to scale up the values for the individual zones to the city level in an effort to assess the impact these LID technologies will have on the overall system. In addition, since all the data presented here are annual aggregates, a shorter and more refined time scale is necessary, which will likely show greater variance in the numbers calculated. For example, months with different temperatures and precipitation amounts will lead to different amounts of usage by the residences. Future work will further refine the time scale in order to allow a more complete understanding of the system.
《Acknowledgements》
Acknowledgements
This work was supported by a grant for ‘‘Resilient Interdependent Infrastructure Processes and Systems (RIPS) Type 2: Participatory Modeling of Complex Urban Infrastructure Systems (Model Urban SysTems)” (#0836046) from the National Science Foundation, Division of Emerging Frontiers in Research and Innovations (EFRI). Any opinions, findings, and conclusions or recommendations expressed in this material are those of the authors and do not necessarily reflect the views of the National Science Foundation. The authors acknowledge the work of Jeong et al. for the use of data and support in this analysis.
《Compliance with ethics guidelines》
Compliance with ethics guidelines
Zackery B. Morris, Stephen M. Malone, Abigail R. Cohen, Marc J. Weissburg, and Bert Bras declare that they have no conflict of interest or financial conflicts to disclose.


 京公网安备 11010502051620号


