

《1 Introduction》
1 Introduction
In the year 2015, the “Research on China’s Engineering Science and Technology Development Strategy 2035” project was jointly launched by the National Natural Science Foundation Committee and Chinese Academy of Engineering at the Chinese Academy of Engineering. The project aims include performing top-down systematic research, absorbing the collective wisdom of science and technology, industry, economy, and relevant management departments, condensing the strategic demand of China’s industrial upgrading and economic and social development, scanning major common technologies and key scientific issues, and putting forward policy tools and management measures to promote and support engineering technology development in China [1]. Technology foresight is a technology development strategy assessment method used world-wide, and it strongly influences the technology list and technical industry layout in the 2035 development strategy research of engineering science and technology in China。
Technology foresight is a systematic evaluation method. Its evaluation object corresponds to the scientific and technological field that significantly impacts industry competitiveness, the level of social development, and improvement in the quality of individual lives [2]. The aims of the evaluation method include more accurately analyzing future development trends in science and technology, making a more rational strategic plan for the development of science and technology in the region and in industry, combining the development of the country, society, and economy as well as the development of science and technology, optimizing the allocation of resources, and gaining competitiveadvantage in science and technology [3,4]. In the complete evaluation process, identifying hotspot technologies and frontier technologies and predicting technological development trends are the most important issues of technical foresight that lead to increased research interest at home and abroad [5].
In the present study, robot technology is considered as the research objective to analyze the general process and basic idea of technology hotspots, frontier identification, and trend analysis. The thought and process of the analysis include a significant promotion function and reference significance to the development of problems related to technology foresight. Furthermore, the analysis results provide strong support for the experts to put forward a 2035 technical list and plan an industrial strategic layout.
《2 Related works》
2 Related works
The main aim of technology hotspots and frontier identification, and trend analysis in current technology foresight mainly involves patent data by means of citation or cluster analyses and using indexes to determine technologies that are hotspots as well as frontier technologies and analyze the trends of these technologies. Hou et al. [6] used keywords and cited relationships to analyze the hotspots in wind turbine technology. Luan [7] analyzed a Boeing technology distribution based on high-frequency keyword extraction and patent quantity statistics. Huang et al. [8] used CiteSpace software to achieve patent reference clustering and analyzed technology hotspots and frontiers in the research area of air conditioning based on keyword frequencies, Burst value, and other development indexes. Common technology hotspot identification, frontier identification, and trend analysis indexes are as follows [9]:
(1) Patent quantity. The total number of patents in the same technical point reflects the richness of the invention activity of the corresponding technology industry. An increase in the number of patents indicates that invention activities of the corresponding technology industries are more abundant [10].
(2) Technology maturity coefficient α. α = a/(a + b), in which a indicates the amount of invention-type patent application and b indicates the amount of utility model patent application. The increasing proportion of utility model patent application indicates that the technology displays a tendency to mature [11].
(3) Technology aging coefficient β. β= (a + b)/(a + b + c), in which a indicates the amount of invention-type patent application, b indicates the utility model patent application, and c indicates the amount of the design patent or trademark application. The increase in the proportion of patent applications for designs indicates that technology development displays a tendency to stagnate [11].
(4) Invention patent rate. Invention patent rate = total amount of technology invention patent/total amount of the technology patent, and this is used to measure the level of technology development. The difference between the index and the technology maturity coefficient involves evaluating the overall development level without considering the time change [12].
(5) Technology growth rate. Technology growth rate = the number of invention patents in a specific year/the total number of invention patents over the past 5 years. Technology growth rates are used to measure the evolution of technological activity and reflect on the rapid or slow change in technological innovation over time [13].
(6) Number of authorized patents in the United States. The number of patents in which the priority country corresponds to the United States reflects the technical content of the technology level since the United States patent application procedure is complex, involves high cost, and only patents with economic costs matching their technical results are applied in the United States [14].
(7) Current impact index (CII). CII = the sum of citation frequencies of patents filed in the past five years, related to a specific hotspot in the current year / the sum of citation frequencies of all patents related to the technology field under consideration (robot technology) in the current year. The index reflects the impact and leadership of a specific technology in the technology field under consideration [15].
(8) Technical impact index (TII). TII = (the number of patents in the top 10% in the year of the technology/the number of patents in the year)/(the number of top 10% patents in which the technology was cited/the number of patents). This index better reflect the degree of technological leadership than the CII. An increase in the index increases the lead of the technology [16].
(9) Technical strength (TS). Technical strength = current impact index × number of patents. An increase in the index increases the technical strength [17]
(10) Technical independence. Technical independence = technology patent self-cited times/technology patent total cited times. This index reflects the degree of dependence of the technology on other technical points and its independent research and development (R&D) level. An increase in the technical independence index decreases the technology’s dependence on other technologies and increases the independent research and development level [18].
(11) Number of forward citations. This refers to the number of times that a patent is cited to measure the extent to which the technology affects subsequent technological developments. An increase in the index increases the importance of the technology [19].
(12) Scientific relevance. This refers to the average number of patents cited in citing scientific literature that reflect the degree of relevance between the technology and scientific research. An increase in the index indicates a stronger relationship between technological innovation and scientific research [20].
(13) Burst value. By dividing the frequency of appearance of a keyword in a specific period by the frequency of the last period, a series of ratios is obtained, and the highest of these ratiosis considered as the Burst value of the technical field represented by the keyword. For example, if the number of occurrences of the word “pressure” before 2001 is N1, the number of occurrences between 2001 and 2005 is N2, and the number of occurrences between 2005 and 2010 is N3, Burst = Max ((N2/N1), (N3/N2)). The Burst value reflects the degree of sudden increase in patents in a technical field, and a higher Burst value indicates a higher proportion of recent patents in this field as a result of an increase in the patented research in that field.
In addition to using the index system to evaluate technology development, existing technology foresight studies typically use the Delphi method used in the first round of developing the technical foresight 2035 alternative technology list. However, the simple use of expert knowledge in decision-making has obvious problems. If the knowledge of technical experts is limited, then it is easy to form erroneous views, expectations, or assumptions at the outset. The results may cause difficulties in the convergence of the prediction analysis, and this ultimately leads to the inability to effectively support decision-making. Therefore, with respect to expert analysis and foresight, it is necessary to provide experts with reliable data support such as technical development indexes.
The fore-mentioned indexes often target a single problem such as the effect of number of patents on the enrichment of technological inventions or the effect of growth rate on the technology development speed. Previous studies have examined the characteristics of single aspects, and thus, there is a paucity of a comprehensive and systematic analysis that considers several aspects. Therefore, in this study, we synthesize several indexes that are commonly used to reflect the technical development level, form a technical development level index system, and synthesize multiple factors to identify hotspots and frontiers in technology along with their development trends. The current scenario of technology development is more comprehensively presented to experts, so that experts can have a more detailed reference with regard to technical analysis and foresight and can make more accurate judgments.
《3 Methods》
3 Methods
To obtain the results of the analysis to provide support and reference for identifying important technologies in the 2035 technology foresight list and inspire experts to better complement and adjust the list of alternative technologies, the present study adopts a series of patent analysis methods including automatic thesaurus construction and keyword frequency analysis in the field of robot technology. In the analysis, the patent quantity, CII, TII, US authorized volume, TS, and other indexes were used to reflect on research in robotics technology and use the technology growth rate, technology maturity coefficient, invention patent rate, and other indexes to reflect on the technological frontiers of this single technology considered in the study. The research process is broadly divided into the following three steps: data acquisition, technical topic division, and identification and trend analysis of technology hotspots and frontiers. The research process is shown in Fig. 1
《Fig. 1. 》
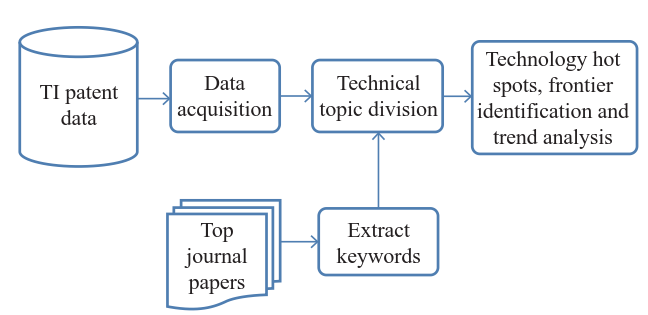
Fig. 1. Flowchart of the research process.
《3.1 Data source》
3.1 Data source
The data used in the study are from the Thomson Innovation (TI) database of Thomson Reuters. The TI database contains all Derwent World Patents Index (DWPI) patents and information on 80 million patents from more than 90 countries and regions. It contains an entire PDF of the original data and title information, legal status information, and other deep-processing data including the International Patent Documentation Center (IN-PADOC) legal status information. The use of the TI database as the data source ensures the adequacy and reliability of data.
Based on the “robot” theme, we formulated a query containing 336 Derwent manual codes, 185 patent classification numbers, and 53 keywords, and ruled out 19 Derwent manual codes and 95 patent classification numbers. To enter a query in the TI database search, all the years are selected to obtain a TI database that contains ‘robot’ theme patents. Information related to a total of 128 279 patents was retrieved, and the search date was March 15, 2016.
《3.2 Technical topic division》
3.2 Technical topic division
In patent analysis, the patent classification number is often used to classify the patented technical topics. However, there is a difference between the standard of patent classification and the classification of the problem that is examined. For example, it is difficult to connect the patent of a “robot joint” with a specific technology in the field of robotics. Therefore, the study uses the method of constructing the thesaurus to classify technical topics in the field of robotics. According to the Journal Citation Reports (JCR) Division Handbook of the Chinese Academy of Sciences, 2015, we selected the topics related to the robotics domain only from the journal The International Journal of Robotics Research (which is the only journal in section A). We traversed all the keywords in the journal based on the frequency and breadth of technology to manually select 118 keywords inthe technical topic thesaurus.
All patent information was traversed based on the manual selection of technical topic thesaurus. If a word in the thesaurus appears in the patent Derwent abstract, then the content of the patent is considered as related to the word. The main patent content involves describing the corresponding technical point of the keyword and recording the term of the patent’s public time, priority countries, and patent priority person information for use in the subsequent analysis.
《3.3 Hotspot and frontier identification and trend analysis》
3.3 Hotspot and frontier identification and trend analysis
3.3.1 Overview
After searching for keywords in the 128 279 patents and determining that 33 220 patents contain keywords in the robotics thesaurus, the analysis was restricted to the 33 220 patents. Fig. 2 shows the change in the number of patents with time. A small number of patents appeared in 1985, and the number of patents gradually increased with time. The development was smooth prior to 1993. There was a steady increase from 1993 to 2009, and the growth was faster in 2009–2013. The number of patents peaked in 2013 and then began to decline. A patent has a 3-year publicity period, and thus, it remains to be seen as to whether the number of patents after year 2013 has decreased. Generally, there is an increase in the number of patents in the field of robotics.
《Fig. 2. 》

Fig. 2. Time distribution of patents in the field of robotics.
3.3.2 Hotspot identification
It is necessary to understand the hotspots in the field of robotics to identify the areas with issues in robotics, grasp the current state of robotics, and better develop technology layouts.
The number of patents in the field of robotics, the United States authorized volume, CII, TS, TII, forward citations, and scientific relevance indexes reflect the maturity of technologies in this field and these indexes are the focus of the study. All technical indexes are sorted by the patent number, and the top 20 are considered (Table 1).
Table 1. Indexes of the top 20 hotspot technologies
《Table 1. 》

As shown in Table 1, “motion control” is the keyword found in maximum number of patents filed in the field of robotics, and the number of related patents and various indexes are higher. Thus, it is considered that the relevant research fields already possess a certain degree of technical maturity. The hotspot is followed by “mobile robot” that represents recent research in hot mobile robot technology. The number of patents related to “remote control” is ranked third, and this represents remote control technology. The number of patents in these two areas is also high, and their respective areas of technology tend to mature. There are a few other keywords with higher frequency in technical fields such as “flexible arm” and “position control.” They appear in several patents. However, the technical impact indexes are low, and it is necessary to further improve the respective areas of technical maturity.
3.3.3 Frontier identification
An understanding of the frontiers of robotics aids in identifying emerging areas and cutting-edge trends in robotics development and development, and in the better deployment of research and development technology.
The patent change rate, technology growth rate, technology maturity coefficient, and invention patent rate in the field of robot technology reflect the development of technology in this field and help understand the frontier and development trends in the technology field. The first 20 of the technical points are sorted by the Burst value as listed in Table 2. To reduce the interference wherein the publicity period of patents is not counted, the technology growth rate and other indexes are calculated for the year 2013.
Table 2. Indexes of the top 20 frontier technologies
《Table 2. 》

As shown in Table 2, the Burst value, invention patent rate, and patent change rate for an “autonomous robot” are all higher; the research concerns increase rapidly, and the various indexes indicate that the technology is still in the development stage. It is considered that the related research field corresponds to the frontier field. The hot words “dexterous hand” and “pneumatic system” follow the same trend. The Burst values of these two fieldsare also higher, the indexes reflect that these technologies are still in the development stage, and their areas of technology correspond to frontier fields. There are a few technical fields with higher Burst values including “range finder” and “biped robot”with a high Burst value. However, their technology growth rate and patent growth rate are not high while the technology maturity coefficient is high. This indicates that these technologies previously corresponded to frontier technology. Nevertheless, they are no longer considered as the frontier technology since their development is considered as mature.
3.3.4 Trend analysis of high-frequency technical fields
To analyze the relationship between the technical fields associated with high-frequency keywords and the change in time, we selected five keywords with high frequencies that were plotted in Fig. 3 and Fig. 4 based on the relationship between the number of patents and the change in the technology growth rate with time, respectively.
Fig. 3 and Fig. 4 show that the trend of patent quantity over time of “motion control,” “mobile robot,” and “remote control” technology fields is approximately the same as that of the total number of patents in the field of robotics. These technology fields are considered as fundamental in the field of robotics, and their development trend reflects the overall development of robotics. Furthermore, “robot hand” and “laser scanner” technologies were patented since 1985 and generally developed smoothly. These conclusions are consistent with the conclusions obtained in section “3.3.1 Overall overview” and further demonstrate the rationality of the conclusions.
《Fig. 3.》

Fig. 3. Change in patent quantity with respect to time for high-frequency technologies.
《Fig. 4. 》

Fig. 4. Growth rate as a function of time for high-frequency technologies.
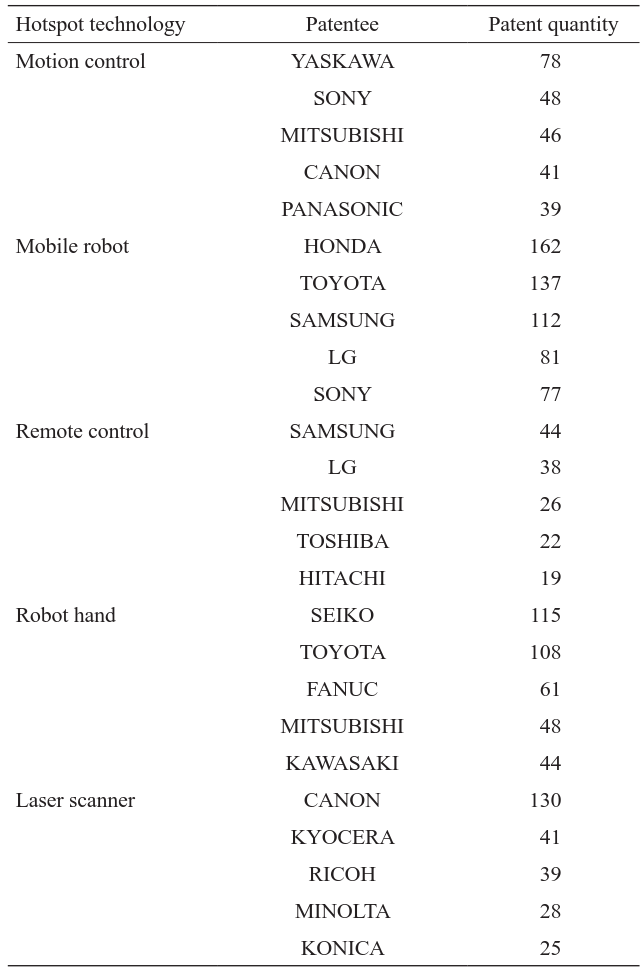
3.3.5 Distribution of the patentees in high-frequency technologies
To analyze the high-frequency keywords corresponding to technical areas that belong to certain companies, we selected six of the high-frequency terms based on the keyword statistics listed in Table 3. As shown in Table 3, the companies that master these basic technologies and hotspot technologies are mostlyJapanese companies such as Yaskawa, Honda, Canon, and Toyota. Thus, Japanese companies mastered the basic technology of robotics and also conducted thorough studies on hot technology; they constitute the robot technology patent power. Korean companies including Samsung Group and LG Electronics also have more patents mainly concentrated in the “mobile robot” and “remote control” technology research. The results show that Japanese researches and developments in robotics display more advances, although South Korea also displays strong potential in industrial robots and follows Japan.
Table 3. Distribution of patentees in high-frequency technologies
《Table 3. 》
《4 Support for the 2035 technical list》
4 Support for the 2035 technical list
The results of patent analysis in the field of robotics were submitted to an expert group working on “Research on China’s Engineering Science and Technology Development Strategy 2035,” and the approval and support of the experts was obtained. In the process of modification of the technology foresight list, the analysis results of this study are considered as an important reference that provide data support for expert analysis and judgment. This support is mainly embodied in the following two aspects.
First, the results of the study provide support and reference to determine the importance of a particular technology in the list of alternative technologies. The technology related to “minimally invasive surgery” is highly correlated with the specialist surgical robot technology, and an “underwater robot” technique is highly correlated with underwater autonomous robot technology as well as “autonomous robot” and “adaptive control” technology that are highly correlated with the autonomous behavior technology of robots. Additionally, the new sensing technology, namely “artificial muscle” technology, is based on the fusion of life/electromechanical systems and is identified as a hotspot or a frontier to provide a strong support for the rationality of the alternative technology list, identify the possible sub technology hotspots and frontiers of the relevant technical points, and provide a reference for experts to determine further technical development descriptions and layouts.
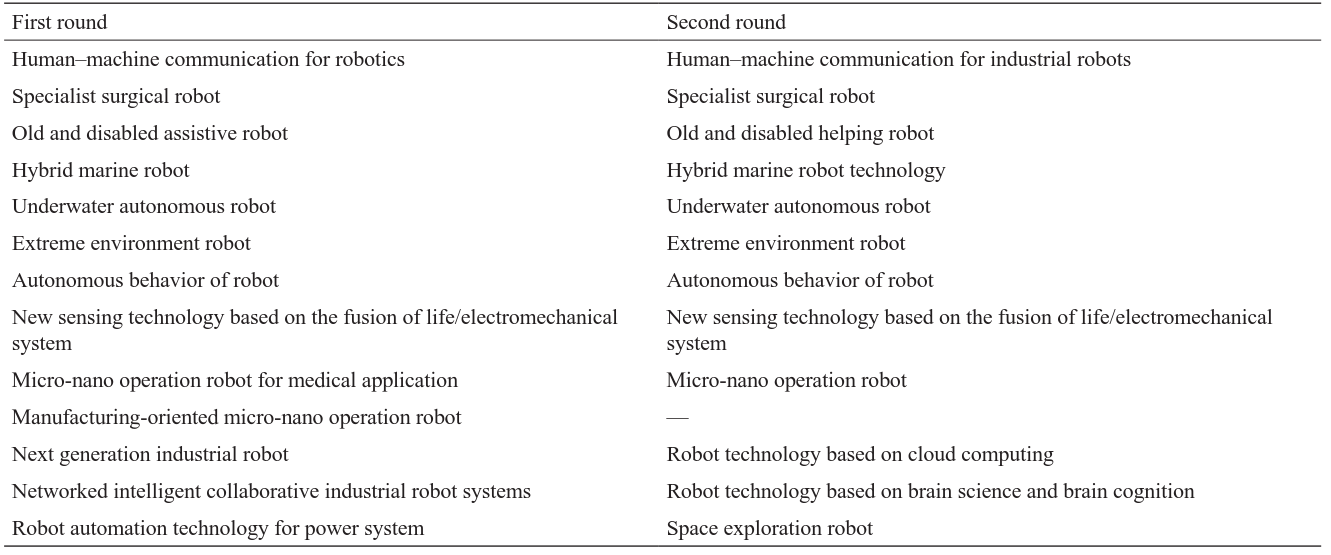
Conversely, the results of the study inspired experts to supplement and revise the list of alternative technologies. The research method identified the technology hotspots of “mobile robot,” “remote control,” “walking robot,” and technology frontiers of “biped robot” and “adaptive control” that are highly correlated to space exploration robot technology. It also fully illustrates the necessity and feasibility of the development of space exploration robot technology and technology hotspots including “humanoid robot,” “neural network,” and “sensor fusion” that are highly correlated with robot technology based on brain science and brain cognition and provides better data support for the development foreground of robot technology based on brain science and brain cognition. Experts were inspired by this to add space exploration robot technology and robotics based on brain science and brain cognition to the list of alternative technologies in developing the second-round list. Table 4 presents a detailed picture of the second-round list of alternative technologies.
Table 4. Second-round list of alternative technologies for robots
《Table 4. 》
《5 Conclusions》
5 Conclusions
In this study, multiple indexes based on the index system analysis method were comprehensively used to analyze the field patents in the field robot technology, identify technology hotspots and frontiers of robot technology, and perform trend analysis to promote research in the field. The results of this study were used as an important reference basis in the process of the modification of the technology foresight list, and the optional list of the first round was adjusted given the experience of experts in the relevant field. The analytical thought and process proposed in the study possess a strong promoting function and reference significance for addressing problems related to technology foresight, and the analysis results provide a strong support for experts to put forward a 2035 technical list and plan the industrial strategic layout.
The following conclusions were obtained by the process of patent analysis in the field of robotics. First, robot technologyhas steadily developed from a time distribution viewpoint. According to the relationship between the number of patents and time, this study uses the index system to analyze the previous research on the basic technologies of “motion control” and “mobile robot” in the field of robotics as well as new hotspot technologies including “autonomous robot,” “dexterous hand,” “robot manipulator,” and “artificial muscle.” Second, from a regional distribution viewpoint, robot-related technologies are mainly concentrated in Japan and South Korea. Japan’s strength in R&D in the field of robotics provides it a higher advantage. South Korea also displays strong strength in terms of robotics research and development. Summarizing and classifying the technologies that are considered as popular and advanced, this study identified relatively mature technologies including “motion control” and “mobile robot,” as well as emerging hot technologies such as “autonomous robot” and “dexterous manipulator” as areas with immense research potential, similar to topics such as “robot manipulator” and “artificial muscle.” Additionally, a simple analysis was performed on three types of technology with respect to enterprise layout technology research and development.
To better identify technology hotspots and frontiers, analysis based on the literature data from Web of Science, network data such as network news and technology blogs, and patent data can be used to compare and analyze different levels of technology development status in the future. This approach may be more instructive for the development of a national strategy and the layout of an enterprise.


 京公网安备 11010502051620号


