
《1 Introduction》
1 Introduction
In the past 40 years of reform and opening-up, China’s agricultural development has made remarkable progress and a series of achievements. However, it is also confronted with concerns such as the lack of water and soil resources, transformation and upgrading of dietary structure, and global climate change [1]. China’s agricultural water and soil resources have been under high pressure for a long time, and the per capita water resource (2300 m3) is only 28% of the world average. Water pollution and the low utilization efficiency of water resources coexist. Per capita arable land area is less than half of the world average; some problems persist, such as high unit production costs and weak comprehensive competitiveness.
As a result of population increase and upgrade of consumption structure, China’s demand for grain witnesses rigid growth. On one hand, under resource constraints, the total grain output in 2020 was 6.695×10¹² t, and grain imports also hit a record high of 1.393×10¹² t (including beans). Import volume was equivalent to 20.8% of domestic production, indicating a gap between domestic grain production and demand [2]. On the other hand, the structural contradiction between grain supply and demand is quite prominent. From the perspective of variety structure, rice production exceeds demand and stored rice needs to be consumed. The balance between wheat production and demand is the surplus; the supply of special high-quality wheat is insufficient, and millions of tons of wheat need to be imported every year. Maize production and demand are tight, and the self-sufficiency rate has been declining for a long time. The external dependence on soybeans exceeds 80%, and the gap between production and demand tends to expand further [3]. It can be predicted that with the continuous growth of feed consumption, the gap between feed grains, such as soybean and corn, will gradually expand. China still faces the problems of high grain production, high stocks, high imports, high costs, high prices, and low competitiveness [4]. Meanwhile, COVID-19 has increased the risk of disruption in the international food supply chain and raised the scope of international food trade protectionism. Therefore, ensuring the balance of agricultural water and soil resources and improving agricultural science and technology with seeds as the core is of great value in ensuring China’s food security.
In the future, China’s total grain gap will first increase and then decrease. Through soy-based grain import and trade activities of virtual water and virtual cultivated land, the pressure on cultivated land and water resources can be alleviated, and agricultural irrigation water utilization efficiency can be improved [1,5]. Constructing a global agricultural supply chain and making full use of the “two resources and markets” is a strategic choice to achieve the balance and sustainable utilization of agricultural water and soil resources in China in the future. Based on the changing trend of international agricultural resources and the current situation of agricultural resource utilization in China, this research studies the long-term supply and demand balance of agricultural resources by 2035 and 2050 from the perspective of water and soil resources. It analyzes the import potential and sources of agricultural resources from a global perspective. The agricultural water and soil resource utilization targets by 2035 and 2050 are prospected and analyzed.
《2 Changing trend of international agricultural resources and current status of agricultural resource utilization in China》
2 Changing trend of international agricultural resources and current status of agricultural resource utilization in China
《2.1 Trends of changes in international agricultural resources by 2050》
2.1 Trends of changes in international agricultural resources by 2050
2.1.1 Temporal and spatial patterns and trends of the world cultivated land resources
From 1961 to 1987, the cultivated land area increased from 1.273×10⁹ hm2. It continued to increase to 1.374×10⁹ hm2. From 1988 to 2007, the cultivated land area decreased gradually. Since 2008, the cultivated land area has progressively increased, reaching 1.383×10⁹ hm2 in 2019. The world’s arable land resources are concentrated in China, the United States, India, Russia, Brazil, Argentina, Australia, Canada, Kazakhstan, Ukraine, and other countries. Among them, Russia, Canada, Argentina, and Australia lead the world in per capita arable land, and most of Asia and Africa have relatively insufficient per capita arable land. Since 2010, among the countries with the highest total amount of cultivated land globally, China’s cultivated land area has decreased the most, Brazil’s has increased the most, and Argentina and Australia’s cultivated land areas have continued to grow. The United States has remained stable. High-intensity cultivated areas worldwide are concentrated in Southeast Asia, South America, North America, and West Africa, and the multiple cropping index exceeds 200%. The world has 3.34 ×10⁸ hm2 of cultivated land that adopts irrigation equipment. Approximately 70.9% of cultivated land is irrigated in Asia, South America, and North America. China has the largest irrigation area (7.3×10⁷ hm2), followed by India (7×10⁷ hm2) and the United States (2.7×10⁷ hm2).
By 2050, the global trend of land degradation will be further aggravated, and people will face higher food security and ecological risks. An estimated four billion people live in arid areas. Land degradation and climate change will reduce world crop yields by an average of 10% and 50%, respectively, in some areas of extreme conditions [6]. It should also be noted that a significant amount of potentially arable land is present in the world. There is room for land expansion in sub-Saharan Africa and Latin America. At the same time, climate change has a certain potential for land expansion in temperate regions. According to a previous study [7], the cultivated land area in the world will continue to grow by 2050, but the growth rate will be lower than that in the past 50 years. The world arable land area by 2030 is estimated to be 1.645×10⁹ hm2. From 2030 to 2050, the growth rate of cultivated land will only be approximately 1%, and the cultivated land area will reach 1.661×10⁹ hm2 by 2050. Most of the growth in arable land comes from developing countries, whereas arable land in developed countries is likely to decline.
2.1.2 Spatial and temporal patterns and trends of global water resources
The global shortage of water resources, coupled with uneven regional distribution, has led to a severe lack of water resources per capita in Africa and Asia. The precipitation near the equator is more, and gradually decreases from the equator to the two levels. Near the Tropic of Cancer and the Tropic of Capricorn, there is more precipitation on the east coast of the continent and less precipitation on the west coast. Oceania has the least freshwater resources globally but has the most water resources per capita because of its small population. South America and North America are rich in water resources (together accounting for 44% of the world’s freshwater resources), with renewable water resources per capita exceeding 2.5×10⁴ m3. Due to their dense populations, Asia and Africa are relatively short of freshwater per capita. Agriculture is currently the most water-consuming sector, accounting for 69% of the world’s total water consumption, mainly for agricultural irrigation. It is estimated that global water use for crop irrigation will increase by 23%–42% by 2050 compared to 2010 [7].
The global water demand will continue to grow, and the water stress caused by population growth will be further exacerbated by 2050. According to the World Water Development Report 2018 released by the United Nations, considering population growth, economic development, and changing consumption patterns, the global water demand is growing at a rate of 1% per year. The current world water demand is approximately 4600 km3, and it is expected to increase to 5500–6000 km3 by 2050 [7]. By 2050, Asia (91%–96%) and Africa (4%–9%) will be the most vulnerable to water shortages. In addition, droughts and floods also affect water supply, and the demand for industrial and domestic water will grow much faster than that for agriculture in the future.
《2.2 Current status of agricultural resource utilization in China》
2.2 Current status of agricultural resource utilization in China
Agricultural resources are mainly divided into agricultural natural and economic resources. The former refers to the natural environment elements used, such as land, water, climate, and biological resources. The latter involves the agricultural labor force, capital investment, agricultural technology, etc. Water and soil resources are the primary limiting resources in agricultural production; therefore, this study focuses on the balance of agricultural water and soil resources and international import and export potential.
2.2.1 Cultivated land resources
Cultivated land resources in China first increased and then decreased, and the per capita cultivated land resources showed a downward trend. From 1949 to 1980, cultivated land resources exhibited an upward trend. Since 1980, cultivated land resources have declined. In 2017, the total cultivated land area in China was 1.349×10⁸ hm2. Per capita, arable land resources showed a downward trend. According to the the third national land resource survey from the Ministry of Natural Resources, China’s arable land area in 2019 was 1.279×10⁸ hm2. Paddy, irrigated, and dry lands accounted for 24.55%, 25.12%, and 50.33%, respectively. China continues to implement strict farmland protection policies, and the area of cultivated land is expected to remain at 1.243×10⁸ hm2 in 2035, and at least at 1.2×10⁸ hm2 by 2050.
According to Arable Land Quality Grade 2019 Bulletin issued by the Ministry of Agriculture and Rural Affairs of the People’s Republic of China, the first- to third-grade arable land area is 4.227×10⁷ hm2, accounting for 31.24% of the total cultivated land area. The cultivated area of grades four to six is 6.313×10⁷ hm2, accounting for 46.81% of the total cultivated land area. The cultivated area from grade 7 to grade 10 is 2.96×10⁷ hm2, accounting for 21.95% of the total arable land area. From the spatial distribution, cultivated land is mainly concentrated in Northeast, Northwest, and North China, which does not match the spatial distribution of water resources.
2.2.2 Water resources
Since 2010, the total amount of water resources in China has slightly increased. Still, its spatial and temporal distribution is uneven; the average per capita water resources are only 2000 m3, and the average agricultural water consumption is 3.7×10¹¹ m3. Precipitation decreased from the southeast coast to the northwest inland, and a regional mismatch between water and soil resources was apparent. For example, cultivated land in the Yangtze River Basin and south of the Yangtze River accounts for only 36% of the country’s total. In comparison, water resources account for 80% of the country’s total resources. The Huanghe, Huaihe, and Haihe Rivers together account for only 8% of the country’s water resources, while farmland accounts for 40% of the country’s total. Due to the shortage of surface water resources in Northern China, the dependence of agricultural production on groundwater is increasing annually. Groundwater overexploitation is serious in North China, and shallow groundwater levels have declined. In many areas of China, water use is backward, and the efficiency of agricultural water resources is low. Although the effective utilization coefficient of farmland irrigation water has increased annually in China, its overall level is low. For example, it was only 0.554 in 2018, still lagging behind 0.7–0.8 in developed countries. There is also a large gap between the unilateral output of irrigation water and the level in agriculturally developed countries.
《3 Analysis of balance between supply and demand of China’s medium- and long-term agricultural resources》
3 Analysis of balance between supply and demand of China’s medium- and long-term agricultural resources
《3.1 Grain consumption demand》
3.1 Grain consumption demand
3.1.1 Forecast of per capita consumption of primary agricultural products
The partial equilibrium model of agricultural products (CASM) was used to analyze and forecast China’s food demand changes under different population scenarios. As a policy simulation analysis tool, CASM can study the impact of policy changes, external shocks, and other factors on China’s agricultural market [8]. This study shows that from 2017 to 2035 and 2050, the food consumption structure of urban and rural residents will be characterized by a gradual decrease in staple grain consumption and a continuous increase in meat, eggs, and milk consumption. In 2018, the proportion of staple grain consumption for rural residents was 43.33%, and that of vegetables and fruits was 39.91%, which will decrease slightly by 2035 and 2050.
In terms of grain consumption, it will be stable and declining by 2050 as a whole, with per capita consumption falling from 198.5 kg in 2018 to 185.9 kg in 2035 and 178 kg by 2050 (Fig. 1). The per capita grain consumption in rural areas is higher than that in urban areas and gradually converges over time. The per capita grain consumption in rural and urban areas will decrease from 229.57 kg and 177.04 kg in 2018 to 225.3 kg and 171.98 kg in 2035, and 219.72 kg and 167.53 kg by 2050, respectively. Rice consumption was the highest in terms of the consumption structure, followed by wheat, corn, and soybean, with little change in the overall structure.
《Fig. 1》
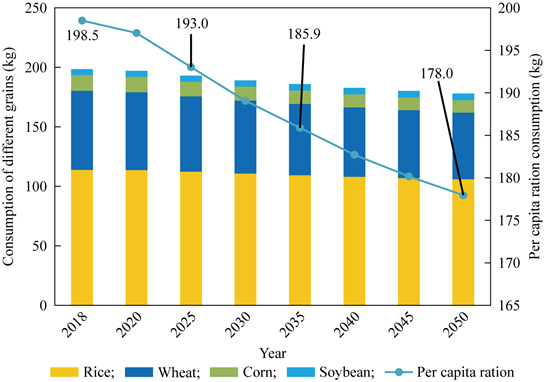
Fig. 1. Per capita ration consumption structure.
Source: National Bureau of Statistics, author’s calculations and CASM simulations.
In terms of fruit and vegetable consumption, urban per capita vegetable consumption is higher than rural per capita consumption, increasing from 170 kg and 129 kg in 2018 to 174.4 kg and 140.3 kg in 2035, and 171.1 kg and 145.3 kg by 2050, respectively.
Meat, eggs, and milk consumption continued to increase overall, and the per capita consumption in rural areas was lower than that in urban areas. By 2035, the gap between rural and urban consumption of meat, eggs, and milk will gradually narrow, and by 2050, consumption will be close. Among them, pork consumption is the highest, with the per capita pork consumption in rural areas and urban areas increasing from 23.92 kg and 31.2 kg in 2018 to 29.22kg and 34.39 kg by 2035, and to 32.68 kg and 36.34 kg by 2050, respectively.
3.1.2 Demographic and demographic change projections
The change in China’s future total population and structure will significantly affect the future food consumption structure and total food demand, which is directly related to medium- and long-term food security. From now to 2050, this will be an important stage of population change in China. Under the comprehensive influence of factors such as the decrease in the birth rate, the development of the aging population, and the introduction of policies to encourage the birth rate, the total population and the structure of the population will change significantly. For example, the total population will reach a peak, and the proportion of the urban population will continue to increase. According to the simulation program of China’s population forecast released by the United Nations Population Office [8] (based on the simulation program of population forecast with the medium growth rate), the peak of China’s total population is 1.4416 billion (2029). By 2035, China’s total population will be 1.432 billion, with 1.059 billion permanent urban residents and 373 million permanent rural residents accounting for 74% of the urban population. By 2050, China will have a total population of 1.363 billion, with 1.091 billion permanent urban residents and 272 million permanent rural residents; 80% of the urban population will be urbanized.
3.1.3 Forecast of total grain demand
According to China’s per capita consumption of major agricultural products and China’s population forecast benchmark plan, the forecast plan of China’s total consumption of major agricultural products in the future is obtained: total consumption of grain will reach its peak in 2035–2040, and grain ration will reach its peak in the near future (Fig. 2).
《Fig. 2》

Fig. 2 Prediction results of grain consumption.
Source: National Bureau of Statistics, CASM model simulation
Forecasts of total food demand should consider harvest loss, food waste, seed, and industrial application needs. For example, it is generally believed that the loss of grain harvest is approximately 5%, the processing demand of wheat, rice, and other staple grain industries accounts for 8% (the research conclusion of the Chinese Academy of Agricultural Sciences), and seed demand accounts for 1%. To this end, total food demand is estimated based on the following assumptions about the combined share of seeds, industry, loss, and waste: 15% in 2018–2020, 12% in 2025–2035, and 10% in 2035–2050. The forecast results show that China’s total grain demand will peak in 2035 (6.762×10⁸ t), feed grain consumption will continue to increase until 2050 (3.317×10⁸ t), the consumption of grain will steadily decrease, and the consumption of oil and sugar will continue to increase (Table 1).
Table 1. Plan grain consumption and total demand (unit: × 104 t).
《Table 1》
| Year | Aggregate food demand | Grain consumption | Seeds, industry, derogation, and waste | Rations | Feed grains | Oil | Sugar |
| 2018 | 64 311 | 55 922 | 8388 | 29 434 | 26 488 | 2802 | 205 |
| 2020 | 65 025 | 56 543 | 8482 | 29 453 | 27 090 | 2909 | 212 |
| 2025 | 65 206 | 58 219 | 6986 | 29 264 | 28 955 | 3048 | 229 |
| 2030 | 66 940 | 59 768 | 7172 | 28 770 | 30 997 | 3126 | 244 |
| 2035 | 67 619 | 60 374 | 7245 | 28 136 | 32 238 | 3176 | 258 |
| 2040 | 67 591 | 60 349 | 7242 | 27 567 | 32 782 | 3269 | 257 |
| 2045 | 66 996 | 59 818 | 7178 | 26 897 | 32 921 | 3329 | 254 |
| 2050 | 66 418 | 59 302 | 7116 | 26 129 | 33 173 | 3357 | 250 |
《3.2 Balance between supply and demand of agricultural resources》
3.2 Balance between supply and demand of agricultural resources
3.2.1 Balance analysis of grain supply and demand
This study analyzed the planting area, yield per unit area, consumption, production, trade, and inventory of major food crops in China based on the CASM model prediction results. It further calculated the grain gap (or surplus) to clarify the gap between the supply and demand of agricultural resources.
By 2035 and 2050, the combined proportion of wheat, rice, and corn is expected to remain at approximately 60 percent. The acreage planted with wheat and rice will decrease slightly while that of corn increases. This is similar to the change in consumption structure; that is, the direct consumption of staple grains decreases while the consumption of feed grains increases. Soybean acreage is expected to increase slightly, and fruit and vegetable acreage will increase from 20% in 2001 to 23% by 2050. Regarding the yield per unit area and planting area of major crops, corn yield per unit area will continue to rise and grow fastest, reaching 7.3 t/hm2 in 2035. The yields per unit area of wheat and rice will remain at 5.4 t/hm2 and 6900 t/hm2, respectively.
The overall balance of grain supply and demand is as follows: there is a structural gap between small grains, such as rice, wheat, and corn; there is a surplus in fruits and vegetables; and there is a gap in corn, soybean, oilseed, and cotton. The rice demand gap increased from 1.87% in 2018 to a peak in 2024, and a small surplus appeared by 2050. The wheat gap will gradually decrease from 3.46% in 2018 to a balance by 2050. The corn gap will gradually increase from 1.85% in 2018 to 13.94% by 2050. The gap of oil crops is the main one, of which the gap of soybean is the largest and increases gradually, and the gap is 1.05×108 t by 2050 (gap accounted for 87.55% of demand)—a small surplus of peanuts. The sugar gap goes from 2×10⁶ t to 5×10⁶ t The surplus of fruits and vegetables first increases and then decreases.
3.2.2 Balance analysis of supply and demand of agricultural resources
The resource gap and balance of supply and demand were estimated according to the prediction results of the total grain demand gap and yield per unit area. From the perspective of cultivated land, the gap in 2018 was 5.527×10⁷ hm2, which gradually increased. By 2035, the gap will decrease progressively and reach a peak value of 5.827×10⁷ hm2 by 2050. The shortage of cultivated land was relatively stable, among which the arable land for feed crops (corn and soybean) has a large gap and is dominated by corn (Table 2).
Table 2. Total arable land gap and arable land gap of main food crops (Unit: × 104 mu).
《Table 2》
| Year | Total arable land gap | Rice | wheat | corn | Soybean |
| 2018 | 82 933 | 795 | 1196 | 1293 | 77 054 |
| 2020 | 83 256 | 865 | 1165 | 2512 | 75 561 |
| 2025 | 84 318 | 934 | 1094 | 5461 | 72 823 |
| 2030 | 82 509 | 891 | 804 | 6002 | 70 727 |
| 2035 | 80 601 | 922 | 658 | 6385 | 68 573 |
| 2040 | 84 091 | 641 | 599 | 8665 | 69 951 |
| 2045 | 86 543 | 274 | 428 | 10 304 | 71 148 |
| 2050 | 87 422 | -315 | 33 | 11 052 | 72 144 |
Note: 1 mu ≈ 666.7 m2
The virtual water concept can be used to estimate the water resource gap (based on the product of the grain gap and virtual water coefficient) [5,8]. In 2018, the water resource gap was 2.73×10¹¹ m3. In 2035, the gap will increase to 3.104×10¹¹ m3 and reach 3.247×10¹¹ m3 in 2045. It decreased slightly after the peak. By crop, the biggest water shortage is in soybean, with an increase from 2.497×10¹¹ m3 to 2.774×10¹¹ m3 by 2050. Other crops with significant water shortages are corn and cotton. The virtual water of high-value crops, such as fruits and vegetables, is in a state of net export (Table 3).
Table 3. Water resources gap forecast for 2025, 2035 and 2050 (Unit: × 104 m3).
《Table 3》
| Year | Rice | Wheat | Corn | Soybean | Sugar cane | Cotton | Fruit | Vegetables | Total gap |
| 2018 | 50 | 51 | 44 | 2497 | 30 | 109 | -33 | 18 | 2730 |
| 2020 | 54 | 51 | 88 | 2512 | 36 | 133 | -35 | 18 | 2821 |
| 2025 | 59 | 48 | 204 | 2555 | 53 | 165 | -44 | 37 | 3003 |
| 2030 | 56 | 35 | 238 | 2601 | 53 | 173 | -53 | -46 | 3058 |
| 2035 | 58 | 29 | 256 | 2637 | 52 | 177 | -55 | -51 | 3104 |
| 2040 | 40 | 26 | 347 | 2690 | 58 | 182 | -80 | -63 | 3201 |
| 2045 | 17 | 19 | 413 | 2736 | 63 | 185 | -110 | -76 | 3247 |
| 2050 | -20 | 1 | 443 | 2774 | 68 | 187 | -148 | -92 | 3214 |
《4 China’s future import potential of agricultural resources from the perspective of globalization》
4 China’s future import potential of agricultural resources from the perspective of globalization
《4.1 Import volume of virtual water for agricultural products and virtual cultivated land》
4.1 Import volume of virtual water for agricultural products and virtual cultivated land
The virtual cultivated land import volume was estimated according to the net import volume and yield per unit area of various crops obtained by the CASM. The virtual water import volume was estimated using the virtual water coefficient and net import volume of different crops. Penman formula [9] was used to estimate the virtual water content of rice, wheat, corn, and soybean as 1.19 m3/kg, 0.86 m3/kg, 1.37 m3/kg, and 2.65 m3/kg, respectively [10]. Soybean has the highest virtual water content, and a large amount of imported soybean is beneficial to food security.
Virtual water and virtual cultivated land can be used to estimate the water and soil resource gaps of different agricultural products. The total water and soil resource gaps can then be obtained. As shown in Fig. 3, soybean has the largest water and soil resource gap, followed by corn, which offers a slight increase and reaches a peak by 2048 and 2045, respectively. The peak value of the virtual arable land gap was 6.147×10⁷ hm2 (2048), which is equivalent to 45.5% of China’s arable land in 2017. As shown in Fig. 4, virtual water imports will gradually increase, and it is expected that the net imported virtual water will reach a peak by 2045 (3.247×10¹¹ m3), accounting for the total agricultural water consumption in 2017 (3.791×10¹¹ m3, 85.65%).
《Fig. 3》

Fig. 3. Imports of different crops and total virtual arable land.
Source: CASM simulated net import and virtual cultivated land coefficient estimation.
《Fig. 4》
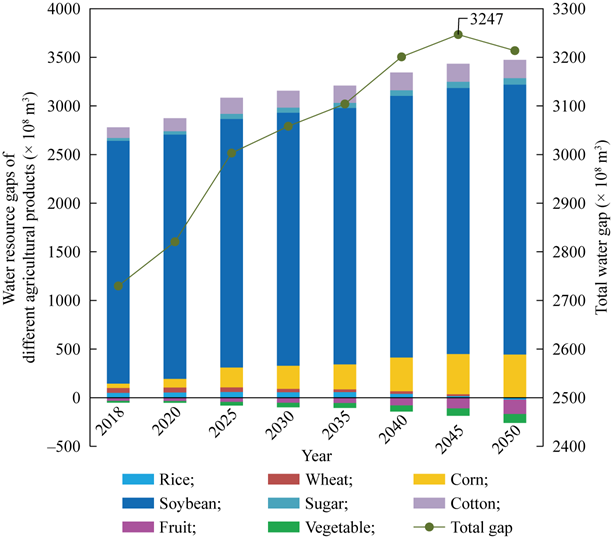
Fig. 4. Different crops and total virtual water imports.
Source: Based on CASM simulated net import and virtual water coefficient estimation.
Virtual water import is the total water demand estimated according to the total grain gap, which can be divided into blue water and green water; the former refers to the water in rivers, lakes, and underground aquifers, and the latter refers to the rainwater stored in the soil at the roots of plants. The concept of blue water can more accurately represent imported virtual water resources, which generally account for approximately 35% of the total precipitation. Based on blue water, virtual water imports in 2045 will be approximately 1.136×10¹¹ m3, accounting for 29.97% of total agricultural water consumption in 2017.
《4.2 Analysis of import sources and potential of virtual agricultural water and soil resources》
4.2 Analysis of import sources and potential of virtual agricultural water and soil resources
4.2.1 Import source analysis
In 2016, the top 15 countries in corn, rice, wheat, and soybean exports accounted for 96%, 94%, 90%, and 99%, respectively. The United States, Argentina, Russia, France, Canada, and Ukraine are the major grain exporters. According to the trade database from Food and Agriculture Organization of the United Nations, the major exportors of corn are the United States, Argentina, Brazil, Ukraine, France, and Russia. The major exportors of rice are Thailand, India, Vietnam, Pakistan, the United States, and Uruguay, and the major exportors of wheat are Russia, the United States, Canada, France, Australia, and Ukraine. The main exporters of soybean are Brazil, the United States, Argentina, Paraguay, Canada, and Uruguay. Therefore, the primary sources of food imports for China may include the United States, India, Brazil, Argentina, Canada, Russia, Ukraine, Bangladesh, and Australia; the primary sources of animal product imports include Germany, France, Poland, the Netherlands, Brazil, Germany, Canada, Argentina, the United States, and New Zealand.
4.2.2 Distribution of international import potential
From the perspective of international grain trade, international geopolitics, and the potential for arable land development, China’s international grain import potential comes mainly from two kinds of international grain-exporting countries. The category of international food exports includes European and American modern major grain-producing countries, such as the United States, Canada, Australia, Germany, France, and the United Kingdom. The country’s food production has a high degree of mechanization and commercialization, high efficiency of agricultural output, international trade, and imports of possible cooperation. The second category is countries with high potentials of arable land increase, including countries of South America and Africa (such as Brazil, Argentina, Mozambique, Nigeria, and Ethiopia). Although the current agricultural production efficiency is low, agriculture science and technology exchange can be strengthened through agricultural cooperation along the Belt and Road, thereby rapidly improving the level of agricultural total factor productivity and yield. It is a feasible cooperative object to establish grain collection, storage, and production bases and to import and reserve grain in China.
Countries along the Belt and Road with grain export potential should pay more attention to their future cultivated-land development potential. Using the land-use database of the Food and Agriculture Organization of the United Nations and considering the changes in population and food consumption by 2035 and 2050, Brazil is estimated to have the largest potential arable land area (about 1.7×10⁸ hm2), followed by Russia (7.7×10⁷ hm2). Countries with the highest potential for arable land in the subregion are mainly in Africa, followed by South America (Table 4).
Table 4. International distribution of cultivated land import potential (Unit: ×104 hm2).
《Table 4》
| Area | Country | 2017 | 2035 | 2050 |
| Potential arable land area | Exportable potential arable land | Exportable potential arable land | ||
| South America | Brazil | 17 214.8 | 17 048.85 | 17 029.09 |
| Argentina | 5735.1 | 5678.79 | 5648.13 | |
| venezuela | 4089.4 | 4037 | 4013.15 | |
| Paraguay | 1366.9 | 1355.53 | 1350.35 | |
| Uruguay | 1223.8 | 1222.37 | 1222.17 | |
| Eastern Europe and Central Asia | Ukraine | 1346.7 | 1382.76 | 1408.66 |
| Russia | 7661.8 | 7711.08 | 7751.16 | |
| Kazakhstan | 664 | 641.12 | 626.26 | |
| Romania | 491 | 505.21 | 517.05 | |
| Bulgaria | 348.4 | 356.13 | 361.58 | |
| Hungary, | 251.2 | 257.18 | 262.65 | |
| Tajikistan | 103 | 77.15 | 58.56 | |
| Southeast Asia | Myanmar | 883.3 | 824.46 | 811.96 |
| Thailand | 794.9 | 793.55 | 823.99 | |
| Cambodia, | 346.9 | 315.91 | 299.17 | |
| Laos | 318.3 | 305.31 | 300.01 | |
| Vietnam | 275 | 162.94 | 123.5 | |
| Africa | Mozambique | 4823.8 | 4669.03 | 4521.37 |
| Tanzania, | 3985.5 | 3664.24 | 3344.46 | |
| Nigeria | 2146.1 | 1259.13 | 402.04 | |
| Ethiopia | 2028 | 1627.35 | 1346.16 | |
| Kenya | 1176.1 | 972.88 | 812.87 | |
| South Africa | 922.3 | 837.61 | 795.02 |
Combined with the major grain crop yield per unit area in the future, the world corn potential production is estimated to be approximately 1.2×10⁹ t. Soybeans are approximately 1×10⁹ t, rice is approximately 9×10⁷ t, and wheat is approximately 1×10⁸ t. Therefore, the international grain export potential is relatively sufficient. China can adopt foreign agricultural science and technology cooperation to increase the grain yield per unit area in some countries and establish overseas grain production and storage bases to ensure food security.
《5 Conclusions and prospects》
5 Conclusions and prospects
Agricultural resources are essential for supporting food security. By 2050, China’s agricultural economic development pattern and household consumption structure are expected to be transformed and upgraded. China’s grain production will have entered a high-quality development stage, with high yield, high quality, high efficiency, and green as the core. The total population and population structure will undergo significant changes, the urbanization rate will gradually increase, and the gap between urban and rural areas will narrow significantly. The increase in residents’ income will promote the upgrading of the dietary structure, and an increase in meat consumption will lead to a rapid increase in feed grain demand. The total grain demand in China is expected to peak in 2035–2040, putting tremendous pressure on domestic agricultural resources. With the high-quality agricultural development and constrained by the carbon peak and carbon nuturality goals, green production and fallow crop rotation policy will be implemented. The multifunctions of agricultural production in ecological restoration, biodiversity conservation, leisure tourism, and cultural heritage will be achieved, and grain yield increase will no longer be the only goal of agricultural production.
Together, there is a need to plan to use both international and domestic resources and markets. The imports of crop varieties (such as soybean, corn, and grains) with low domestic total factor productivity and environmental efficiency, thus to make full use of international water and soil resources, increase the imports of virtual water and virtual farmland, and better meet the shortfall of grain production in China. The study shows that the import of virtual arable land will reach its peak (around 6.147×10⁷ hm2 by 2048). Virtual water imports will peak around 2045 (3.247×10¹¹ m3), accounting for 85.65% of the total agricultural water consumption in 2017. Estimated using blue water, the virtual water import volume is 1.136×10¹¹ m3, accounting for 30% of the total agricultural water consumption in 2017.
Based on the balance of agricultural resources and grain supply and demand by 2050, the utilization targets of China’s agricultural water and soil resources have been prospected. (1) Agricultural water targets. By 2035, agricultural water use will be controlled at 3.6×10¹¹ m3 or so. The area of high-efficiency water-saving irrigation will account for 85% of the northern irrigated region, and the effective utilization coefficient of farmland irrigation water will reach 0.7. Non-conventional water, such as salty water, reclaimed water, and rainwater, will account for 10% of agricultural water consumption. The continuous decline of groundwater levels in over-exploited areas will be curbed, and aquatic living resources will be effectively recovered. By 2050, agricultural water use will be controlled at 3.5×10¹¹ m3 or so; the area of high-efficiency water-saving irrigation in northern irrigated areas will account for 90%, the effective utilization coefficient of farmland irrigation water will reach 0.75, and non-conventional water, such as brackish water, reclaimed water, and rainwater will account for 20% of agricultural water (2) Objectives of cultivated land protection. By 2035, the red line of cultivated land will remain at 1.243×10⁸ hm2, and the grain sown area will not be less than 1.033×10⁸ hm2. The soil fertility of cultivated land will increase by 0.5, and that of high-standard farmland will increase by 1 grade on average. The soil organic matter content of the cultivated land will increase by 0.5% on average, and the thickness of the tillage layer will reach 25 cm on average. Saline-alkali land resources will be actively utilized and fully developed, and the utilization rate of saline-alkali wasteland will reach 20%. New farming systems, such as crop rotation and fallow, will be implemented across the board. Sustainable cultivated land use will be developed to ensure efficient resource utilization, stable quality, and environmental safety. By 2050, the arable land area will not be less than 1.2×10⁸ hm2, and the grain sown area will not be less than 1×10⁸ hm2. A long-term mechanism will be developed for agricultural resources to recuperate and improve fertility.
《Compliance with ethics guidelines》
Compliance with ethics guidelines
The authors declare that they have no conflict of interest or financial conflicts to disclose.


 京公网安备 11010502051620号


