

《1. Introduction》
1. Introduction
The environmental benefit of hydrogen (H2) as an energy vector stems from its zero carbon footprint [1–4]. However, more than 95% of H2 is currently produced from fossil fuels worldwide, leading to even more production of carbon dioxide (CO2) than that produced from the direct use of fossil fuels [5]. Hence, it is necessary to minimize the dependence on fossil fuels and to shift toward renewable and clean resources for hydrogen production [6,7]. Ethanol (C2H5OH) is the most widely used liquid fuel made from renewable biomass and has a relatively high H/C ratio, which is desirable for hydrogen production [8]. Ethanol can be reacted directly with water through steam reforming to produce a H2- rich gas over 3d transition metal catalysts (Eq. (1)) [9]. This process utilizes the raw product of bioethanol, which avoids the energyconsuming distillation separation of the ethanol–water mixture[9–11].

However, ethanol steam reforming is a strongly endothermic reaction. Chemical looping steam reforming (CLSR), as a process intensification technology, can be employed to promote the efficiency of the steam reforming process [12,13]. In the CLSR of ethanol, the oxygen carrier (OC) is first reduced by ethanol in a reforming reactor. For example, when NiO is used as the OC, the redox reaction between C2H5OH and NiO is carried out as shown in Eq. (2).

The Ni2+ in NiO is reduced to metallic nickel (Ni) with the depletion of oxygen (O). Next, ethanol steam reforming occurs with the catalysis of metallic Ni (Eq. (1)). The thermal decomposition of ethanol is also carried out on the surface of the Ni when the steam-to-carbon ratio (S/C) is low (Eq. (3)):

All of Eqs. (1)–(3) are endothermic. Ni is then re-oxidized by air in a regeneration reactor (Eq. (4)). The deposited carbon (C) formed during ethanol steam reforming is also gasified (Eq. (5)).


The heat required for endothermic steam reforming can be supplied from the oxidation of OCs (Eq. (4)) and deposited carbon (Eq. (5)) in the regeneration reactor. Therefore, the excess heat required from an external burner can be minimized. The overall reaction of the CLSR of ethanol can be regarded as the sum of ethanol steam reforming and the complete oxidation of ethanol (Eq. (6)).

The OCs, which are normally reducible metal oxides, play essential roles in the CLSR of ethanol. The use of metal oxides instead of gaseous oxygen (O2) as the OCs help to avoid safety risks during operation [8]. The extra oxygen from the OCs can remarkably reduce the S/C of the CLSR, which may lead to autothermal hydrogen production from renewable feedstock with an appropriate ratio of ethanol to OC. The OCs in chemical looping processes must meet a number of criteria for practical applications [14,15]. They must exhibit long-term redox stability and provide oxygen species with suitable activity [16]. NiO, as an outstanding candidate, has been investigated for use as the OC in various chemical looping processes [17]. Jiang et al. [18] applied NiO/montmorillonite in the CLSR of ethanol and achieved greater than 60% H2 selectivity in 20 cycles. However, the oxygen release of bulk NiO is too drastic, and the dispersion of the Ni derived from bulk NiO is relatively inadequate for the activation of reactive species and long-term operation, which limits the stability of Ni-based OCs [19–21]. The regulation of the reduction kinetics is the key to obtaining highly dispersed Ni and further promoting the performance of Ni-based OCs.
Due to the similar atomic sizes of Ni2+ (69 pm) and Mg2+ (72 pm), a substitutional NixMg1–xO solid solution in any proportion (0 ≤ x ≤ 1) can be formed by means of an adequate calcination temperature [22–24]. The Ni–Ni boundary is isolated by the Mg2+ in NixMg1–xO; thus, the rapid movement of Ni2+ is inhibited in the solid solution [25]. The reduction of the solid solution is related to the rate of bulk Ni2+ diffusion and can be tuned by the concentration of Ni2+ in NixMg1–xO [26]. Huang et al. [27] designed Mg–Ni–Al–O OCs with a solid solution structure and achieved excellent performance in chemical looping combustion. NixMg1–xO shows great potential for chemical looping processes, although the applicability of NixMg1–xO solid solutions as OCs in the CLSR of ethanol remains unclear.
In this work, NixMg1–xO solid solutions with different chemical compositions were synthesized as OCs to investigate the modulation effect of Mg2+ on the CLSR of ethanol. With the introduction of Mg2+, the oxygen release of Ni-based OCs was tunable. The relationship between the structural evolution of NixMg1–xO and the mechanism of the surface reaction was investigated. Ethanol–water pulse and H2-temperature-programmed reduction (TPR) experiments were applied to explore the oxygen release of NixMg1–xO. An in situ diffuse reflectance infrared Fourier-transform spectroscopy (DRIFTS) experiment was also carried out to determine the changes in intermediates during the CLSR of ethanol.
《2. Material and methods》
2. Material and methods
《2.1. Preparation of OCs》
2.1. Preparation of OCs
A series of NixMg1–xO (x = 0.2, 0.4, 0.6, and 0.8) solid solutions was synthesized using a co-precipitation method. Typically, a mixture of Mg(NO3)2·6H2O (98%, J&K Scientific Co., Ltd., China) and Ni(NO3)2·6H2O (99%, Aladdin Biological Technology Co., Ltd., China) was dissolved in 150 mL of deionized water (18.25 MΩ) with a total metal molarity of 2 mol·L-1 . Then, 100 mL of as-prepared 6 mol·L-1 NaOH (99%, Aladdin Biological Technology Co., Ltd.) solution was used as the precipitant. The formed precipitate was aged for 12 h, and the products were filtered and washed thoroughly with hot water to remove sodium. The obtained samples were dried in an oven at 125 °C for 24 h, and then calcined at 700 °C in air for 4 h with a heating rate of 10 °C·min-1 . NiO andMgO were also synthesized by the precipitation method for reference.
《2.2. Characterization of OCs》
2.2. Characterization of OCs
The crystalline structures of the samples were measured using powder X-ray diffraction (XRD; Bruker Corp., USA) with a Bruker D8 Focus equipped with Cu Kα radiation ( = 1.54056 Å, 1 Å = 10-10 m). The diffraction angle 2θ ranged from 20° to 80° with a scan speed of 8° per minute. The texture and morphology of the samples were acquired from transmission electron microscopy (TEM) characterization on a JEM-2100F transmission electron microscope (Japan Electronic Materials Corp., Japan) operated at 200 kV. The samples for TEM analysis were sonicated in ethanol and subsequently supported on copper grid-supported transparent carbon foil. The transmission electron microscope was also equipped with an energy-dispersive X-ray spectroscopy (EDS) detector (Ultim Max, Oxford Instruments, UK) for elemental analysis.
The specific surface area and pore volume of the OCs were measured by nitrogen (N2) adsorption–desorption at –196 °C using a Micromeritics Tristar II 3020 analyzer (Micromeritics Instrument Corp., USA), based on the Brunauer–Emmett–Teller (BET) and Barrett–Joyner–Halenda (BJH) methods, respectively. Before the tests, all the materials were degassed at 300 °C for 3 h. Elemental compositions of the prepared OCs were determined by means of inductively coupled plasma optical emission spectroscopy (ICPOES) (VISTA-MPX, Varian, UK). Prior to the measurements, the samples were dissolved in HNO3 solutions.
The reduction behavior of the OCs was determined by H2-TPR measurement. The experiments were performed on a Micromeritics Autochem II 2920 instrument equipped with a thermal conductivity detector (TCD; Micromeritics Instrumen Corp., USA). In a typical experiment, the sample (100 mg) was pretreated at 300 °C for 1 h under flowing argon (Ar; 30 mL·min-1 ). After the sample had cooled to 100 °C, the analysis was carried out in a mixture of 10 vol% H2 in Ar (30 mL·min-1 ) from 100 to 950 °C at 10 °C·min-1 .
To determine the transfer of oxygen species during the CLSR of ethanol, the C2H5OH–H2O mixture and O2-pulse experiments were measured on a Micromeritics Autochem II 2920 instrument equipped with a Hiden QIC-20 mass spectrometer (Hiden Analytical, USA). Prior to the experiments, all the samples were pretreated in situ using a flow of Ar (30 mL·min-1 ) at 300 °C for 1 h. Subsequently, pulses of the mixture of C2H5OH and H2O in Ar or 2% O2 in helium (He) were admitted to the reactor. The loop volume was 0.5031 mL, and the time interval between different pulses was 3 min, excluding the interference of contiguous pulses. The reactor effluent was continuously monitored by the mass spectrometer, and the gas-phase composition was calculated from the mass spectrometer signal at mass-to-charge ratios (m/z) of 44, 31, 29, 28, 27, 18, 16, and 2 for CO2, C2H5OH, acetaldehyde (CH3CHO), carbon monoxide (CO), ethene (C2H4), water (H2O), methane (CH4), and H2, respectively.
To detect the transformation of intermediates in the CLSR process, in situ DRIFTS experiments were performed on a Nicolet iS50 spectrometer (Nicolet iS50, Thermo Scientific, USA) equipped with a Harrick Scientific diffuse reflection accessory and a mercury–cadmium–telluride (MCT) detector cooled by liquid N2. All samples were pretreated at 600 °C under an Ar flow for 0.5 h, followed by purging with Ar for 1 h, and were then cooled to 400 C to obtain a background spectrum. This collected spectrum was then subtracted from the sample spectrum for each measurement under CLSR conditions.
The carbon formation on the OCs was characterized by thermogravimetric analysis (TGA; TGS-2A, Yuanbo, China) and temperature-programmed oxidation (TPO). The TGA experiment was carried out by filling 20 mg of OC into an alumina crucible. The temperature and weight change were then recorded when the temperature was increased from 50 to 900 °C with a heating rate of 10 °C·min-1 under air flow (50 mL·min-1 ). The TPO profiles of the spent OCs were obtained from the same apparatus, as described for the C2H5OH-pulse experiment. The OC (50 mg) was pretreated at 300 °C for 0.5 h under flowing Ar (30 mL·min-1 ). After the OC was cooled to 50 °C, a flow rate of 30 mL·min-1 of 10 vol% O2/He was used for oxidation, and the temperature was increased linearly from 50 to 900 °C. The CO2 in the effluent was monitored and recorded online using a mass spectrometer.
《2.3. CLSR evaluation》
2.3. CLSR evaluation
CLSR tests were conducted in a stainless-steel tubular fixed-bed reactor with an internal diameter of 20 mm and a length of 400 mm. Two grams of OC (20–40 mesh) was used for the CLSR reaction. Prior to the test, the OCs were pretreated at 600 °C for 1 h under pure N2 (200 mL·min-1 ). After purging with N2, the bed was subsequently adjusted to the designed temperature. An ethanol–water mixture with a flow rate of 0.03 mL·min-1 and a specific S/C of 1 was fed through a pump (P230, Elite, China) into a heated chamber (200 °C), where the mixture was completely evaporated in a stream of N2 (100 mL·min-1 ) to start the CLSR reaction for 1 h. Then, the reactor was heated to the desired oxidation temperature under air flow (200 mL·min-1 ) to regenerate the OC for 10 min. The gaseous products were analyzed online by an Agilent 490 Micro gas chromatograph. The gas chromatograph consisted of two different channels for gaseous product analysis. Channel 1 was equipped with a 10 m Molecular Sieve 5A column, with Ar used as the carrier gas for the quantification of permanent gases except for CO2 (H2, N2, CO, and CH4). Channel 2 was equipped with a 10 m PoraPlot Q column, with He used as the carrier gas for the detection of CO2 and C1–C3 hydrocarbons. All the gaseous products were quantified using the micro-machined thermal conductivity detectors (μTCDs) included in each channel. Liquid products were collected and analyzed over an Agilent 7890A gas chromatograph equipped with a flame ionization detector (FID). Possible liquid products including C2H5OH, CH3CHO, and acetone (CH3COCH3) were quantified over the FID with a Porapak-Q column using N2 as the carrier gas. The selectivities (Si) of the carbon-containing products were calculated by the following:

where i represents the different species in the products, and [i] represents the molar concentration of i in the products.
The H2 selectivity ( ) was calculated as follows:

where  represents the molar flow rate of hydrogen in the products, and
  represents the molar flow rate of ethanol in the reactants.
Product distributions (Pi ) were calculated as follows:

《3. Results and discussion》
3. Results and discussion
《3.1. Structural characterization of NixMg1–xO》
3.1. Structural characterization of NixMg1–xO
The physicochemical properties of the as-prepared NixMg1–xO are shown in Table 1. The specific surface area characterized by the BET method is in the range of 15–30 m2 ·g-1 , and the pore volume is in the range of 0.03–0.06 cm3 ·g-1 . The XRD patterns of NiO, MgO, and NixMg1–xO are shown in Fig. 1(a). NiO, MgO, and NixMg1–xO possess a rock salt structure. The crystalline sizes of NixMg1–xO, as calculated by the Scherrer equation, are similar. To show the influence of the content of Ni on the lattice parameter, the XRD patterns in the range of 40°–46° are provided in Fig. 1 (b). The (200) peak of NixMg1–xO shifts from 42.8° to 43.2° with increasing Ni content (i.e., from MgO to NiO). The lattice parameter of NixMg1–xO can be calculated from the peak position based on Bragg’s law (Table 1). When the lattice parameter of NixMg1–xO is correlated with the content of Ni in NixMg1–xO, a linear relationship can be verified (Fig. 1(c)), which indicates the formation of NixMg1–xO solid solutions in the corresponding Ni/Mg proportions [22].
《Fig. 1》
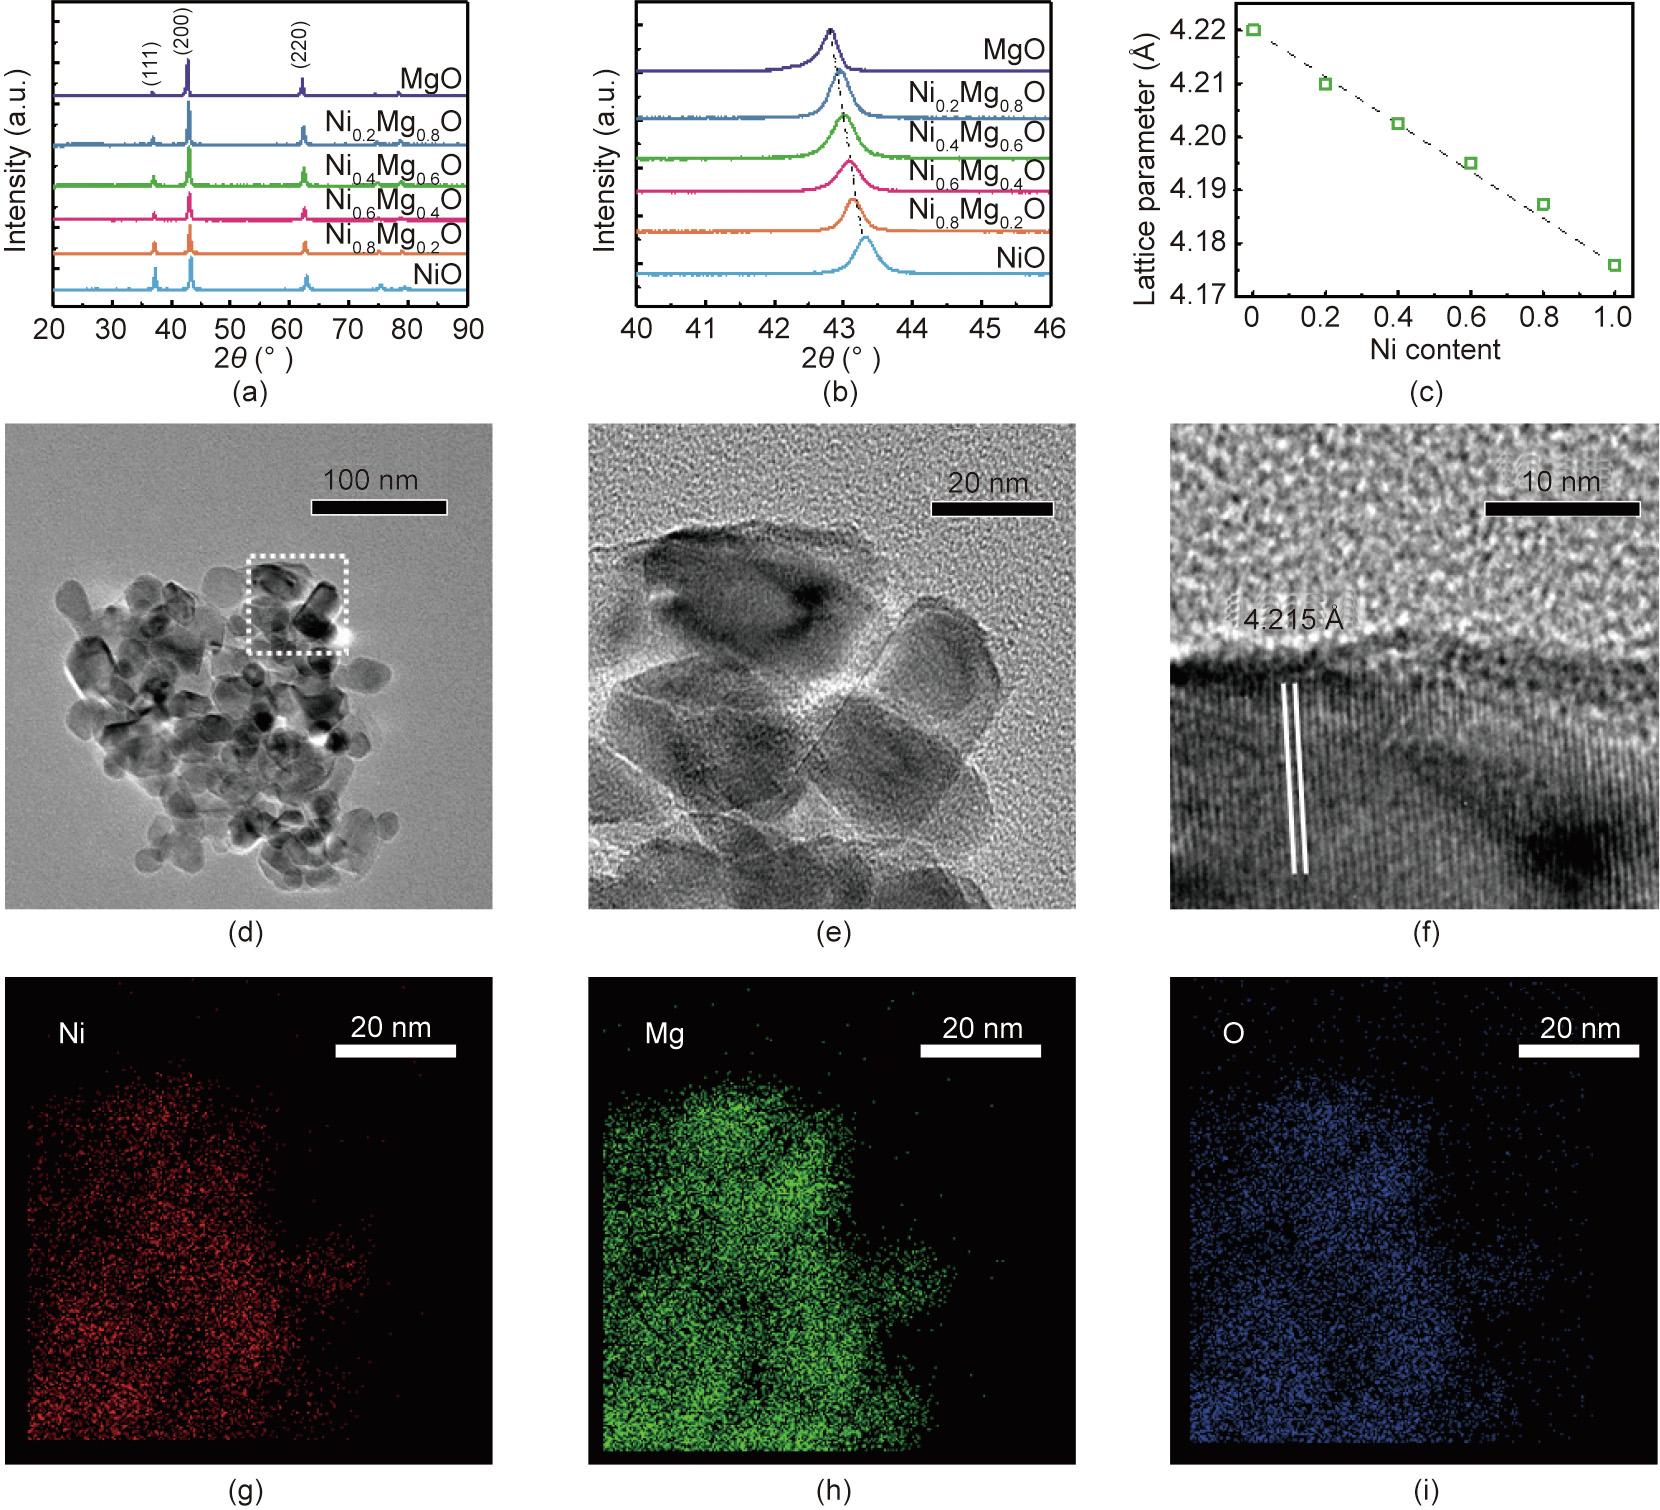
Fig. 1. Crystalline structure and morphology of NixMg1–xO. (a) XRD patterns of the as-prepared MgO, NixMg1–xO (x = 0.2, 0.4, 0.6, and 0.8), and NiO. (b) Peaks of the (200) crystal faces of MgO, NixMg1–xO, and NiO. (c) Lattice parameters of MgO, NixMg1–xO, and NiO calculated from the (200) peaks; the dashed line is the result of a linear fit between lattice parameter and Ni content in NixMg1–xO, R2 = 0.993. (d–f) TEM images of Ni0.4Mg0.6O. (g–i) EDS elemental mappings of Ni0.4Mg0.6O. a.u.: arbitrary unit.
Ni0.4Mg0.6O is selected as an example to observe the morphology of the solid solution. TEM images of Ni0.4Mg0.6O are given in Figs. 1(d)–(f). According to Figs. 1(d) and (e), the particle size of Ni0.4Mg0.6O is in the range of 10–20 nm. No segregated NiO crystals are observed. The (200) plane of NixMg1–xO with a lattice spacing of 4.215 Å can also be measured in Fig. 1(f), which is in accordance with the results of the XRD characterizations. EDS mapping was applied to probe the elemental dispersion. According to Figs. 1 (g)–(i), the distribution of Ni, Mg, and O in NixMg1–xO is homogeneous, indicating the formation of a substitutional solid solution of Ni–Mg oxide.
《3.2. CLSR of ethanol》
3.2. CLSR of ethanol
To achieve efficient hydrogen production, 400 °C was chosen as the temperature for the CLSR reaction (Fig. S1 in Appendix A). The S/C was set to 1. The selectivities of the carbon-containing products and H2 are given in Fig. 2(a). As the content of Ni increases, more CH4 is generated, which is detrimental to H2 selectivity. This phenomenon can be attributed to the poor dispersion of Ni (Table 1). CO selectivity over Ni0.2Mg0.8O is the highest among various NixMg1–xO solid solutions. The generation of CO hinders the purity of H2. In this study, Ni0.4Mg0.6O presents the maximum H2 selectivity of 4.72 mol H2 per mole ethanol.
《Table 1》
Table 1 Physicochemical properties of the as-prepared NixMg1–xO.
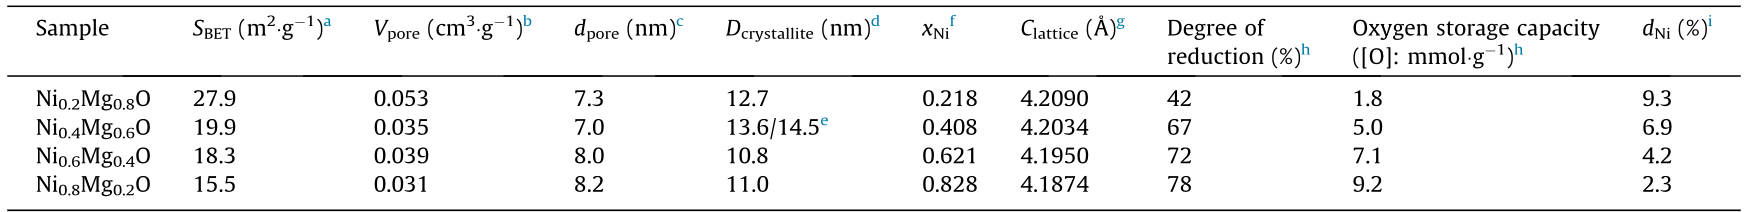
a BET specific surface area.
b Total pore volume estimated at p/p0 = 0.99.
c BJH pore diameter estimated from the adsorption branch.
d Dcrystallite: diameter of NixMg1–xO crystallite. Determined from the (200) peak of NixMg1–xO in the XRD patterns.
e The former one is for NixMg1–xO before the test and the latter one is for NixMg1–xO after 30 cycles.
f xNi: stoichiometric number of Ni in NixMg1–xO. Measured by ICP-OES.
g Clattice: lattice constant of NixMg1–xO. Calculated by the positions of the (200) peaks of NixMg1–xO in the XRD patterns.
h The degree of reduction value of Ni0 /(Ni0 + Ni2+) is calculated by NixMg1–xO after the single reaction stage in CLSR, according to the positions of the (220) peaks of NixMg1–xO in the XRD patterns.
i dNi: dispersion of Ni. Measured by the O2 pulse experiment.
We further studied the properties of Ni0.4Mg0.6O. The results from the time-on-stream test of ethanol CLSR over Ni0.4Mg0.6O at 400 °C in a single cycle are given in Fig. 2(b). The CLSR of ethanol can be generally divided into three stages based on the changes in the distribution of products. In stage I (from the start of the reaction to 6 min), CO2 is the main product. Ethanol is completely oxidized by the surface oxygen of Ni0.4Mg0.6O. In stage II (from 6 to 33 min), as more Ni2+ ions are gradually reduced to metallic Ni, the decomposition of ethanol occurs over the surface of Ni to produce H2 and CH4. The selectivity of the gaseous products is then steadily maintained. The selectivity of H2 reaches its maximum and the CO concentration is suppressed to 1% in stage II. In stage III (after 33 min) the conversion of ethanol and the selectivities of H2 and CO2 decrease with the generation of more CO and CH4. The deactivation of Ni0.4Mg0.6O occurs in this stage.
《Fig. 2》

Fig. 2. Performance for the CLSR of ethanol over NixMg1–xO. (a) H2 selectivity and carbon-containing product distribution of different NixMg1–xO solid solutions at 400 °C, during stage II in a single cycle; S/C = 1, ethanol conversion > 95%. (b) Time-on-stream test of Ni0.4Mg0.6O at 400 °C in a single cycle for the CLSR of ethanol. (c) Performance of Ni0.4Mg0.6O in the stability test of 30 cycles. (d) TEM image and EDS elemental mappings of Ni0.4Mg0.6O after 30 cycles of stability testing.
A cyclic stability test was carried out on Ni0.4Mg0.6O. After the CLSR reaction at 400 °C, the reduced Ni0.4Mg0.6O was re-oxidized and the carbon was combusted in the air at 600 °C for 10 min. This process is referred to as the ‘‘regeneration step” in our study. One cyclic test constituted 60 min of the CLSR of ethanol and 10 min of regeneration. The performance of Ni0.4Mg0.6O in the cyclic test is shown in Fig. 2(c). The selectivity of H2 over Ni0.4Mg0.6O only drops by about 3% in 30 cycles, indicating that the regeneration can recover the Ni0.4Mg0.6O. The structure of NixMg1–xO after 30 cycles was characterized by TEM and XRD (Table 1, Fig. 2(d), and Appendix A Fig. S2). The morphology and crystal structure of Ni0.4Mg0.6O remained the same after the long-term test. The solid-solution OC exists in the form of particles, without the occurrence of sintering. The crystalline size of Ni0.4Mg0.6O after the stability test was 14.2 nm, which is similar to that of fresh Ni0.4Mg0.6O. These results verify the recovery of Ni0.4Mg0.6O in the regeneration step and demonstrate the superior stability of this solid solution in the CLSR of ethanol.
《3.3. Oxygen release of NixMg1–xO》
3.3. Oxygen release of NixMg1–xO
A pulse experiment with an ethanol–water mixture (S/C = 1) over Ni0.4Mg0.6O at 400 °C was conducted in order to explore the oxygen-release process of NixMg1–xO (Fig. 3(a)). During the first five pulses, the peaks of H2 were not obvious and CO2 was the main product. This phenomenon indicates that the redox reaction between Ni0.4Mg0.6O and ethanol is dominant in this period, which corresponds to the stage I observed in the time-on-stream test of Ni0.4Mg0.6O (Fig. 2(b)). Afterward, the H2 peaks were enlarged and remained stable. CO2 became the dominant carbonaceous product, which represents the characteristics of stage II.
《Fig. 3》

Fig. 3. Oxygen-release behavior of Ni0.4Mg0.6O with ethanol. (a) Ethanol–water mixture pulse experiment on Ni0.4Mg0.6O. (b) Peaks of the (220) crystal faces of Ni0.4Mg0.6O during the pulse experiment in XRD patterns. (c) Change in the lattice parameters of Ni0.4Mg0.6O calculated from the (220) peaks during the pulse experiment. (d) Degree of reduction of Ni0.4Mg0.6O during the pulse experiment.
XRD was applied to detect the change in the composition of Ni0.4Mg0.6O during the pulse experiment. Since there may be a diffraction peak of metallic Ni at 44° near the peak, corresponding to the (200) plane of NixMg1–xO, the second strongest peak for the (220) plane of NixMg1–xO was analyzed. The XRD patterns in the range of 60°–64° for Ni0.4Mg0.6O after different pulses of the ethanol–water mixture are given in Fig. 3(b). The lattice parameter of the reduced Ni0.4Mg0.6O was calculated according to the peak position. If the distribution of Ni2+ and Mg2+ in NixMg1–xO is homogeneous, then the Ni content, x, of such a solid solution can be calculated according to Vegard’s law [28]:

where  is the lattice constant of NixMg1–xO, and the lattice constants of NiO (
 ) and MgO (
 ) were obtained from pure oxides (powder diffraction file (PDF) No. 47–1049 for NiO and PDF No. 45–0946 for MgO). Based on the calculated lattice constants of the reduced Ni0.4Mg0.6O, we obtained the Ni contents and degree of reduction of Ni0.4Mg0.6O (Figs. 3(c) and (d)).
The change in the degree of reduction of Ni0.4Mg0.6O is in accordance with the findings from the pulse experiment. In stage I, the degree of reduction of Ni0.4Mg0.6O increases rapidly. The complete oxidation of ethanol is dominant, with the generation of CO2. In stage II, H2 is formed consistently in the last three pulses. Simultaneously, oxygen release continues according to the change in the degree of reduction of Ni0.4Mg0.6O. In comparison with stage I, the rate of oxygen release in stage II drops, indicating that the oxygen from Ni0.4Mg0.6O participates in the reaction between ethanol and water to produce H2. H2 selectivity is increased due to the occurrence of water gas shift. The stoichiometric S/C in ethanol steam reforming (Eq. (1)) is 1.5, which is larger than the S/C in the CLSR and pulse experiment. Therefore, additional oxygen is necessary for stable hydrogen production in stage II. Stage II in the CLSR is carried out as follows:

where [O] represents the oxygen from NixMg1–xO.
When the active oxygen from Ni0.4Mg0.6O is depleted, the low S/ C provides insufficient oxidation capacity for the steam reforming, resulting in decreased selectivity toward H2 and CO2 (stage III in the CLSR test). Meanwhile, ethanol is decomposed to carbon, which covers the surface of the OC and leads to deactivation. TGA and O2- TPO experiments were conducted to verify this process (Fig. S3 in Appendix A). The mass increase at the beginning of the TGA analysis of the reacted Ni0.4Mg0.6O after one cycle can be attributed to the oxidation of Ni (Fig. S3(a)). The subsequent mass loss is in accordance with the peak position of CO2 in the O2-TPO, which corresponds to the gasification of the deposited carbon (Fig. S3(b)). The carbon deposition is considered to be the cause of deactivation in stage III. The results also show that the coke generated in the CLSR of ethanol can be eliminated at 600 °C in the regeneration step.
To further investigate the modulation effects of Mg2+ on NixMg1–xO, H2-TPR experiments were performed to detect the reactivity of different oxygen species in the solid solution (Fig. 4 (a)). No reduction peak was observed over pure bulk MgO up to 900 °C. The reduction peak of NiO is very broad at 200–400 °C. The H2-TPR profiles of NixMg1–xO mainly consist of a lowtemperature reduction peak at around 300 °C and a large reduction peak at 400–800 °C, indicating the existence of two types of oxygen species with different reactivities. Based on the reduction profile of NiO and the structure of NixMg1–xO, the low-temperature reduction peak of NixMg1–xO can be attributed to the release of surface oxygen. The large peak in the high-temperature range corresponds to the reduction of Ni2+ in the bulk of NixMg1–xO [29]. The temperatures of the different reduction peaks of NixMg1–xO are summarized in Fig. 4(b). The reactivity of the surface oxygen is enhanced with the increase of Ni concentration in NixMg1–xO. The reducibility of the metal oxide is related to the band gap between the valence and conduction bands [30]. Closer valence and conduction bands make metal oxides more easily reduced [30]. Previous research indicates that, when the Ni content x is greater than 0.074, the band gap of NixMg1–xO decreases linearly with x [31]. Therefore, the oxygen-release process of NixMg1–xO is inhibited with increased Mg2+ content, which aligns with the results from H2-TPR. Moreover, the coefficient of the Ni2+–Mg2+ interdiffusion increases exponentially with the concentration of Ni2+ in the air [32]. In conclusion, Ni2+ diffusion in NixMg1–xO is suppressed by the lattice confinement of Mg2+. Therefore, the reactivity of bulk oxygen decreases with the enrichment of Mg2+ in NixMg1–xO, which can be reflected by the increased reduction temperature of bulk oxygen. For the Ni0.2Mg0.8O sample, the reduction temperature for oxygen in the bulk is slightly lower than that of Ni0.4Mg0.6O. MgO formed in the surface layer prevents the deeper reduction of bulk Ni0.2Mg0.8O, lowering the apparent reduction temperature of bulk oxygen and resulting in a lower degree of reduction (Table 1).
《Fig. 4》

Fig. 4. Temperature-programmed oxygen-release behavior of NixMg1–xO. (a) H2-TPR profiles of NiO, NixMg1–xO (x = 0.2, 0.4, 0.6, and 0.8), and MgO; (b) temperatures for surface oxygen and bulk oxygen release over NixMg1–xO (x = 0.2, 0.4, 0.6, and 0.8) and NiO.
《3.4. Proposed reaction pathway over NixMg1–xO》
3.4. Proposed reaction pathway over NixMg1–xO
To investigate the reaction pathway over NixMg1–xO, in situ DRIFTS experiments were carried out (Fig. S4 in Appendix A). The spectra collected at different times during the reaction were divided into three distinct stages. To observe the changes of the Ccontaining surface species over Ni0.4Mg0.6O, the in situ DRIFTS spectra in the range from 2400 to 800 cm-1 were obtained, and are presented in Fig. 5.
《Fig. 5》

Fig. 5. Changes of C-containing surface species during in situ DRIFTS with the ethanol–water mixture (S/C = 1) reacting with Ni0.4Mg0.6O at 400 °C. K–M: Kubelka–Munk.
At the beginning of the reaction, the infrared (IR) peaks of gaseous CO2 at 2350 cm-1 and CO32– at 1510 and 1240 cm-1 were observed [33]. The generation of CO2 and CO32– can be attributed to the complete oxidation of ethanol by surface oxygen, corresponding to stage I observed in the time-on-stream test. As the reaction proceeds, CO is generated, according to the appearance of the peak at 2170 cm-1 . The C–O bond in CH3CH2O* at 1030 cm-1 can be seen [34]. The peaks at 1740 and 1580 cm-1 are assigned to the C=O bond in CH3COO*, which is a characteristic intermediate over Ni-based catalysts in ethanol steam reforming, corresponding to stage II [35]. The IR peaks indicate that the decomposition of ethanol into CH3CH2O* occurs over metallic Ni, and the CH3CH2O* is further oxidized to CH3COO*. According to the evidence of the changes in the degree of reduction, water may work collaboratively with the bulk oxygen of NixMg1–xO to oxidize ethanol in stage II. In stage III, the CO32– peak disappears gradually, and the intensity of the acetate peak increases. Moreover, the peak at 880 cm-1 for the C–H bond in gaseous CH4 also appears in this stage. The multiple peaks in the range from 1600 to 1400 cm-1 correspond to the C–H vibration of the deposited carbon [36]. The changes in the intermediates indicate the occurrence of the decomposition of ethanol to generate CH4 and carbon in this stage. Due to the low S/C, the oxidation capacity of water is insufficient to convert the surface C-containing species to CO2. The proposed surface reaction pathway of ethanol for the CLSR of ethanol over NixMg1–xO is in line with the structural evolution of solid solution (Fig. 6).
《Fig. 6》

Fig. 6. Schematic illustration of the relationship between oxygen species and the surface reaction pathway over NixMg1–xO during the CLSR of ethanol.
《4. Conclusions》
4. Conclusions
NixMg1–xO solid solution was applied as a novel OC in the CLSR of ethanol for hydrogen production. The oxygen release of NixMg1–xO is regulated with the lattice confinement by Mg2+. As a result, the optimum OC, Ni0.4Mg0.6O, was found to exhibit a robust performance toward hydrogen production (4.72 mol of H2 per mole of ethanol), with an S/C of 1. A three-stage reaction mechanism of the CLSR process was proposed. In stage I, ethanol is completely oxidized by the surface oxygen of NixMg1–xO. After the depletion of the surface oxygen and the formation of surface Ni sites, ethanol is oxidized by H2O and the bulk oxygen from NixMg1–xO collaboratively, achieving the maximum efficiency for hydrogen production in stage II. Without the participation of oxygen species, ethanol steam reforming becomes the dominant process in stage III. The CLSR of ethanol using NixMg1–xO as the OC could potentially reduce the S/C in comparison with conventional steam reforming and achieve renewable hydrogen production from biomass with a minimum external heat supply. This research provides a feasible strategy for the design of a novel OC in diverse chemical looping processes with improved performance and structural stability.
《Acknowledgments》
Acknowledgments
This work was supported by National Natural Science Foundation of China (U20B6002, 51761145012, and 21525626) and the Program of Introducing Talents of Discipline to Universities (BP0618007) for financial support.
《Compliance with ethics guidelines》
Compliance with ethics guidelines
Hao Tian, Chunlei Pei, Sai Chen, Yang Wu, Zhjian Zhao, and Jinlong Gong declare that they have no conflict of interest or financial conflicts to disclose.
《Appendix A. Supplementary data》
Appendix A. Supplementary data
Supplementary data to this article can be found online at https://doi.org/10.1016/j.eng.2020.08.029.


 京公网安备 11010502051620号


