
《1. Introduction》
1. Introduction
Soft magnetic materials are of significant importance in electromagnetic conversion applications [1]. Compared with ferrites, soft magnetic alloys exhibit higher saturation magnetization and permeability, but their applications at high frequencies are restricted due to their inevitable high eddy current losses. To tackle this issue, various efforts have been dedicated to the development of soft magnetic composites (SMCs) which are composed of metallic magnetic powders embedded in an insulation matrix [2,3]. The key to obtaining such a structure lies in the insulation coating of the magnetic powders, which is indispensable for increasing the electrical resistivity and suppressing the eddy current loss [4]. The formation of this coating can be classified into two categories, depending on whether or not the elements of the metallic powders are involved in the insulation process. In the first category, sol–gel [5–7], precipitation [8], and so forth are used to obtain coatings such as Al2O3, MgO, and SiO2 with no participation of the powder elements. The coatings fabricated by such methods exhibit weak adhesion and tend to crack during compaction, resulting in a deteriorated performance. In the second category, direct reactions of the metal elements with passivation solutions such as acids and oxidizing salts are used [9,10]. Compared with the use of sol–gel and precipitation, the coatings formed by in situ reactions between the powders and oxidation solutions exhibit enhanced adhesiveness to the powders and compatibility for industrialization. For example, phosphatization is the method most widely used to generate phosphate insulation layers [11,12]. However, the resultant phosphates tend to decompose at temperatures above 600 °C [13], which limits the subsequent annealing temperature for complete stress relaxation. Consequently, there is an urgent need to develop new insulation technology to form thin and complete passivation layers with satisfactory adhesion and thermal stability. Furthermore, accurate control of the reaction conditions during wet chemical passivation based on an in-depth understanding of the kinetic and thermodynamic mechanisms is required.
In this study, based on the most frequently used FeSiAl soft magnetic alloy with high permeability, low magnetostriction, and anisotropy, a NaNO3 passivation technology is developed with both controllability and compatibility with existing industrial setups. The evolution of the composition and microstructure of the coatings under different conditions is investigated based on delicate microscopic observations and kinetic and thermodynamic analyses. The correlation between the evolution of the coating layer and the magnetic performance is also revealed.
《2. Experimental methods》
2. Experimental methods
NaNO3 solution (10.0 wt%–30.0 wt%, 30.0 mL) was used as the passivation solution at a pH ranging from 2 to 8, adjusted by means of a CH3COOH and CH3COONa buffer solution. The NaNO3, CH3COOH, and CH3COONa were all purchased from Sinopharm Chemical Reagents Co., Ltd., China. Fe–9.6 wt% Si–5.4 wt% Al powders (20.0 g) commercially available from Changsha Tijo Metal Materials Co., Ltd., China, with two different sizes were mixed (30 wt% at 50 μm and 70 wt% at 75 μm), prior to being dispersed into 30.0 mL of NaNO3 solution under constant stirring for 10 min at 25 °C. The as-coated powders were then cleaned in anhydrous ethanol (Sinopharm Chemical Reagents Co., Ltd.) and vacuum dried at 80 °C, followed by mixing with zinc stearate (0.5 wt%; Shanghai Macklin Biochemical Co., Ltd., China) as a lubricant. The composite powders were cold-compacted into toroidal cores (outer diameter = 23.6 mm, inner diameter = 14.4 mm, and thickness = 7.0 mm) at 1900 MPa. Finally, the compacted samples were subjected to annealing at 700 °C for 1 h under the protection of argon for stress relaxation.
The powder morphology was examined through scanning electron microscopy (SEM; Hitachi S-4800, Hitachi, Ltd., Japan). The chemical structures of the coatings were studied by Fouriertransform infrared (FTIR) spectroscopy (Nicolet 5700, Thermo Fisher Scientific Inc., USA) and X-ray photoelectron spectroscopy (XPS; ESCALAB 250Xi, Thermo Fisher Scientific Inc.). The composition and detailed microstructure were characterized by transmission electron microscopy (TEM; Titan G2 80–200, FEI Company Inc., USA) with selected-area electron diffraction (SAED) and energy-dispersive X-ray spectroscopy (EDS). Fig. S1 in Appendix A illustrates the preparation method used for the TEM samples with a focused ion beam (FIB). The density and open porosity of the cores were measured based on the Archimedes principle; detailed calculations are provided in the Supplementary Information in Appendix A. The electrical resistivity of the cores was examined using the four-point probe method. The core loss and effective permeability were investigated using an auto testing system (MATS-2010SA, Hunan Linkjoin Technology Co., Ltd., China) in the frequency range of 25–175 kHz at 100 mT.
《3. Results and discussion》
3. Results and discussion
《3.1. Magnetic properties of the composites》
3.1. Magnetic properties of the composites
The concentration of the NaNO3 passivation solution was varied from 10 wt% to 30 wt%; its effects on the core loss Pcv and effective permeability μe are shown in Fig. S2 in Appendix A, where 20 wt% NaNO3 passivation gives rise to the formation of thin and complete insulation layers for enhanced performance. Next, the pH of the NaNO3 solution with a concentration of 20 wt% was adjusted using a CH3COOH and CH3COONa buffer solution. Fig. 1 shows the effects of varying the pH value of the NaNO3 solution from 2 to 8 on the Pcv and μe of the SMCs at a concentration of 20 wt%. Detailed values of the Pcv and μe obtained at 50 kHz, as well as the measured density, porosity, and resistivity, are summarized in Table 1. The Pcv shows a decreasing trend as the pH value is increased to 5 (296.4 mW∙cm–3 ), followed by an increment to 660.2 mW∙cm–3 at pH 8, as shown in the inset of Fig. 1(a).
《Fig. 1》

Fig. 1. (a) Core loss (Pcv) and (b) effective permeability (μe) against frequency, taken from samples passivated by 20 wt% NaNO3 at different pH values.
《Table 1》
Table 1 Core loss (Pcv), effective permeability (μe), density, porosity, and electrical resistivity of the composites at different pH values.
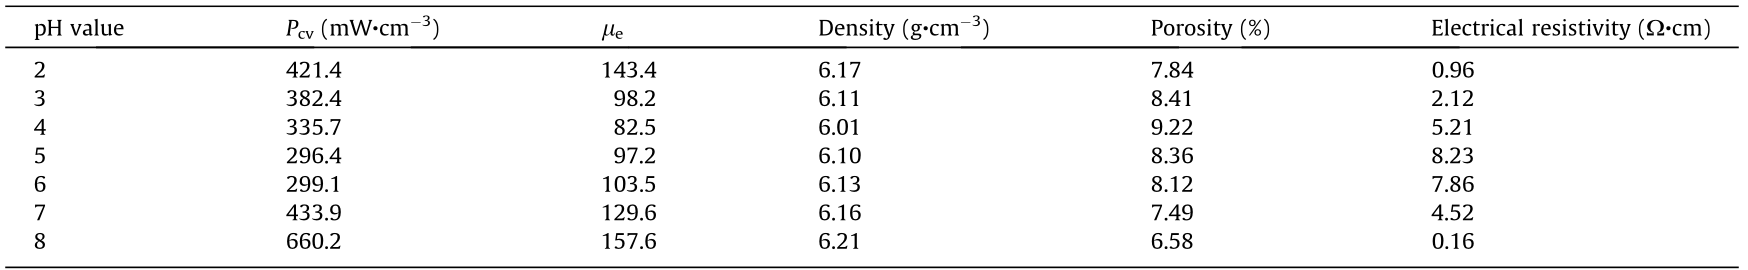
As the pH is increased from 2 to 4, the μe decreases from 143.4 to 82.5 (Fig. 1(b)). A further increase in the pH monotonically increases the μe to 157.6 at pH 8. Optimized magnetic performance (Pcv = 296.4 mW∙cm–3 and μe = 97.2) is achieved at pH 5. Further discussion on the changes in the magnetic properties will be provided in subsequent sections. Table S1 in Appendix A compares the observed core loss and permeability with those of previously reported FeSiAl SMCs prepared via other insulation methods and indicates that the SMCs fabricated here exhibit advantageous comprehensive alternating current (AC) magnetic properties.
《3.2. Insulation coating characterizations》
3.2. Insulation coating characterizations
Fig. 2 shows SEM images of the FeSiAl powders passivated with NaNO3 solution at pH values of 2, 5, and 8. A discontinuous insulation coating can be observed for the sample at pH 2, which may be due to strong surface reactions (Figs. 2(a) and (b)). The FeSiAl powder exhibits a relatively smooth surface (Fig. 2(c)) at pH 5, with a uniform insulation coating, as shown in the enlarged image in Fig. 2(d). Further increasing the pH to 8 results in incomplete insulation, as indicated by the square region in Fig. 2(e), which is enlarged in Fig. 2(f).
《Fig. 2》
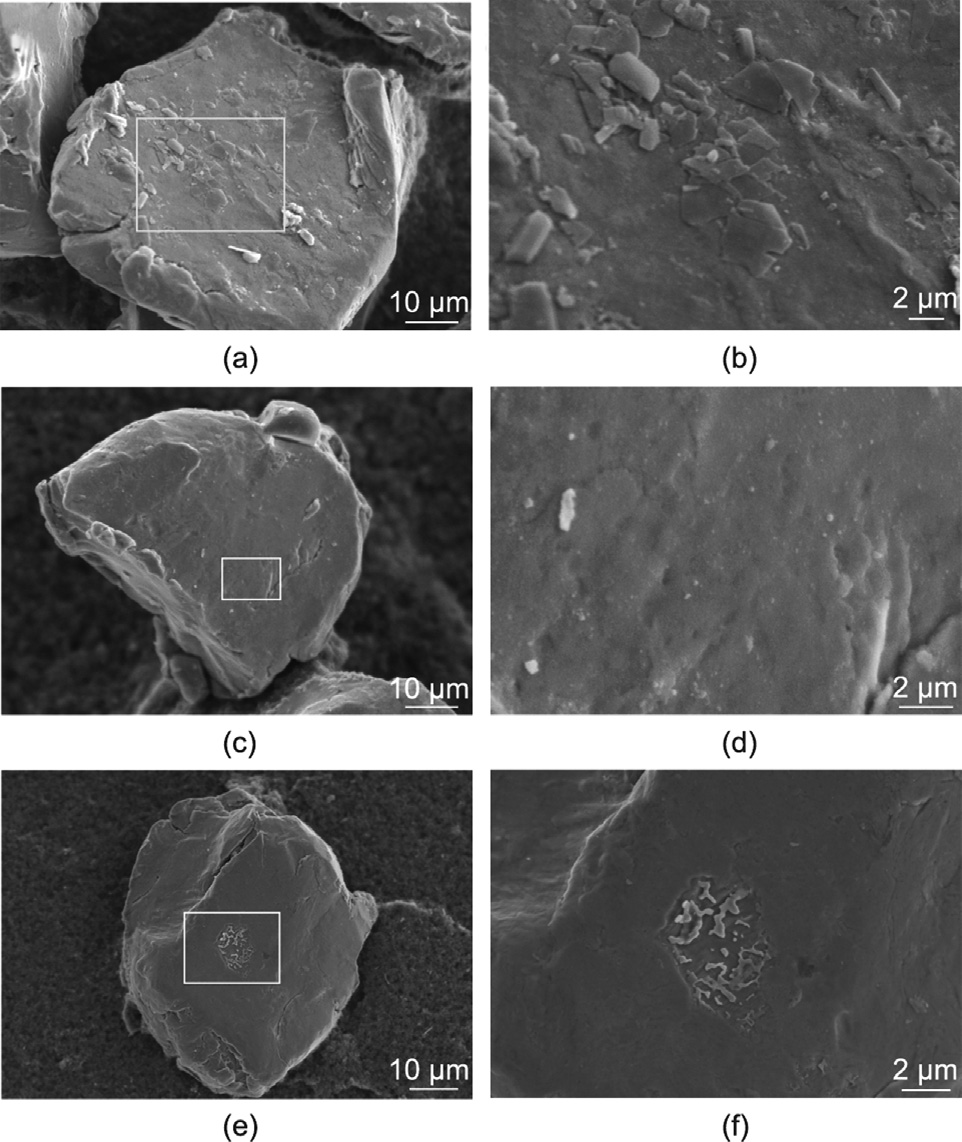
Fig. 2. SEM images of FeSiAl powders passivated by NaNO3 at a pH of (a, b) 2, (c, d) 5, and (e, f) 8. Enlarged images from the rectangles indicated in (a), (c), and (e) are shown in (b), (d), and (f).
To reveal the insulation evolution, FTIR spectra were obtained for the FeSiAl powders before and after passivation at different pH values (Fig. 3). For all the samples, the strong absorption peaks around 1630 and 3430 cm–1 correspond to the stretching bands of the adsorbed water [14]. For the uncoated FeSiAl, the band at 470 cm–1 originates from Si–O–Si stretching [15], and the peaks at 490 and 580 cm–1 can be assigned to the Fe–O bond [16,17]. The stretching vibrations of Al–O and Al–O–Al contribute to the peaks at 619 and 723 cm–1 [18]. The coexistence of Fe–O, Al–O, and Si–O suggests surface oxidation of the raw powders. For the FeSiAl powders passivated at pH 2, additional absorption bands are observed around 1430 and 1590 cm–1 , which originate from the symmetric and asymmetric stretching modes for COO–[19,20] due to the large concentration of CH3COOH in the solution. A distinctive band also appears at around 1360 cm–1 for Fe–OH [21,22], together with Al–OH absorption at 1050 and 1090 cm–1 [23–25]. When the pH of the NaNO3 solution is increased to 5, the intensity of the Fe–OH band is significantly strengthened and the Al–OH bands slightly increase, which can be attributed to the enhanced precipitation of hydroxides such as Fe(OH)3 and Al (OH)3 [26–28]. At pH 8, the band corresponding to Fe–OH almost disappears, since the Fe tends not to react with NO3– under alkaline conditions. Relatively weak bands for Al–OH are observed, which may be attributed to the growth of a thinner coating. For the sample fabricated at pH 5, the Fe–OH band almost disappears after annealing at 700 °C, while the Fe–O and Al–O bands are enhanced, indicating that the hydroxides decompose to form the corresponding oxides, while residual Al–OH bands remain due to the partial decomposition of the aluminum hydroxide.
《Fig. 3》

Fig. 3. FTIR data for uncoated FeSiAl powders and for those passivated with 20 wt% NaNO3 at different pH values.
XPS characterization was carried out for the powders passivated by NaNO3 at different pH values after annealing at 700 °C. Fig. S3 in Appendix A shows the survey spectra containing the Fe, Al, Si, and O peaks for all samples. Due to the high reactivity of the Al, it accounts for a consideration proportion of the coating layer. With increased pH, the relative Fe 2p peak intensity decreases while the Al 2p peak increases, indicating that the Fe is less likely to be oxidized in an alkaline environment while the Al follows the opposite trend. Fig. 4(a) shows a detailed Fe 2p spectrum taken from the sample passivated at pH 2; it contains Fe0 (706.2 eV) and Fe3+ (710.7 eV) peaks [29,30], as well as satellite peaks at 718.3 and 732.4 eV, which are characteristic for Fe2O3 [31]. In Fig. 4(b), two main peaks for Al3+ (74.3 eV) and Al0 (72.9 eV) [32] can be observed. The detection of Fe0 and Al0 indicates a thin insulation coating. The spectrum in Fig. 4(c) contains Si0 (98.4 eV) and Si4+ (102.1 eV), which can be assigned to Si and SiO2 [33,34]. The O 1s peak in Fig. 4(d) can be fitted with four components at 529.4, 530.3, 531.2, and 532.5 eV, which can be assigned to Fe3+, Al3+, OH– , and Si4+, respectively [31–33]. Thus, the passivation layer with NaNO3 at pH 2 mainly consists of Fe2O3, Al2O3, SiO2, and hydroxides.
《Fig. 4》

Fig. 4. XPS results illustrating the (a, e, i) Fe 2p, (b, f, j) Al 2p, (c, g, k) Si 2p, and (d, h, l) O 1s peaks for FeSiAl powders passivated by NaNO3 with different pH values of (a–d) 2, (e–h) 5, and (i–l) 8 after annealing.
When the pH is raised to 5, the Fe 2p spectrum, shown in Fig. 4(e), consists of the Fe0 (706.9 eV), Fe2+(709.2 eV), and Fe3+ (710.9 eV) peaks. The ratio of Fe2+ to Fe3+ is less than 1:2, indicating the coexistence of Fe2O3 and Fe3O4. Similarly, the Al spectrum shown in Fig. 4(f) is resolved into Al3+ and Al0 , while the Si spectrum shown in Fig. 4(g) contains the Si4+ and Si0 peaks. The O 1s peak in Fig. 4(h) is fitted with five components located at 529.1, 529.9, 530.8, 531.7, and 532.7 eV, which correspond to Fe2+, Fe3+, Al3+, OH– , and Si4+, respectively. Thus, the insulation coating obtained by means of NaNO3 at pH 5 mainly consists of Fe2O3, Fe3O4, Al2O3, SiO2, and hydroxides.
The powders passivated at pH 8 contain Fe0 and a small amount of Fe3+ (Fig. 4(i)), while the Al spectrum is resolved into Al3+ and Al0 peaks, as shown in Fig. 4(j). Fig. 4(k) shows the Si4+ and Si0 components; the Si 2p peak is shifted slightly to a low binding energy of 101.6 eV for the Si4+ with increased pH, which is similar to the findings from a previous investigation [35], indicating a decrement of the Si dissolution rate with increased pH. The O 1s spectrum is fitted with Al3+, Si4+, and OH– (Fig. 4(l)). Hence, the insulation coating obtained by means of NaNO3 at pH 8 mainly consists of Al2O3, SiO2, and hydroxides.
Fig. 5 displays cross-sectional TEM images of the oxidation layer obtained by means of NaNO3 passivation at pH 2 after annealing. The oxidation layer is indicated by the arrow in Fig. 5(a); it exhibits the characteristics of a bilayer and has a thickness of around (8.6 ± 0.5) nm. The coexistence of crystalline and amorphous regions is evidenced by the SAED pattern taken from the rectangular area indicated in Fig. 5(a) as the insert in Fig. 5(b). The spacing of the rings (2.81 Å, 1 Å = 10–10m) corresponds to AlO(OH) [36,37]. Based on the FTIR and XPS results discussed previously, the diffraction spots may be due to the formation of crystalline Al2O3 via partial decomposition of the AlO(OH) after annealing at 700 °C [38,39]. Fig. 5(c) reveals the coexistence of Fe, Si, Al, and O according to the EDS results for the oxidation layer taken from the rectangular region indicated in the high-angle annular dark-field (HAADF) image. Thus, the coating layer mainly contains Fe2O3, SiO2, Al2O3, and AlO(OH).
《Fig. 5》

Fig. 5. (a, b) TEM images, with SAED as the inset, of FeSiAl powders subjected to NaNO3 passivation at pH 2 after annealing. (c) High-angle annular dark-field (HAADF) image and EDS results illustrating the Fe, Si, Al, and O distribution.
Fig. 6(a) shows a cross-sectional TEM image taken from the sample passivated at pH 5. The coating, indicated by the arrow, exhibits bilayer characteristics with a thickness of around (11.2 ± 0.3) nm. Fig. 6(b) shows that the insulation coating contains amorphous AlO(OH) mixed with crystalline Al2O3, according to the inserted SAED pattern, while the HAADF image and EDS mappings in Fig. 6(c) indicate the presence of Al, O, and subtle Fe and Si in the coating layer
《Fig. 6》
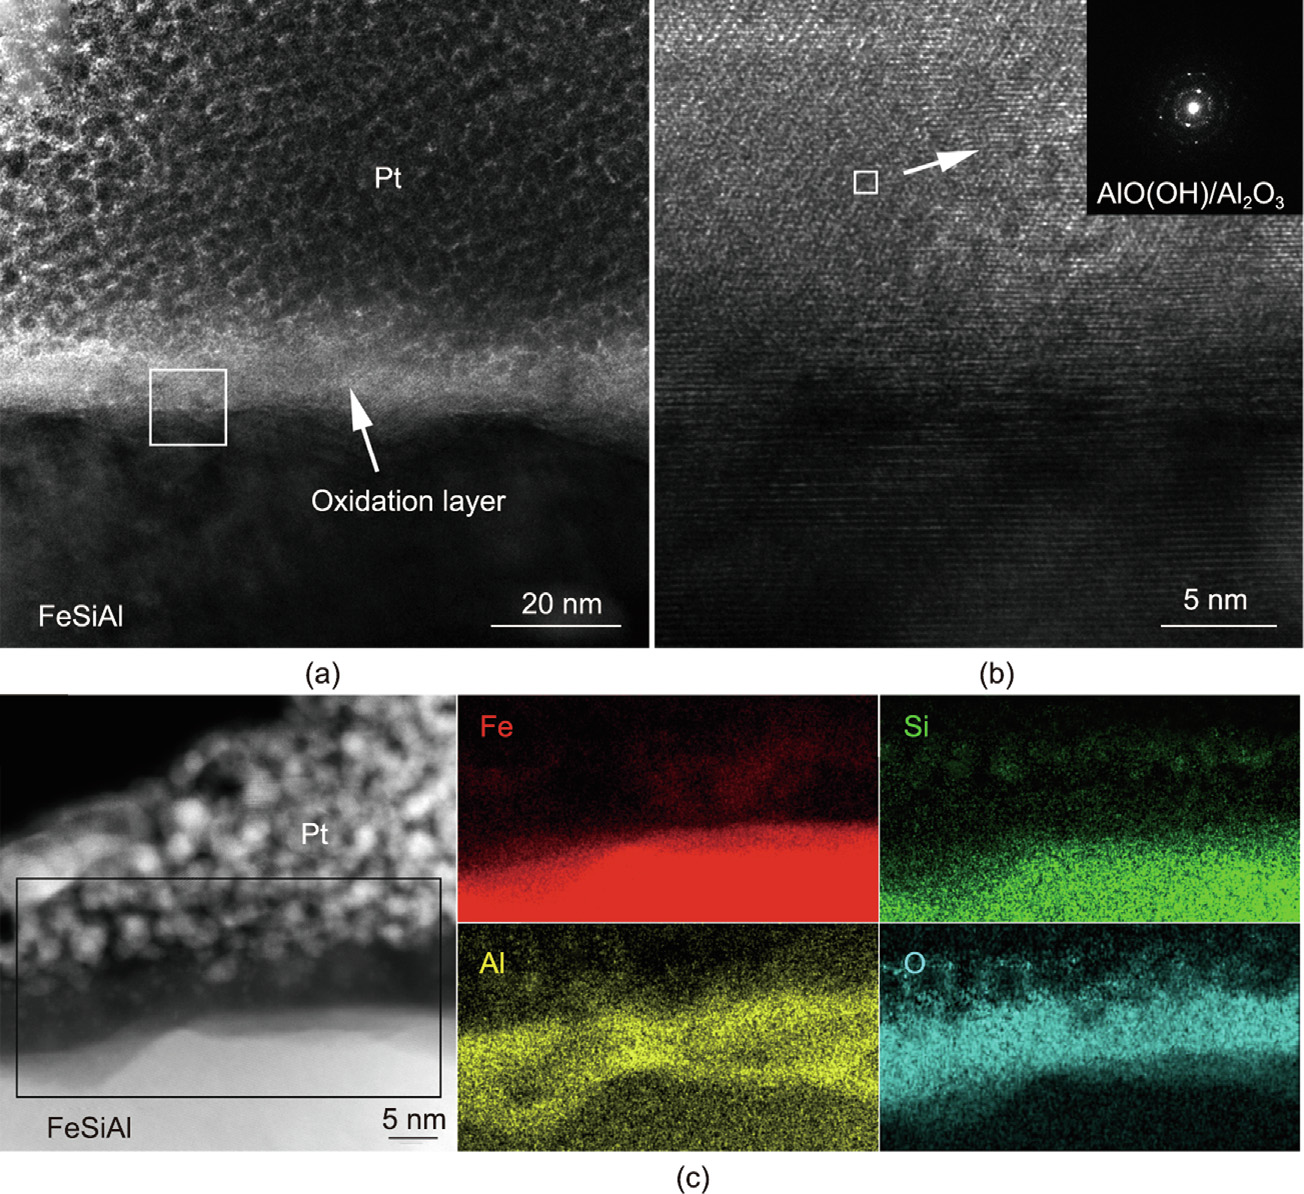
Fig. 6. (a, b) TEM images and SAED pattern of the FeSiAl powders subjected to NaNO3 passivation at pH 5 after annealing. (c) HAADF image and EDS results illustrating the Fe, Si, Al, and O distribution.
We also investigated the influence of the alkalinity, microstructure, and composition of the insulation coating obtained by NaNO3 passivation at pH 8 after annealing. A wavy interface was observed between the base metal and the coating layer (Fig. 7(a)), with an average thickness of around (6.7 ± 0.8) nm based on measurements of various regions from multiple TEM images. Fig. 7(b) shows the enlarged TEM image and SAED pattern, indicating the coexistence of amorphous AlO(OH) and polycrystalline Al2O3. The HAADF image and EDS mappings shown in Fig. 7(c) demonstrate the dominant existence of Al, Si, and O in the insulation coating. Thus, the sample passivated at pH 8 after annealing mainly forms a thin oxidation layer containing Al2O3, AlO(OH), and SiO2.
《Fig. 7》

Fig. 7. (a, b) TEM images and SAED pattern taken from the FeSiAl powders subjected to NaNO3 passivation at pH 8 after annealing. (c) HAADF image and EDS results illustrating the Fe, Si, Al, and O distribution.
《3.3. Growth mechanism of the insulation coatings》
3.3. Growth mechanism of the insulation coatings
Fig. 8 illustrates the growth model for the bilayer-structured coating on the surface of the FeSiAl powders, which consists of a barrier and a precipitation layer [40]. During passivation, partial Fe, Al, and Si atoms are directly oxidized into Fe2O3, Fe3O4, Al2O3, and SiO2, forming an inner oxide layer. Cations such as Fe3+ and Al3+ may transmit through the barrier layer and accumulate at the interface between the barrier layer and the NaNO3 solution to form an outer layer composed of Fe(OH)3 together with Al(OH)3 and AlO(OH) via hydrolytic precipitation.
《Fig. 8》

Fig. 8. Schematic growth of the bilayer coating on the surface of the FeSiAl powders.
At pH 2, the barrier layer is formed by the oxidation of the Fe, Al, and Si, following Reactions (1)–(3). Changes in the Gibbs free energy ( ) were estimated based on the standard entropy
  and enthalpy of formation
  [41]. The is negative for Fe, Al, and Si oxidation, with the strongest reactivity for the Al. As a result of the excessive amount of H+ , hydroxides in the precipitation layer are subjected to dissolution [41,42].

The oxidation reactions for Al and Si at pH 5 are similar to those at pH 2. The reaction for Fe however, changes as shown below, since the oxidability of the NO3– is reduced with the decrement of H+ , resulting in Fe2+ accompanying the Fe3+. In addition, dissolution of the precipitated hydroxides is decreased due to the decreased H+ concentration.

Further increasing the pH to 8 hinders the passivating reactions due to the insufficient oxidability of the NO3–. The Fe tends not to be oxidized; moreover, the degrees of Reactions (2) and (3) are reduced. Hydrolysis precipitation may also be slow, with little dissolution. In an alkaline NaNO3 solution, local corrosion may occur on the FeSiAl powder surface (Fig. 2(e)) through the following reaction:

The kinetics for the formation of the carrier and the participation layer can be understood according to the point defect theory [43]. Reaction (6) at the interface between the metal and the barrier layer is responsible for the barrier layer growth, and its dissolution depends on Reaction (7) at the interface between the barrier layer and the precipitation layer.

where m and MM are the metal atom and cation, respectively; VO is the oxygen vacancy; MOχ/2 is the stoichiometric barrier layer oxide; χ is the oxidation state of the cation in the barrier layer; Mδ+ is the metal cation diffused into the precipitation layer; and k and k' are the rate constants for Reactions (6) and (7), respectively. The change rate of the thickness of the barrier layer can be expressed as follows [40], involving the growth rate and the dissolution rate represented on the right side of the equation.

where L is the barrier layer thickness changing over time t; Ω is the barrier layer volume per mole of cation; CH+ is the H+ concentration; and n is the kinetic order with respect to CH+ . The growth constant k is related to the electrode potential  of the reaction between Fe, Al, Si, and NO3– during the passivation process [40,43]. The potential can be calculated based on the Nernst equation [41]:

where  is the NO3– concentration,
  is the standard electrode potential, PNO is the partial pressure of the NO, and
  is the standard pressure.
Fig. 9 illustrates the evolution of the insulation layer at different pH values. At pH 2, abundant H+ results in a large  for an increased k, giving rise to rapid growth of the barrier layer. The large concentration of H+ also promotes the conversion of the metal atoms into cations, which are transmitted into the precipitation layer [44], as shown in the growth process in Fig. 9(a), consuming a significant amount of the metal atoms in the powder. During dissolution, the high CH+ leads to a high rate of barrier layer dissolution; the excessive H+ also tends to dissolve the hydroxides, reducing the thickness of the coating. As the pH is increased from 2 to 5, the decreases with reduced H+ concentration, resulting in a slightly decreased growth rate of the barrier layer and reducing the reaction of metal cations in the hydrolysis precipitation. In addition, dissolution of the bilayer is hindered, resulting in complete insulation with the maximum thickness (Fig. 9(b)). When the pH is further increased to 8, the growth of the barrier and the precipitation layer is slight despite the rather low rate of dissolution, resulting in a significantly reduced coating thickness, as shown in Fig. 9(c).
《Fig. 9》

Fig. 9. Schematic illustration showing the growth and dissolution process during the formation of passivation layers at a pH of (a) 2, (b) 5, and (c) 8.
《3.4. Correlating the insulation coating and the magnetic performance 》
3.4. Correlating the insulation coating and the magnetic performance
The changes in the performance of the SMCs shown in Fig. 1 can be explained based on the growth mechanisms of the coating layers. Increasing the pH from 2 to 5 results in an increased thickness of the mostly non-magnetic insulation layer that acts as a pinning site, leading to reduced μe. At pH 8, the μe exhibits poor frequency stability, which can be attributed to the skin effect caused by an increased eddy current [45] due to the formation of a thin and incomplete insulation coating.
The total core loss of the SMCs consists of the hysteresis loss (Ph), the eddy current loss (Pe), and the residual loss (Pr), among which the residual loss is important only at very low induction levels and at very high frequencies and is thus neglectable in this study. Consequently, the Pcv can be separated based on the following equation [46]:

where k1 and k2 are the coefficients of the hysteresis loss and the eddy current loss, respectively, and  is the frequency. Fig. 10 shows the contribution of the Ph and Pe of samples prepared at different pH values. The Ph mainly depends on the coercivity, which increases due to the growth of the insulation layer as the pinning sites for domain wall movements as the pH is increased from 2 to 5. The Ph then declines at pH 8 due to incomplete coating. The Pe is determined by the electrical resistivity of the sample, which can be significantly enhanced due to the formation of a sufficient insulation coating at pH 5.
《Fig. 10》

Fig. 10. Separation of the total loss into the hysteresis loss (Ph) and the eddy current loss (Pe) for samples prepared with different pH values.
《4. Conclusions》
4. Conclusions
This study reported on the development of NaNO3 passivation as a new insulation coating technology for the fabrication of FeSiAl SMCs. The evolution of the oxidation coatings under different conditions was unveiled using microstructural and compositional analyses of the coatings. The passivation mechanism was revealed by means of a detailed thermodynamic and kinetic analysis. Enhanced magnetic properties (μe = 97.2, Pcv = 296.4 mW·cm–3 ) were achieved for the FeSiAl SMCs by optimizing the pH value of the NaNO3 solution. The NaNO3 passivation technology developed here may not only be extendable to other magnetic alloy systems but also open up the possibility to use oxidizing agents such as nitrite, superoxide, and permanganate for advanced insulation coatings.
《Acknowledgments》
Acknowledgments
This work was supported by the National Natural Science Foundation of China (52027802) and the Key Research and Development Program of Zhejiang Province (2020C05014, 2020C01008, and 2021C01193).
《Compliance with ethics guidelines》
Compliance with ethics guidelines
Mi Yan, Qiming Chen, Dong Liu, Chen Wu, and Jian Wang declare that they have no conflict of interest or financial conflicts to disclose.
《Appendix A. Supplementary data》
Appendix A. Supplementary data
Supplementary data to this article can be found online at https://doi.org/10.1016/j.eng.2022.01.016.


 京公网安备 11010502051620号


