
2023年 第22卷 第3期
《工程(英文)》 >> 2023年 第22卷 第3期 doi: 10.1016/j.eng.2022.10.006
指纹光谱特征揭示叶斑病时空动态发展以实现显症前诊断
a College of Mechanical Engineering, Zhejiang University of Technology, Hangzhou 310023, China
b State Key Laboratory for Rice Biology, Institute of Biotechnology, Zhejiang University, Hangzhou 310058, China
c College of Biosystems Engineering and Food Science, Zhejiang University, Hangzhou 310058, China
d Department of Nutrition and Food Science, National Research Centre, Cairo 12311, Egypt
# These authors contributed equally to this work.
下一篇 上一篇
摘要
植物病原菌不断危害农业生产和粮食安全。因此,病害发展早期的动态表征对病变监测和显症前诊断至关重要。高光谱成像(HSI)在跟踪病害初始侵染部位的动态进程以进行显症前诊断方面具有巨大潜力。然而,目前尚无相关文献提取出早期感染阶段活体叶片病变组织的指纹光谱特征(FSS),也没有探究HSI的检测机制。FSS是指能够表征特定植物病害的独特、有代表性的光谱特征。在本研究中,基于时序HSI数据分析,提取了接种麦根平脐蠕孢菌(Bipolaris sorokiniana)的大麦叶片的FSS,以表征叶斑病症状发展,实现显症前诊断。还研究了叶斑病早期发展阶段叶片的光谱和生化响应。本文所提取的全波段FSS能够捕捉病变发展过程中褪绿组织和坏死组织的独特特征,从而原位可视化植物-病原菌像素级的早期互作动态进程。进一步,实现了接种后24 h 叶斑病的显症前诊断,比传统的聚合酶链式反应(PCR)测定或生化测定提前了12 h。为了揭示HSI 显症前诊断的机制,还建立了叶片的平均光谱响应与其生化指标(叶绿素、类胡萝卜素、丙二醛、抗坏血酸和还原型谷胱甘肽)之间的定量关系,回归模型在预测集的决定系数(Rp2)均高于0.84。总体结果表明,HSI反映了活体植物特性的变化,所提取的FSS可成功跟踪叶斑病发生发展的时空动态进程,实现显症前诊断。在其他植物病害上的试验表明,该方法在植物病害早期控制方面具有较大的推广潜力。
补充材料
图片
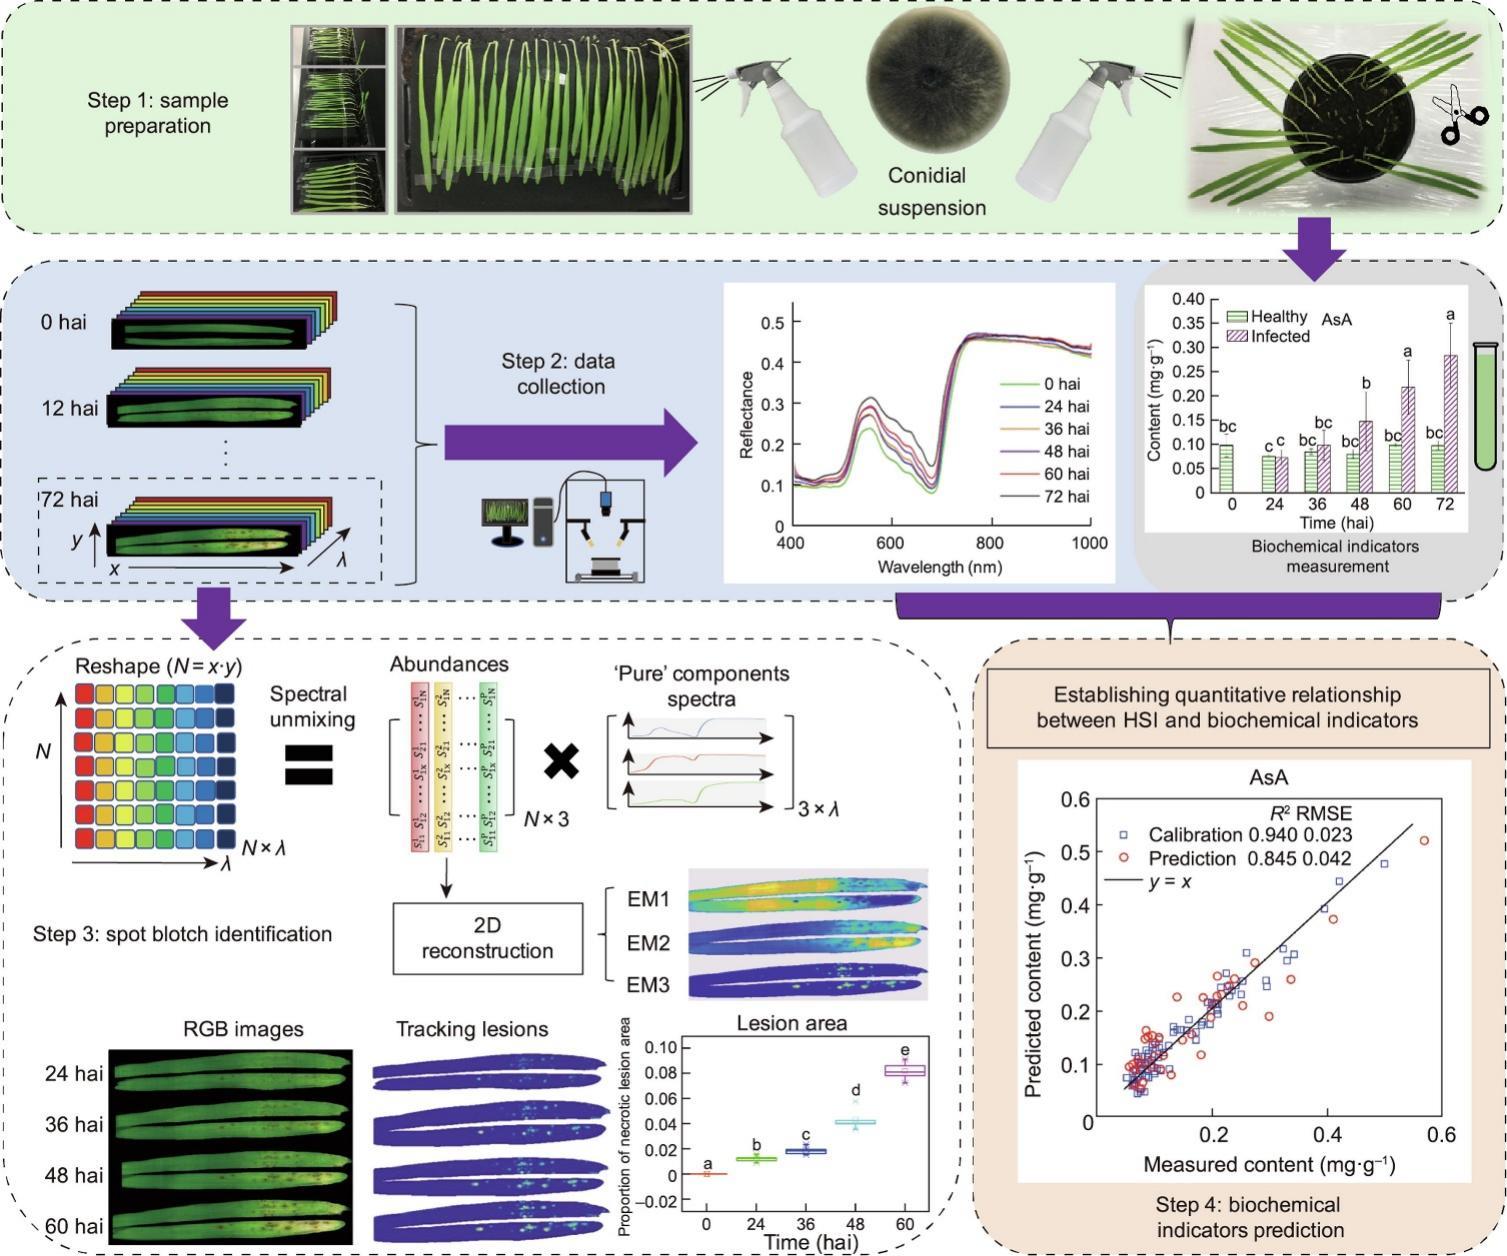
图1

图2

图3
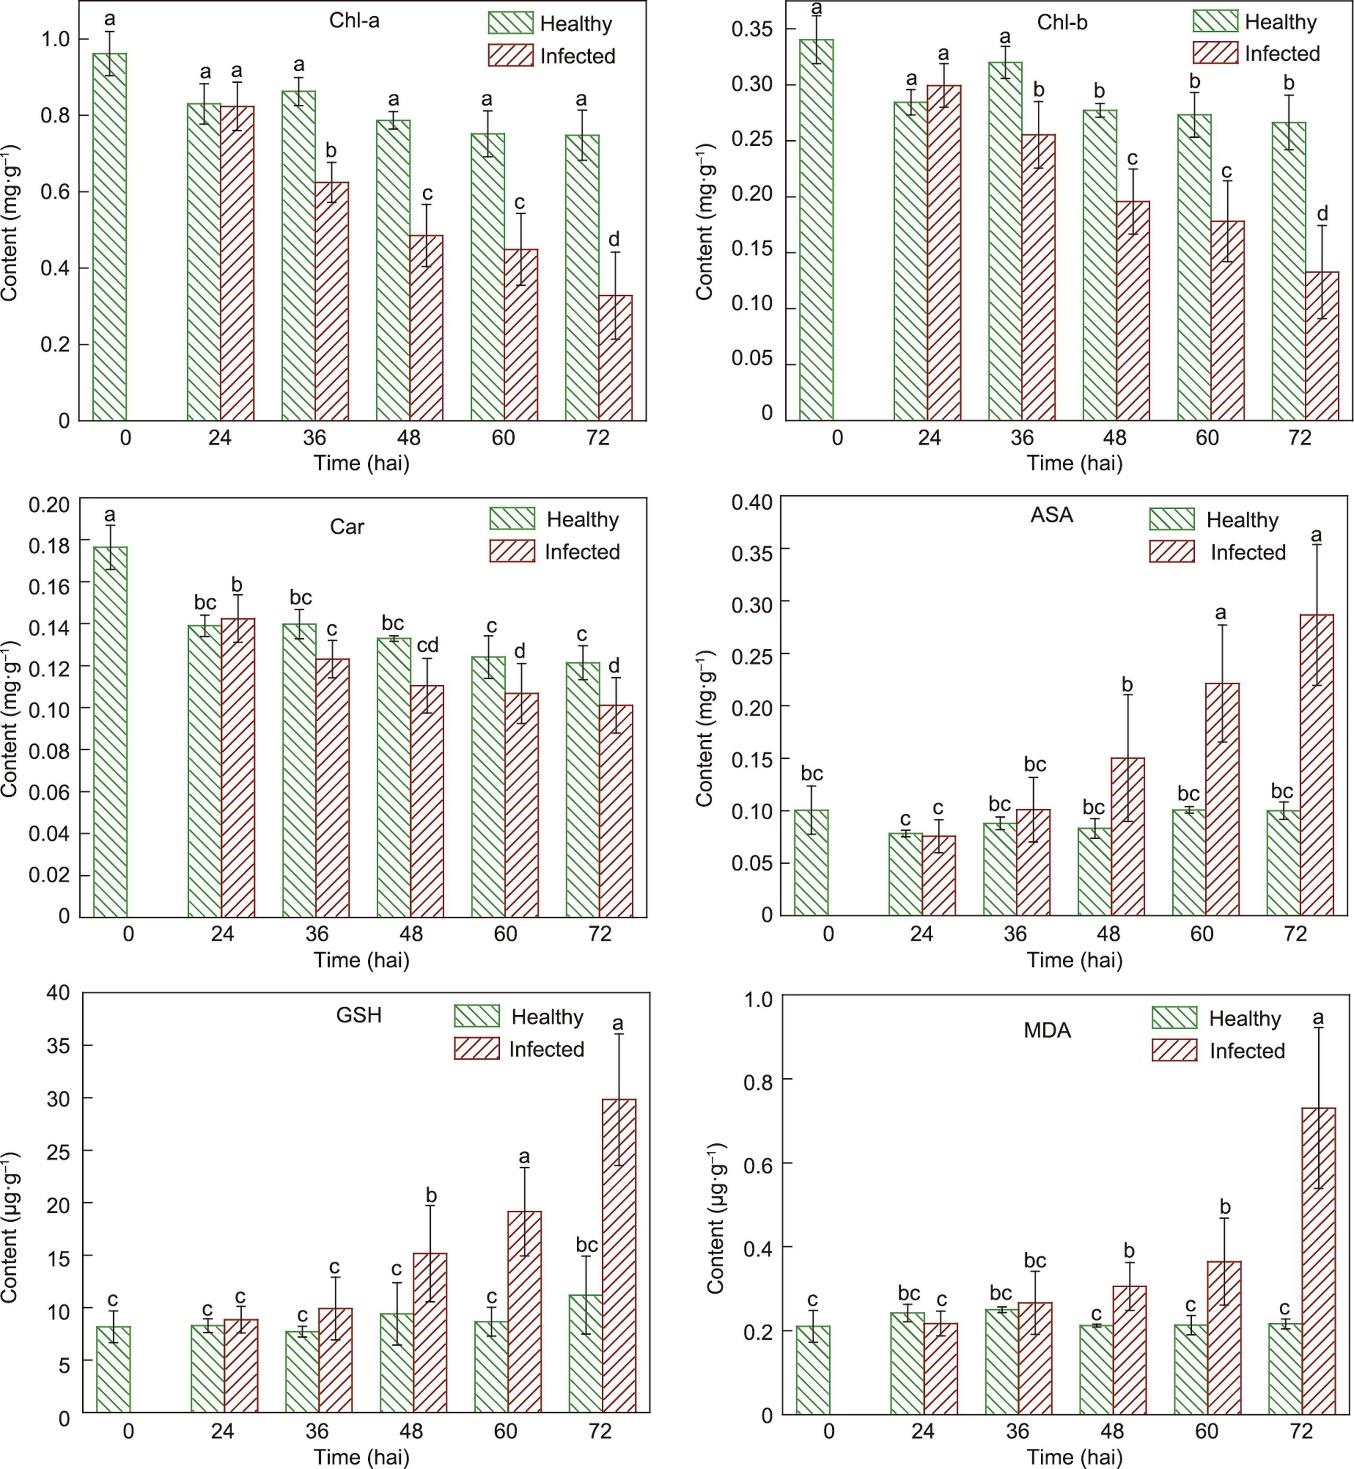
图4
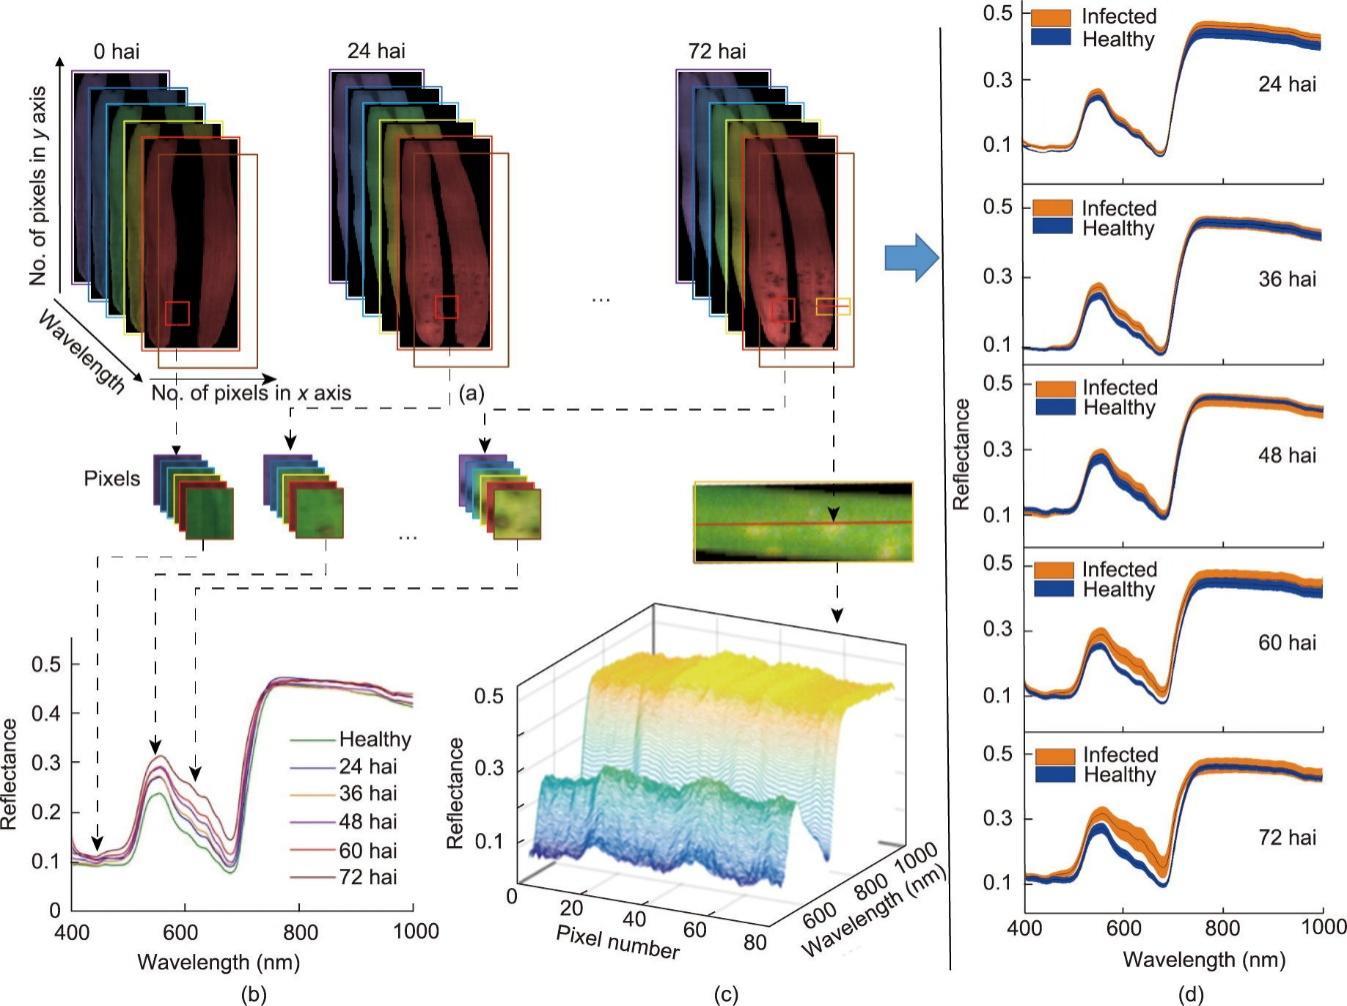
图5

图6

图7

图8

图9

图10
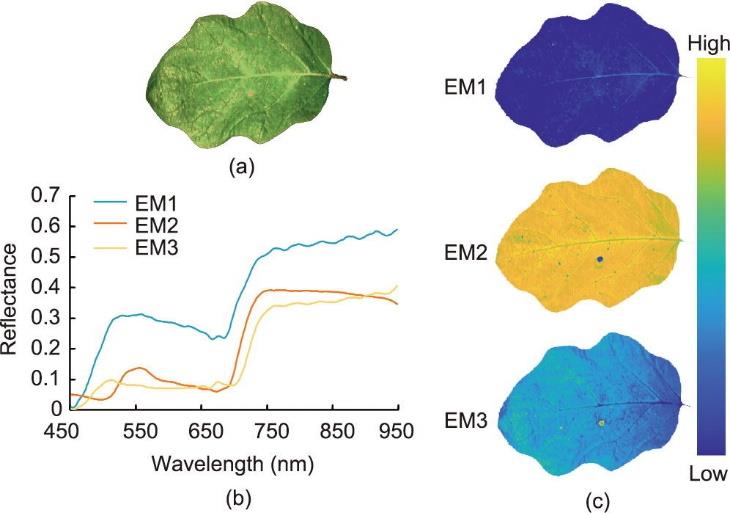
图11
图12
参考文献
[ 1 ] Kumar J, Schäfer P, Hückelhoven R, Langen G, Baltruschat H, Stein E, et al. Bipolaris sorokiniana, a cereal pathogen of global concern: cytological and molecular approaches towards better control double dagger. Mol Plant Pathol 2002;3(4):185‒95. 链接1
[ 2 ] Novakazi F, Afanasenko O, Lashina N, Platz GJ, Snowdon R, Loskutov I, et al. Genome-wide association studies in a barley (Hordeum vulgare) diversity set reveal a limited number of loci for resistance to spot blotch (Bipolaris sorokiniana). Plant Breed 2020;139(3):521‒35. 链接1
[ 3 ] Acharya K, Duta AK, Pradhan P. Bipolaris sorokiniana (Sacc.) Shoem.: the most destructive wheat fungal pathogen in the warmer areas. Aust J Crop Sci 2011;5(9):1064‒71.
[ 4 ] Gupta PK, Chand R, Vasistha NK, Pandey SP, Kumar U, Mishra VK, et al. Spot blotch disease of wheat: the current status of research on genetics and breeding. Plant Pathol 2018;67(3):508‒31. 链接1
[ 5 ] Murray TD, Parry DW, Cattlin ND. A color handbook of diseases of small grain cereal crops. Ames: Iowa State University Press; 1998. 链接1
[ 6 ] Pandey SP, Kumar S, Kumar U, Chand R, Joshi AK. Sources of inoculum and reappearance of spot blotch of wheat in rice‒wheat cropping systems in eastern India. Eur J Plant Pathol 2005;111(1):47‒55. 链接1
[ 7 ] Sharma RC, Duveiller E. Advancement toward new spot blotch resistant wheats in South Asia. Crop Sci 2007;47(3):961‒8. 链接1
[ 8 ] Kumar D, Chand R, Prasad LC, Joshi AK. A new technique for monoconidial culture of the most aggressive isolate in a given population of Bipolaris sorokiniana, cause of foliar spot blotch in wheat and barley. World J Microbiol Biotechnol 2007;23(11):1647‒51. 链接1
[ 9 ] Al-Sadi AM. Bipolaris sorokiniana-induced black point, common root rot, and spot blotch diseases of wheat: a review. Front Cell Infect Microbiol 2021;11:584899. 链接1
[10] Mahlein AK, Kuska MT, Behmann J, Polder G, Walter A. Hyperspectral sensors and imaging technologies in phytopathology: state of the art. Annu Rev Phytopathol 2018;56(1):535‒58. 链接1
[11] Martinelli F, Scalenghe R, Davino S, Panno S, Scuderi G, Ruisi P, et al. Advanced methods of plant disease detection. A review. Agron Sustain Dev 2015;35(1):1‒25. 链接1
[12] Lowe A, Harrison N, French AP. Hyperspectral image analysis techniques for the detection and classification of the early onset of plant disease and stress. Plant Methods 2017;13(1):80. 链接1
[13] Thomas S, Wahabzada M, Kuska MT, Rascher U, Mahlein AK. Observation of plant‒pathogen interaction by simultaneous hyperspectral imaging reflection and transmission measurements. Funct Plant Biol 2016;44(1):23‒34. 链接1
[14] Cen H, Weng H, Yao J, He M, Lv J, Hua S, et al. Chlorophyll fluorescence imaging uncovers photosynthetic fingerprint of citrus Huanglongbing. Front Plant Sci 2017;8:1509. 链接1
[15] Ghosal S, Blystone D, Singh AK, Ganapathysubramanian B, Singh A, Sarkar S. An explainable deep machine vision framework for plant stress phenotyping. Proc Natl Acad Sci USA 2018;115(18):4613‒8. 链接1
[16] Abdulridha J, Ampatzidis Y, Qureshi J, Roberts P. Laboratory and UAV-based identification and classification of tomato yellow leaf curl, bacterial spot, and target spot diseases in tomato utilizing hyperspectral imaging and machine learning. Remote Sens 2020;12(17):2732. 链接1
[17] Das K, Roychoudhury A. Reactive oxygen species (ROS) and response of antioxidants as ROS-scavengers during environmental stress in plants. Front Environ Sci 2014;2:53. 链接1
[18] Kaur S, Bhardwaj RD, Kaur J, Kaur S. Induction of defense-related enzymes and pathogenesis-related proteins imparts resistance to barley genotypes against spot blotch disease. J Plant Growth Regul 2021;41(2):682‒96. 链接1
[19] Zarco-Tejada PJ, Camino C, Beck PSA, Calderon R, Hornero A, Hernández-Clemente R, et al. Previsual symptoms of Xylella fastidiosa infection revealed in spectral plant-trait alterations. Nat Plants 2018;4(7):432‒9. 链接1
[20] Zhang N, Yang G, Pan Y, Yang X, Chen L, Zhao C. A review of advanced technologies and development for hyperspectral-based plant disease detection in the past three decades. Remote Sens 2020;12(19):3188. 链接1
[21] Mahlein AK, Steiner U, Hillnhütter C, Dehne HW, Oerke EC. Hyperspectral imaging for small-scale analysis of symptoms caused by different sugar beet diseases. Plant Methods 2012;8(1):3. 链接1
[22] Bendel N, Backhaus A, Kicherer A, Köckerling J, Maixner M, Jarausch B, et al. Detection of two different grapevine yellows in Vitis vinifera using hyperspectral imaging. Remote Sens 2020;12(24):4151. 链接1
[23] Shuaibu M, Lee WS, Schueller J, Gader P, Hong YK, Kim S. Unsupervised hyperspectral band selection for apple Marssonina blotch detection. Comput Electron Agric 2018;148:45‒53. 链接1
[24] Arens N, Backhaus A, Döll S, Fischer S, Seiffert U, Mock HP. Non-invasive presymptomatic detection of Cercospora beticola infection and identification of early metabolic responses in sugar beet. Front Plant Sci 2016;7:1377. 链接1
[25] Gao Z, Khot LR, Naidu RA, Zhang Q. Early detection of grapevine leafroll disease in a red-berried wine grape cultivar using hyperspectral imaging. Comput Electron Agric 2020;179:105807. 链接1
[26] Abdulridha J, Ampatzidis Y, Roberts P, Kakarla SC. Detecting powdery mildew disease in squash at different stages using UAV-based hyperspectral imaging and artificial intelligence. Biosyst Eng 2020;197:135‒48. 链接1
[27] Abdulridha J, Ampatzidis Y, Kakarla SC, Roberts P. Detection of target spot and bacterial spot diseases in tomato using UAV-based and benchtop-based hyperspectral imaging techniques. Precis Agric 2020;21(5):955‒78. 链接1
[28] Thomas S, Behmann J, Steier A, Kraska T, Muller O, Rascher U, et al. Quantitative assessment of disease severity and rating of barley cultivars based on hyperspectral imaging in a non-invasive, automated phenotyping platform. Plant Methods 2018;14(1):45. 链接1
[29] Kuska M, Wahabzada M, Leucker M, Dehne HW, Kersting K, Oerke EC, et al. Hyperspectral phenotyping on the microscopic scale: towards automated characterization of plant‒pathogen interactions. Plant Methods 2015;11(1):28. 链接1
[30] Kuska MT, Brugger A, Thomas S, Wahabzada M, Kersting K, Oerke EC, et al. Spectral patterns reveal early resistance reactions of barley against Blumeria graminis f. sp. hordei. Phytopathology 2017;107(11):1388‒98. 链接1
[31] Zhou RQ, Jin JJ, Li QM, Su ZZ, Yu XJ, Tang Y, et al. Early detection of Magnaporthe oryzae-infected barley leaves and lesion visualization based on hyperspectral imaging. Front Plant Sci 2019;9:1962. 链接1
[32] Zhu F, Zhang D, He Y, Liu F, Sun DW. Application of visible and near infrared hyperspectral imaging to differentiate between fresh and frozen‒thawed fish fillets. Food Bioprocess Technol 2013;6(10):2931‒7. 链接1
[33] Wellburn AR, Lichtenthaler H. Formulae and program to determine total carotenoids and chlorophylls A and B of leaf extracts in different solvents. In: Proceedings of the VIth International Congress on Photosynthesis; 1983 Aug 1‒6; Brussels, Belgium. Netherlands: Springer; 1984. p. 9‒12. 链接1
[34] Sanaeifar A, Zhu F, Sha J, Li X, He Y, Zhan Z. Rapid quantitative characterization of tea seedlings under lead-containing aerosol particles stress using Vis-NIR spectra. Sci Total Environ 2022;802:149824. 链接1
[35] Chen HZ, Zhang M, Guo Z. Discrimination of fresh-cut broccoli freshness by volatiles using electronic nose and gas chromatography-mass spectrometry. Postharvest Biol Technol 2019;148:168‒75. 链接1
[36] Livak KJ, Schmittgen TD. Analysis of relative gene expression data using real-time quantitative PCR and the 2-∆∆Ct method. Methods 2001;25(4):402‒8. 链接1
[37] Deshmukh S, Hückelhoven R, Schäfer P, Imani J, Sharma M, Weiss M, et al. The root endophytic fungus Piriformospora indica requires host cell death for proliferation during mutualistic symbiosis with barley. Proc Natl Acad Sci USA 2006;103(49):18450‒7. 链接1
[38] Deshmukh SD, Kogel KH. Piriformospora indica protects barley from root rot caused by Fusarium graminearum. J Plant Dis Prot 2007;114(6):263‒8. 链接1
[39] Macqueen J. Some methods for classification and analysis of multivariate observations. Proceedings of the Fifth Berkeley Symposium on Mathematical Statistics and Probability, 1967; Oakland, CA, USA. Cambridge: Cell Press; 1969.
[40] Bezdek JC, Ehrlich R, Full W. FCM: the fuzzy c-means clustering algorithm. Comput Geosci 1984;10(2‒3):191‒203.
[41] Keshava N, Mustard JF. Spectral unmixing. IEEE Signal Process Mag 2002;19(1):44‒57. 链接1
[42] Nascimento JMP, Dias JMB. Vertex component analysis: a fast algorithm to unmix hyperspectral data. IEEE Trans Geosci Remote Sens 2005;43(4):898‒910. 链接1
[43] Huang Y, Dong W, Sanaeifar A, Wang X, Luo W, Zhan B, et al. Development of simple identification models for four main catechins and caffeine in fresh green tea leaf based on visible and near-infrared spectroscopy. Comput Electron Agric 2020;173:105388. 链接1
[44] Liu Z, Cai W, Shao X. Outlier detection in near-infrared spectroscopic analysis by using Monte Carlo cross-validation. Sci China B Chem 2008;51(8):751‒9. 链接1
[45] Maldonado AIL, Rodriguez-Fuentes H, Contreras JAV. Hyperspectral imaging in agriculture, food and environment. London: IntechOpen; 2018. 链接1
[46] Tian L, Xue B, Wang Z, Li D, Yao X, Cao Q, et al. Spectroscopic detection of rice leaf blast infection from asymptomatic to mild stages with integrated machine learning and feature selection. Remote Sens Environ 2021;257:112350. 链接1
[47] Leucker M, Wahabzada M, Kersting K, Peter M, Beyer W, Steiner U, et al. Hyperspectral imaging reveals the effect of sugar beet quantitative trait loci on Cercospora leaf spot resistance. Funct Plant Biol 2017;44(1):1. 链接1
[48] Krinidis S, Chatzis V. A robust fuzzy local information c-means clustering algorithm. IEEE Trans Image Process 2010;19(5):1328‒37. 链接1
[49] Ollinger SV. Sources of variability in canopy reflectance and the convergent properties of plants. New Phytol 2011;189(2):375‒94. 链接1
[50] Cen H, He Y. Theory and application of near infrared reflectance spectroscopy in determination of food quality. Trends Food Sci Technol 2007;18(2):72‒83. 链接1
[51] Walsh KB, Blasco J, Zude-Sasse M, Sun X. Visible-NIR ‘point’ spectroscopy in postharvest fruit and vegetable assessment: the science behind three decades of commercial use. Postharvest Biol Technol 2020;168:111246. 链接1
[52] Able AJ. Role of reactive oxygen species in the response of barley to necrotrophic pathogens. Protoplasma 2003;221(1‒2):137‒43.
[53] Yusuf CS, Chand R, Mishra VK, Joshi AK. The association between leaf malondialdehyde and lignin content and resistance to spot blotch in wheat. J Phytopathol 2016;164(11‒12):896‒903.
[54] Yendrek CR, Tomaz T, Montes CM, Cao Y, Morse AM, Brown PJ, et al. High-throughput phenotyping of maize leaf physiological and biochemical traits using hyperspectral reflectance. Plant Physiol 2017;173(1):614‒26. 链接1


 京公网安备 11010502051620号


