

The Project was implemented in two parts: data analysis and expert judgment. In the data analysis stage, data on the 294 candidate engineering research hotspots and their core papers as well as ThemeScape patent maps and their core data for the 52 subject groups used for analyzing candidate engineering development hotspots were provided by Clarivate Analytics. The 318 engineering development hotspots interpreted from the ThemeScape patent maps were completed by research groups for the various fields under the leadership of the Project Team of the Chinese Academy of Engineering (CAE). In the expert judgment stage, the Project Team organized, under the guidance and assistance of CAE’s academic divisions and the “1+9” academic journals, academicians and experts to obtain 10 engineering research hotspots, 10 engineering development hotspots, three engineering research focuses, and three engineering development focuses for each field through questionnaire surveys, discussions, and group interpretation.
《1 Selection of engineering research hotspots》
1 Selection of engineering research hotspots
The engineering research hotspots identified in this report used journal and conference papers (indexed in SCI, EI, and ISTP) from the Web of ScienceTM core database of Clarivate Analytics as original data. The basis for data analysis for each field group was obtained by establishing a mapping relationship with the specialty division criteria system of CAE's academic divisions. The top 10% highly cited papers in each field were put for co-citation clustering analysis to determine their citation frequency and lifespan information and obtain 294 candidate engineering research hotspots. These candidate hotspots underwent further expert evaluation to obtain 89 engineering research hotspots. The specific process is described below.
《1.1 Acquisition and pre-processing of paper data》
1.1 Acquisition and pre-processing of paper data
As for data acquisition, the categories in Web of Science were matched with the specialties of CAE’s academic divisions to obtain a list of corresponding journals and conferences for each field. After confirmation by experts organized by the field groups, data sources totaling 12 822 journals and 28 312 conferences were obtained for analysis for various field groups (refer to Table 1.1.1 for details). In addition, a method of individual paper categorization was adopted for 58 comprehensive journals, such as Nature. In other words, the field subject group of individual paper in a journal is defined by the subject to which the reference literature of this paper mainly belongs.
On the basis of this, and with a comprehensive
《Table 1.1.1》
Table 1.1.1 Number of journals, conferences & top 10% of highly cited papers, by field
| No. | Field | Number of journals | Number of conferences | Number of highly cited papers |
| 1 | Mechanical & Vehicle Engineering | 457 | 1 768 | 38 676 |
| 2 | Information & Electronic Engineering | 986 | 9 632 | 109 507 |
| 3 | Chemical, Metallurgical & Materials Engineering | 1 128 | 2 313 | 219 081 |
| 4 | Energy & Mining Engineering | 226 | 785 | 440 641 |
| 5 | Civil, Hydraulic Engineering & Architecture | 359 | 512 | 28 384 |
| 6 | Environmental & Light and Textile Industries Engineering | 1 003 | 605 | 93 524 |
| 7 | Agriculture | 1 575 | 975 | 105 523 |
| 8 | Medicine & Health | 4 328 | 7 059 | 392 142 |
| 9 | Engineering Management | 755 | 681 | 32 927 |
Note: There are some overlapping journals, conferences, and highly cited papers between field groups.
consideration of differences between journals and conferences, year of publication, and other factors, the above literature list was searched and data were mined to obtain the top 10% of highly cited papers published in each field group between 2011 and 2016. These highly cited papers were used as the original data set for research hotspot analysis. Data collection was completed in February 2017, which was also the citation deadline.
《1.2 Paper data analysis and candidate research hotspot acquisition》
1.2 Paper data analysis and candidate research hotspot acquisition
Based on the relationship network across research themes formed through mutual citations by researchers, highly cited papers in nine fields were put for co-citation clustering analysis to obtain the clustering themes in each field. With consideration for the total number of citations, citation frequency per paper, mean year of publication, proportion of consistently cited paper, and other indicators of each clustering theme, no less than 25 candidate engineering research hotspots and five keywords were obtained for each field group. (Since some candidate hotspots have similar themes in different field groups, some field groups had more than 25 candidate hotspots in order to ensure that each field group contains at least 25 hotspots that exclusively belong to that field group. Refer to Table 1.2.1 for details.)
In addition, because each field group has different discipline characteristics and citation patterns, some fields have a relatively small amount of cited papers. Therefore, hotspots selected from the nine field groups are only defined as the most active paper clusters in their field group.
《1.3 Selection and judgment of engineering research hotspots》
1.3 Selection and judgment of engineering research hotspots
Based on the 294 candidate engineering research hotspots obtained from data mining analysis, all field groups organized academicians and experts to study core papers, combine similar hotspots, and modify hotspot names. Subsequently, online and printed survey questionnaires were distributed to solicit suggestions from academicians and experts and obtain their ballot opinions on the top 10 engineering research hotspots in each field. A total of 238 academicians and 632 non-academician experts in nine field groups took part in the survey. Based on the questionnaire statistics, and following expert discussions, examination, and verification by the executive committees of CAE’s academic divisions, 89 engineering research hotspots were obtained.
《2 Selection of engineering development hotspots》
2 Selection of engineering development hotspots
For the year 2017, the Project has obtained a total of 79 engineering development hotspots in eight fields. (For the year, the engineering management field group did not involve any engineering development hotspots.) Based on data analysis and taking the Clarivate Analytics’ Derwent World Patents Index (DWPI) database as the original data, a mapping relationship was established between Derwent
《Table 1.2.1》
Table 1.2.1 Co-citation clustering statistics, by field
| No. | Field | Number of journals | Number of conferences | Number of highly cited papers |
| 1 | Mechanical & Vehicle Engineering | 4 140 | 19 503 | 45 |
| 2 | Information & Electronic Engineering | 11 507 | 53 880 | 27 |
| 3 | Chemical, Metallurgical & Materials Engineering | 23 227 | 103 840 | 28 |
| 4 | Energy & Mining Engineering | 4 553 | 20 208 | 33 |
| 5 | Civil, Hydraulic Engineering & Architecture | 2 971 | 14 435 | 23 |
| 6 | Environmental & Light and Textile Industries Engineering | 10 239 | 46 846 | 39 |
| 7 | Agriculture | 11 613 | 51 118 | 26 |
| 8 | Medicine & Health | 40 775 | 181 062 | 25 |
| 9 | Engineering Management | 3 442 | 15 084 | 29 |
Manual Code and the specialty division criteria system of CAE’s academic divisions to obtain the basic data for analysis. The top 10 000 most cited high impact patents in 52 subject groups of eight fields were clustered to obtain 52 ThemeScape patent maps. In the expert judgment stage, 318 candidate engineering development hotspots were obtained from expert interpretation of the ThemeScape patent maps. Through questionnaire surveys and expert judgment, 79 engineering development hotspots were obtained. The specific process is described below.
《2.1 Patent data acquisition and analysis》
2.1 Patent data acquisition and analysis
For data acquisition, a matching relationship was established between Derwent Manual Code and the specialty division criteria system of CAE’s academic divisions to preliminarily determine the patent search scope for eight fields. Following field group experts’ deletions, supplements, and improvement, the patent search strategy was respectively constructed for 52 subject groups in the eight fields. Original data for patent analysis were obtained by searching DWPI database on Thomson Innovation. With comprehensive consideration to patent publication year, citation frequency of patent family, and other indicators, data were obtained on the corresponding top 10 000 highly cited core patents for each subject group. (The patent publication years ranged from 2011 to 2016, and the deadline of patent citation was set to February 2017). Based on the semantic similarities of patent texts, 52 ThemeScape patent maps that can visually present the distribution of engineering development hotspot technologies quickly were obtained from 10 000 high impact patents using Thomson Innovation (Figure 2.1.1).
《2.2 Interpretation of ThemeScape patent maps》
2.2 Interpretation of ThemeScape patent maps
In line with the principle of taking data analysis as the basis for expert judgement, and with reference to ThemeScape patent maps, experts in each field group determined the positions of candidate engineering development hotspots on the ThemeScape patent maps for each subject group on the basis of the level of focus and degree of association of engineering development technologies. Subsequently, each field group studied the high impact patents contained in the hotspot positions on the ThemeScape patent maps; performed statistical analysis of keywords, number of published patents, publication country, citation frequency, citation frequency per patent, and other indicators; extracted technology development hotspots; combined similar hotspots; determined hotspot names; and obtained the candidate engineering development hotspots for each subject group. As shown in Figure 2.2.1, experts in the civil, hydraulic engineering and architecture field determined four hotspots for the architecture subject group through the interpretation of ThemeScape patent map (Hotspot 1: intelligent construction; Hotspot 2: prefabricated buildings; Hotspot 3: green urban buildings; and Hotspot 4: heating, ventilation, and air conditioning). Subsequently, through expert judgment and in light of the technical features of intelligent construction and prefabricated buildings, the latter was merged into the
《Figure 2.1.1》
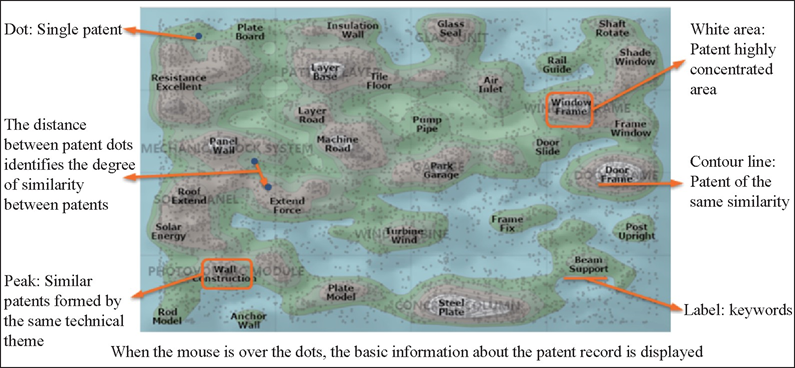
Figure 2.1.1 Basic format of ThemeScape patent maps (taking the architecture subject group as an example)
《Figure 2.2.1》
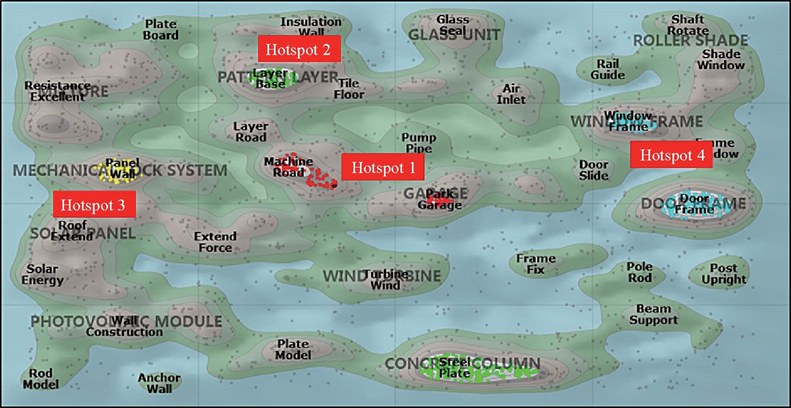
Figure 2.2.1 Hotspots of architecture subject group in the civil, hydraulic engineering and architecture field
former as a technology branch to form one candidate engineering development hotspot.
《2.3 Selection and judgment of engineering development hotspots》
2.3 Selection and judgment of engineering development hotspots
Based on the interpretation of ThemeScape patent map, eight field groups organized academicians and experts in different subjects to hold thematic workshops to make candidate engineering development hotspot mergers, name optimization, hotspot interpretation, and indicator computations. Eventually, 318 candidate engineering development hotspots in eight fields were obtained. Subsequently, a questionnaire survey (refer to Section 1.3 for information about the questionnaire survey implementation process) was conducted to obtain the opinions of academicians and experts on the top 10 engineering development hotspots in each field. In relation to the questionnaire’s statistical results, the field groups obtained 79 engineering development hotspots through expert judgment and examination, and verification by the standing committees of CAE’s academic divisions.
《3 Selection and deciphering of engineering research and development focus》
3 Selection and deciphering of engineering research and development focus
Among the 89 engineering research hotspots and 79 engineering development hotspots, discussions, study & judgment, and deliberations by the standing committees of CAE’s academic divisions were organized to select from the development prospects and level of attention 29 engineering research focuses and 26 engineering development focuses for key interpretation. Experts in the focuses-related specialties then made a detailed interpretation of the current status, development trend, and technical focal points of the engineering research focuses and engineering development focuses. For example, the meaning, development trend, and international research status of each focus were examined through expert judgment; objective data analysis was conducted to provide evidence and reveal the strengths and contributions of the major countries or regions and institutions with regard to the focuses concerned. Cooperative relationships and R&D layout between countries or regions and institutions were also explored.
《4 Explanation of terms》
4 Explanation of terms
Papers/Publications: Clarivate Analytics abstracts publications including editorials, meeting abstracts, conference proceedings and book reviews as well as research journal articles. The terms ‘paper’ and ‘publication’ are often used interchangeably to refer to printed and electronic outputs of many types. In this report the term ‘paper’ only covers substantive peer- reviewed research journal articles, review articles, and conference proceedings.
Citation frequency: The citation frequency is the number of times that a citation has been recorded for a given publication since it was published. Not all citations are necessarily recorded since not all publications are indexed. However, the material indexed by Clarivate Analytics is estimated to attract about 95% of global citations.
Citation impact: “Average citation” is an index of academic or research impact (as compared with economic or social impact). It is calculated by dividing the sum of citations by the total number of papers in any given dataset (so, for a single publication, raw impact is the same as its citation frequency). Impact can be calculated for papers within a specific research field such as Clinical Neurology, a specific institution or group of institutions, or a specific country. Citation frequency declines in the most recent papers since papers have had less time to accumulate citations. For example, papers from 2011 will typically have more citations than those published in 2015.
Highly cited papers: Highly cited papers is recognized as having a greater impact and Clarivate Analytics has shown that high citation frequency correlate with other qualitative evaluations of research performance, such as peer review. In the proposed analysis, papers that are in the top 10% in terms of citation frequency are considered to be highly cited, taking into account the year of publication and journal subject category.
Clustering theme: A combination of a series of themes and keywords obtained from the co-citation clustering analysis of highly cited papers.
Core papers: In this project, highly cited papers related to the 294 candidate engineering research hotspots are core papers.
Highly cited patents: In this project, “Highly cited patents” refers to the top 10 000 patents in the Derwent Patent Citation Index (DPCI) database, ranked in terms of average annual number of patent citations.
Consistently cited papers: In the proposed analysis, papers that are in the top 10% in terms of citation velocity are considered to be consistently cited, taking into account the year of publication and journal subject category.
Mean year (Average publication year): It means the average publication year of all the core papers that constitute each research hotspots. The hotspot whose average publication year is closer to the current year has received more recent attention.
Citation velocity: Citation velocity is a measure of the rate of citation accumulation based off a certain frequency within a set time period. In the proposed analysis, the citation velocity for each publication will be a measure of the rate of citation accumulation per month, starting from the publication month and ending the month before data collection started.
Patent-cited publications: Patents may cite other patents or non-patent references (NPRs), such as research publications. In the proposed analysis, publications that were cited by patents are identified as patent-cited publications through the non-patent references available in DPCI database.
Interdisciplinarity index: This is an entropy measure of the dispersion of papers over the categories. There is an upper limit of “1”, so a value of “1” indicates an equal dispersion of papers over all categories. The closer the value to “1”, the more multidisciplinary the set of papers. A value of “0” indicates that only one category is represented in the dataset. The interdisciplinarity index is based on entropy in information theory and can be expressed as follows:
\(-\left(\sum_{i=1}^{n} p_{i} \log _{2} p_{i}\right) / \log _{2} n\)
Where p is the share of papers in category i and n is the number of categories
ThemeScape patent map: A ThemeScape patent map is a themed panoramic view that can visually reflect the overall outlook of an industry or a technical field. It is a visual presentation in map form obtained by analyzing semantic similarities in patent literature, adopting scientific statistical analysis methods for precision analysis, and sorting of patent text contents.
Specialty division criteria system of CAE’s academic divisions: Includes the specialized fields covered by the various academic divisions of engineering science and technology (including agriculture and medical sciences) and determined in accordance with the Academic Divisions and Specialty Division Criteria of the Chinese Academy of Engineering for Election of Academicians (for Trial Implementation).


 京公网安备 11010502051620号


