
《1. Introduction》
1. Introduction
To meet the challenge of global climate change, the German federal government has issued goals for the future electrical energy generation mix. In 2050, renewable energy sources (RES) should account for 80% of total electricity generation. Many other countries have also defined ambitious long-term goals for the building up of RES. As a consequence, the usage of power distribution grids in these countries is more and more determined by feed-in from distributed RES. However, traditional grid structures have not been designed to deal with large-scale integration of distributed energy resources with discontinuous feed-in profiles, such as wind and solar power plants.
The current grid system design in Germany follows a worst-case approach: The grid is dimensioned for supporting a maximum load. As a result, and due to the intermittent feed-in by wind and solar power plants, 100% grid capacity utilization only occurs for a few hours per year, namely on occasional sunny and stormy weekends when low power consumption randomly coincides with high wind and solar production.
Following current German legislation [1], the distribution grid must be operated such that it can absorb all the electricity generated from RES. Within the limits of the existing grid infrastructures and operational procedures, such operation leads to situations in which operational limits for power system equipment (e.g., transformer loads and cable loads) are exceeded or in which voltage thresholds are violated. However, grid operators may only curtail RES by feed-in management as a last resort, that is, if there are no other options available to prevent harm to the power grid infrastructure. Once they have taken this action, grid operators are immediately forced by law to expand the grid infrastructure in locations affected by curtailment (see Ref. [1], Section 12). In the early days of the German transition to renewables called “Energiewende,” this was an adequate measure to promote the rapid countrywide build-up of RES capacities; today, however, more and more distribution grid structures arise with an unsatisfactory utilization rate, as explained above.
By 2025, installed RES wind and photovoltaic (PV) generation capacity in Germany is predicted to increase by 187% compared to the 2013 capacity. By 2035, an increase of 236% compared to the 2013 capacity is predicted. These numbers are taken from the main expansion scenario underlying the German grid development plan for 2025 [2]. Due to the regulatory background described above, enormous investments in grid construction are required to support the integration of RES, as long as only conventional grid expansion measures are applied in the future. This calls for investigation of methods for fine-grained active power curtailment as e.g. the 5% approach presented in this paper.
EWE NETZ is a distribution system operator (DSO) in the northwest of Germany that operates a regional grid with about 180 HV/MV transformers, 18 000 MV/LV transformers, an overall grid length of 81 000 km, and about 800 000 consumer connections with a maximum consumption load of 2.2 GW. Already, about 2900 wind turbines with an installed generation capacity of 4.6 GW peak, 57 000 PV generators (1.5 GW peak installed), and 1500 biomass generators (0.6 GW peak installed) are connected to the grid. These numbers will continue to grow in the future. For the grid operated by EWE NETZ, the average renewable generation is estimated to reach 150% of electricity consumption by the year 2020. EWE NETZ is in a process of permanent network expansion and is therefore constantly looking for solutions to increase network connection capacity for RES at low cost.
This article first summarizes technical possibilities to maximize grid connection capacity for RES with low costs. Next, it focuses in more detail on an approach for dynamic grid capacity management, called the “5% approach.”
《2.Overview of methods for increasing grid connection capacity》
2.Overview of methods for increasing grid connection capacity
The conventional way of expanding grid connection capacity involves laying new power lines, adding lines with greater wire cross-sections, and installing transformers with higher capacity. However, a range of additional technical possibilities for increasing connection capacity exists today: Some based on flexible power system equipment and others on the use of information technology.
New methods for improving grid connection capacity in medium-voltage grids are based on one of two ideas: either stabilizing voltage or controlling power feed-in and thereby optimizing load flow. The low-impact operation mode (LOM) is an example of a method for stabilizing voltage [3]. It is based on assigning a constant power factor to generators such that the sensitivity of voltage toward power gradients is minimal at the grid connection point. This method relies on generators being equipped with phase-shifting controllers and results in increased voltage stability. A second method to stabilize voltage is longitudinal voltage controllers. These consist of controlled impedances that are varied to modify voltage without affecting phasing. A third method, static synchronous compensators (STATCOM), regulates voltage by injecting or absorbing variable amounts of reactive power into or from the power system.
In grids dominated by decentralized RES, maximum grid load results when high RES generation coincides with low power consumption. Thus, methods to control load flow must either be based on controlling consumers or on the curtailment of RES generators. Two methods for curtailment are currently under discussion in Germany: static and dynamic. Static curtailment limits the feed-in of generators installed within a specific section of the distribution grid to a fixed percentage of their capacity. This percentage is calculated from simulations such that no overload of grid components can occur. This method of curtailment is technically simple, since no additional information and communication technology components are needed to implement it. However, static curtailment has the drawback of curtailing more energy than necessary: A generator is curtailed even if its feed-in does not contribute to a grid overload. Dynamic curtailment, on the other hand, is more effective: Generators are only curtailed in situations where they specifically contribute to grid congestion.
Figure 1 depicts the measured reverse histogram of the annual feed-in for a typical PV generator. A feed-in that is close to the maximum generation capacity of this PV plant (300 kW) is reached only for a very few hours per year. Curtailment of the feed-in for a couple of hours per year will not substantially reduce the amount of energy available. Following this approach, a recent study conducted for the German Federal Ministry for Economic Affairs and Energy [4] showed that curtailing 3% of the yearly feed-in of wind and solar generators can reduce the costs for grid expansion needed to accommodate RES integration by 40%. Curtailment of up to 5% can actually reduce the costs by 50%. In this paper, we focus on a description of the technical implementation of this approach, based on a curtailment rate of 5%.
《Fig. 1》

Fig.1 Illustration of the measured annual feed-in duration curve of a PV generator.
Congestion management as used for transmission grids is another method for grid usage optimization. However, in difference to the described methods of controlling grid usage by technical approaches, it is based on market mechanisms: Relying on predictions of load and feed-in, auctions for cross-border transmission grid capacities are carried out. Due to deviations from predictions, congestion management has to be complemented by markets for ancillary services. Since in Germany, no market participation has been established for DSOs, no market-based approach can currently be used there to optimize distribution grid usage. However, this is a topic of discussion and research [5].
《3. The 5% approach》
3. The 5% approach
The 5% approach is based on the assumption that dynamic, load-flow-dependent curtailment of a low percentage of the yearly power feed-in of a RES generator, which is carried out only in a few maximum load situations, leads to a relevant increase of grid connection capacity. For each generator, this approach limits curtailment to a maximum of 5% of the generator’s yearly energy production. The frequency and duration of curtailment must be reduced to the necessary minimum. This can be achieved using a fine-grained control, both in the time and power dimensions.
《3.1. Assessing the 5% approach by simulation》
3.1. Assessing the 5% approach by simulation
Simulation calculations were carried out using a model corres-ponding to a rural type of grid operated by EWE NETZ. The model’s characteristics were as follows:
• The model included a 110 kV to 20 kV transformer as the connection between the high-voltage (HV) grid and the medium-voltage (MV) grid. It also included clustered low-voltage (LV) grids.
• A typical deployment of distributed RES (wind, PV, and biomass) within the grids was assumed.
• A steady-state power flow calculation based on a yearly time series (15-minute resolution) delivered currents and voltages.
• Time series of measured RES feed-in (PV, wind) were used to model generation loads.
• Consumption loads for households were based on a load model devised by RWTH Aachen [6] and measured loads were taken for industry consumers.
Based on the MV grid model, different simulation scenarios were evaluated, using a reference setup with as much RES feed-in as possible, while just below the “threshold” where the grid connection capacity is exhausted and curtailment becomes necessary (we called this the “100% scenario”). To determine this “threshold” for the modeled grid, the capacities of all RES generators were iteratively increased. Starting with low generation capacity, more and more generators were added until the criteria for curtailment were reached (i.e., until the minimum allowed voltage stability or the maximum allowed load of transformers or cables were achieved). Taking the 100% scenario as a starting point, stepwise further generation capacities were added in the comparison calculations, thereby simulating higher and higher RES feed-in. According to the simulation setup, more and more curtailment was necessary in the comparison calculations. Whenever system parameters exceeded tolerance limits, feed-in was reduced by an amount calculated by an optimization algorithm based on load flow calculation.
Figure 2 shows grid connection capacity of RES as a function of curtailment. The dot at the origin represents the 100% scenario. It can be seen that the more curtailment is employed, the more RES generation capacity can be connected to the grid. The two curves thus represent different scenarios: In one scenario (blue line), it is assumed that the annual energy production of wind power plants is relatively low, assuming 1500 full load hours for wind turbines; while in the other scenario (red line), it is rather high, assuming 2000 full load hours for wind turbines. It is obvious that grid limitations (load, voltage) are reached more frequently for a strong wind year than for a weak wind year. As a result, more generation is curtailed in a strong wind year. With a curtailment rate of 5%, for example, the simulation exhibits a grid connection capacity of more than 200% for both wind type years.
《Fig. 2》
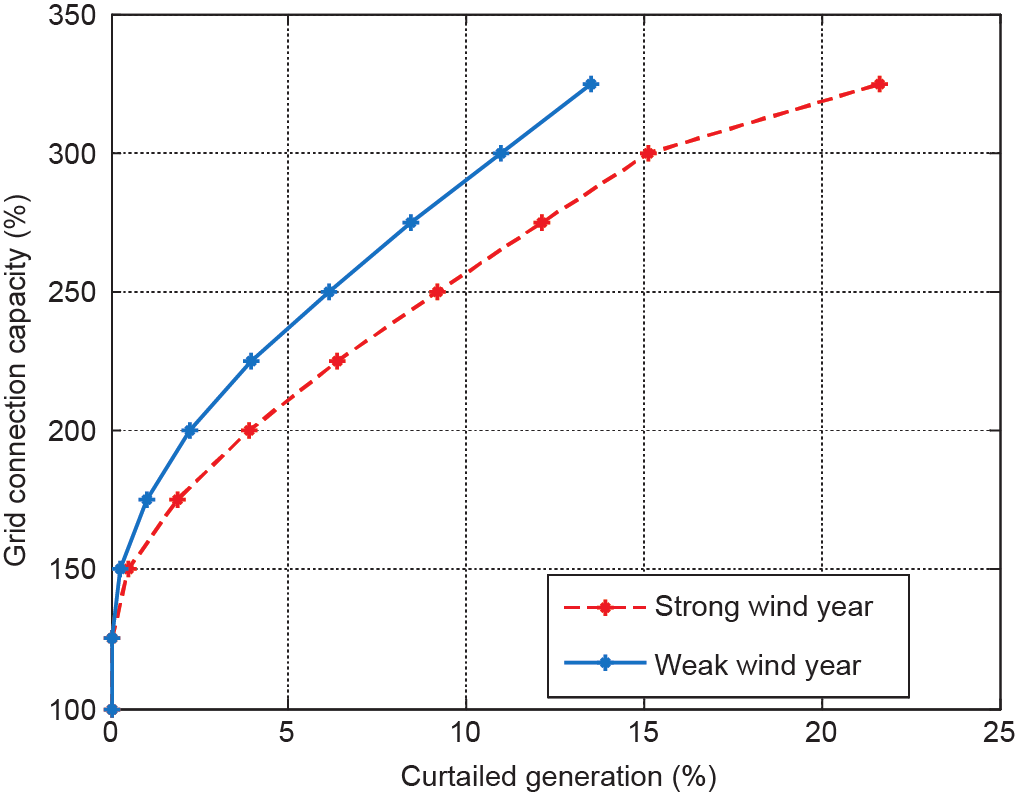
Fig.2 Interdependency between curtailed generation and grid connection capacity (simulation).
《3.2. Validating the 5% approach in a field test》
3.2. Validating the 5% approach in a field test
To evaluate the 5% approach under real field conditions, in October 2014 a field test was set up to measure the relationship between active feed-in reduction and enhanced grid connection capacity in practice. A further practical question to be evaluated was to what extent existing field-control units can be employed to operate the 5% approach. At the time of writing, the field test was still ongoing and final results were expected by October 2015.
Figure 3 depicts the selected field test area. A 20 kV MV grid with typical characteristics in terms of feed-in capacities, RES generator types, and generation-to-consumption ratio was chosen. Rooftop PV generators in underlying LV grids do not contribute substantially to the overall power feed-in, and are therefore not controlled for simplification reasons. All RES plants connected to the MV grid are equipped by suitable control units.
《Fig. 3》

Fig.3 A field test area in northern Germany.
The MV grid used in this field test is electrically connected to the Jever substation, which is connected in turn to the HV grid. In order to avoid interference with other grids that are not part of the field test, the switches toward switching stations Tettens and Wittmund are opened during the field test period.
The field test area contains 11 distributed generators corresponding to a maximum feed-in of 10 MW. Six of these generators are wind turbines, four are PV generators, and one is a combined heat and power plant. During the field test, the active power of all 11 generators is actively controlled. For practical reasons (to avoid plant operators disturbing the field test by additional control activities), the generators are operated with a constant reactive power ratio. All RES plants connected to the MV field test grid are equipped by suitable control units.
《Fig. 4》
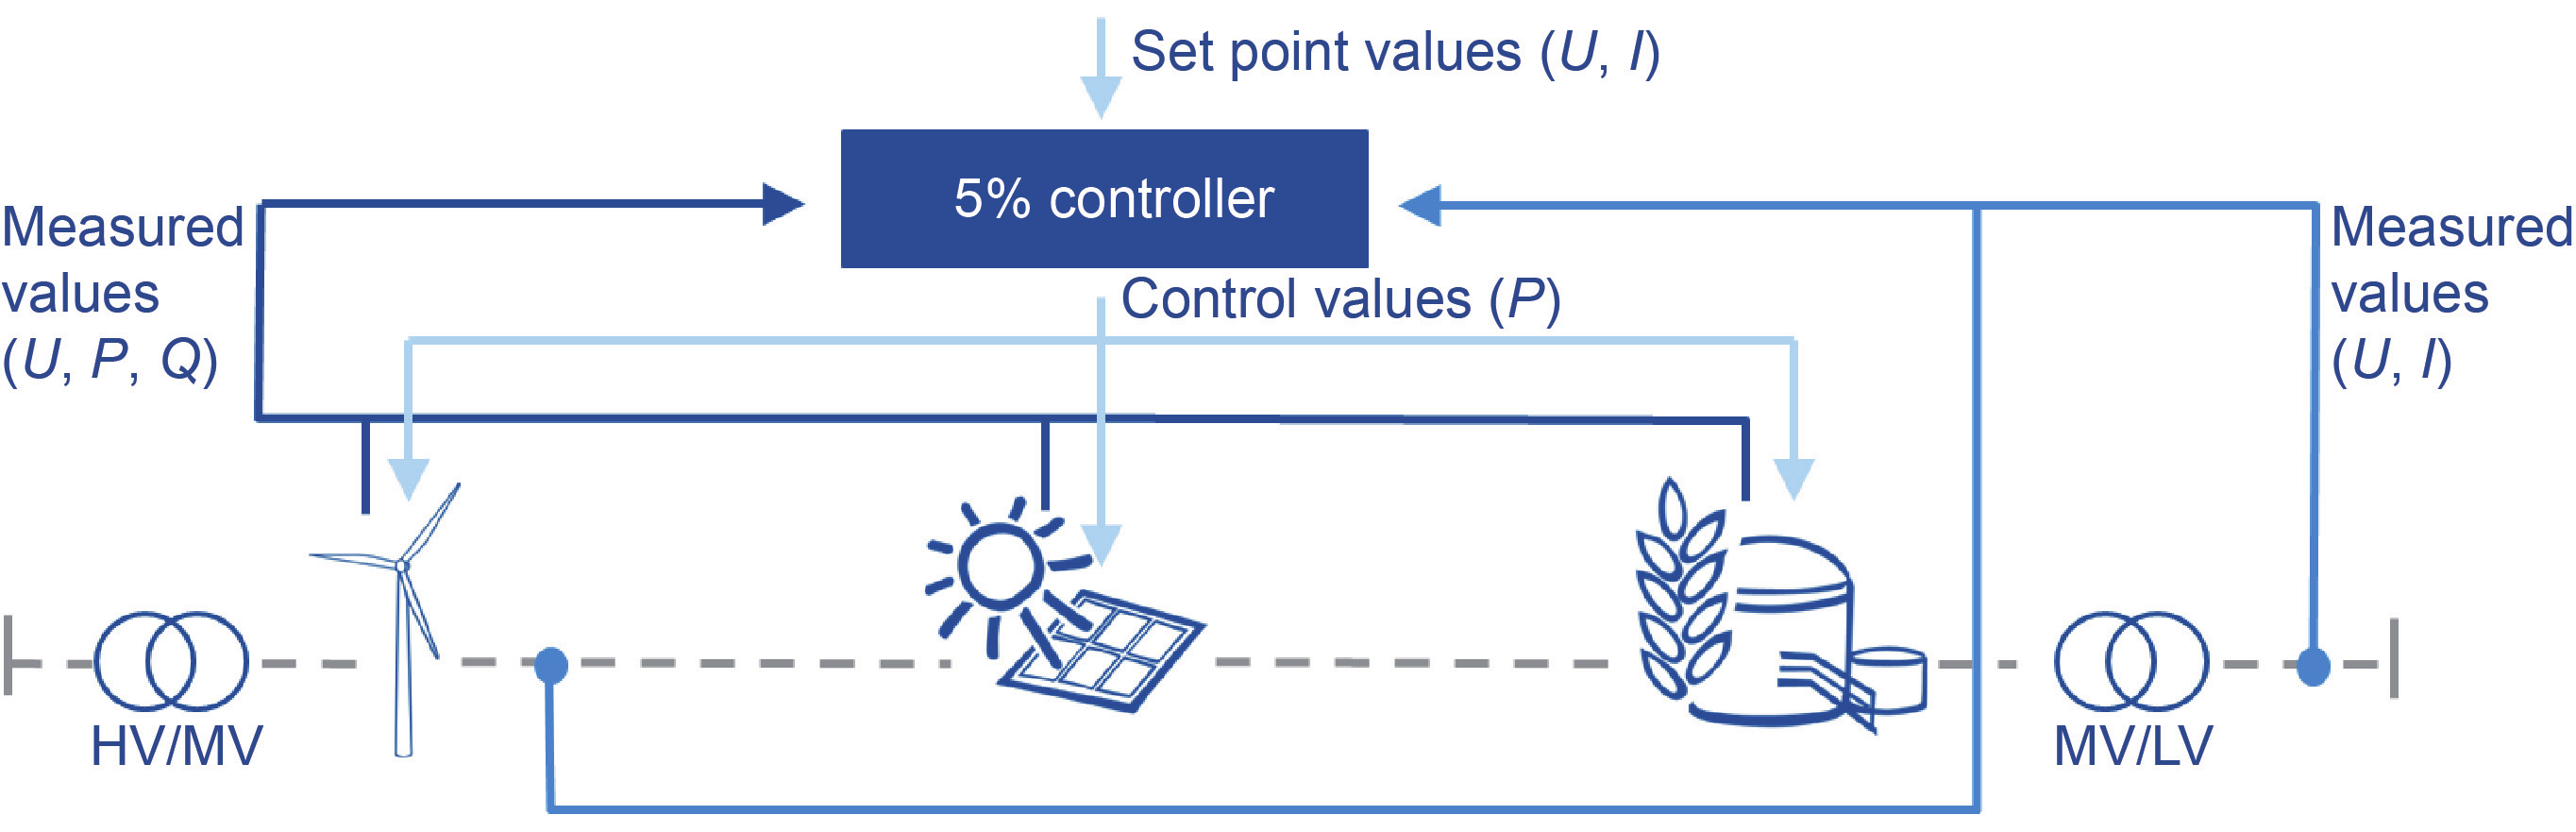
Fig.4 System configuration of the 5% controller in the field test.
A specifically designed control agent, called the 5% controller, performs the task of regulating feed-in from power generators (Figure 4). Every five seconds, the 5% controller is fed with the following data, which are continuously measured:
•Electrical currents at the MV grid connection point to the Jever substation ( I);
•Voltages at the substation, switching station, and grid connection points of all 11 RES generators ( U);
•The power and primary voltage at all MV/LV transformer substations ( P, Q);
•The reactive power, active power, and voltage of all 11 RES generators ( U, P, Q); and
•Wind and radiation measurements (for the purpose of validation).
The 5% controller continuously compares the measured values with the set point values ( U, I). When deviations are identified, control values (adjusted active power values, P) are issued to the generators.
The quantities that are relevant for assessing the increase of grid connection capacity are the admissible voltage ranges according to EN 50160 [7] and the allowable currents for grid equipment. For the field test, it is not possible to physically downsize the capacity of the existing physical grid; instead, the operational thresholds (grid voltage thresholds and maximum allowable equipment currents) are notionally reduced to 50% of the physical thresholds according to EN 50160. The 5% controller is operating with the reduced grid thresholds.
Note that the 5% controller is operating autonomously. There is no given limit to the curtailment of the RES generators. The scope of the test is to evaluate whether the overall curtailment over a statistically sufficient period of time is in accordance with the simulation results from Figure 2. To gather statistically adequate evidence, the field test will run for at least one calendar year. Curtailment per generator and overall curtailment are regularly evaluated.
《3.3. Applying the 5% approach in typical distribution grids》
3.3. Applying the 5% approach in typical distribution grids
In order to evaluate the applicability of the 5% approach for typical distribution grids, a system study [8] has been carried out by RWTH Aachen. The principal findings of this evaluation are:
• For 70% of the rural distribution grids in Germany, grid connection capacity can be doubled by dynamically curtailing up to 5% of feed-in per generator.
• Using static curtailment while limiting curtailed energy to 5% of possible feed-in, the grid connection capacity can only be doubled for 12% of the distribution grids in Germany.
• Grid sections with mostly PV generation need higher curtailment rates than grid sections with mixed RES generation.
《4. First field test results》
4. First field test results
Figure 5 shows the curtailment of a wind turbine during an overload situation. The control values issued by the control unit for this particular wind turbine (red curve) lead to a reduced feed-in (blue curve). The possible feed-in of the wind turbine without limitation is shown as a reference (green curve). The shaded area between the reference and the generation corresponds to the amount of curtailed energy.
《Fig. 5》
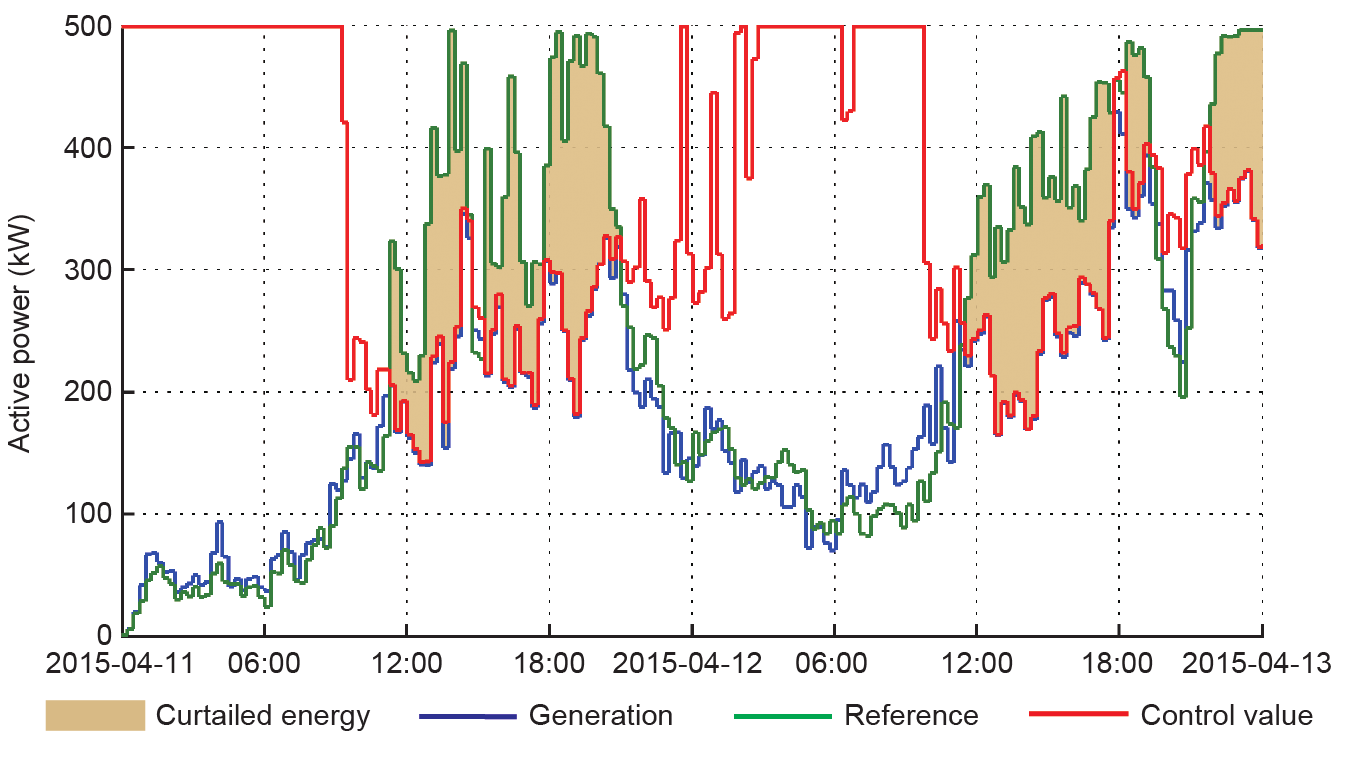
Fig.5 The curtailment of a wind turbine during a sample time span.
So far, the field test has shown that the control behavior of wind turbines is very good, especially in situations with high power generation. Older types of wind turbines switch off in low power generation situations, so that no sensitive control of power generation is possible for such wind turbines. So far, this behavior has not led to critical grid situations. PV generators exhibit a control behavior similar to that of wind turbines. However, a required additional electronic control unit causes a delay in their reaction time. Combined heat and power generators have limited reaction times due to the characteristics of their combustion motor.
Concerning the possible occurrence of critical grid conditions, the one-minute average of the measured electrical currents at the transformers is monitored. It is observed that the given thresholds are sometimes violated, although only for very short time periods. With 15-minute averages, no threshold violations could be identified at all. The following reasons for threshold violations were identified:
• Generator inertia;
• Weather variability;
• Delay time due to GSM communication; and
• Immaturities in the algorithm for distributing curtailment between different generators.
After nine months of field testing, the curtailed feed-in energy has already reached 6% of the predicted yearly feed-in of participating generators. This result is partly due to the fact that the combined heat and power plant participating in the field test did not follow the given control signals of the 5% controller. Its primary goal is to produce as much heat as possible, which conflicts with the goal of curtailment. These and other findings (e.g., a high wind situation at the beginning of 2015) concerning the observed behavior of the 5% controller, however, are valuable hints for the further optimization of the control algorithm.
《5. Conclusions and outlook》
5. Conclusions and outlook
The 5% approach is a very promising building block for minimizing costs for the integration of RES into distribution grids. Simulations show that the dynamic curtailment of generators can largely enhance grid connection capacity. A field test showed that technical implementation is possible and that the chosen approach is utilizable. However, the current results reveal that:
•Every generator in the controlled grid must allow control. While 5% control units will continue to work properly in situations where most distributed generation units are not controllable, a curtailment of 5% of the yearly energy limited to the generators available for control generator will not have the desired effect of doubling grid connection capacity.
•The 5% controller must still be optimized to minimize curtailment per generator.
A concomitant system study [8] shows that the increase of connection capacity by curtailment depends on the type of generator and on the type of distribution grid.
Regulatory aspects of the approach are not part of the field test. Nevertheless, field test results may serve as input for an amendment of the German law for the energy industry that is expected in 2016. This amendment will most likely contain requirements toward a dynamic feed-in reduction based on the 5% approach.
《Compliance with ethics guidelines》
Compliance with ethics guidelines
Till Luhmann, Enno Wieben, Riccardo Treydel, Michael Stadler, and Thomas Kumm declare that they have no conflict of interest or financial conflicts to disclose.


 京公网安备 11010502051620号


