

《1. Introduction》
1. Introduction
Many empirical engineering methods are available to estimate scour formation downstream of plunging jets. Nevertheless, such empirical formulations are site-specific and not applicable to a wider range of cases [1]. As a matter of fact, the scouring process at plunge pool floors is a result of the interactions of the three phases involved: water, rock, and air. Moreover, the highly turbulent nature of the flow and the resulting pressure fluctuations on the water-rock interface and inside rock fissures make appropriate scaling impossible in hydraulic modeling. Therefore, the applicability of Froude-based reduced-scale models is extremely limited.
The Comprehensive Scour Model (CSM) was first proposed by Bollaert and Schleiss [2,3]. It has the advantage of considering the physical phenomena involved in the scour of the rock impacted by plunging water jets. The model was developed as a result of experiments with plunging jets of near-prototype velocities impacting on closed-end and open-end fissures at the pool bottom. As such, the model reproduces the characteristics of the pressure signals of prototype jets, thus minimizing scale effects. Furthermore, Manso et al. [4,5] proposed adaptations to the CSM that took into account the influence of the pool bottom geometry and the resulting induced flow patterns.
The present study proposes adaptations to the CSM in order to consider the effect of jet air entrainment as obtained by a systematic experimental campaign. The experimental setup and test program are presented in detail by Duarte [6].
The large facility was built at the Laboratory of Hydraulic Constructions of the École polytechnique fédérale de Lausanne. The vertical jets were issued from a dj = 72 mm diameter outlet nozzle, where compressed air was added to the water flow. Near-prototype air-water jet velocities up to 22.1 m·s-1 were reproduced. The jets impinged into a 3 m diameter cylindrical basin. Plunging and submerged jets were tested. The pool depths, Y, were 30 cm, 50 cm, and 80 cm deep, resulting in relative pool depths Y/ dj of 4.2, 6.9, and 11.1, respectively.
On the bottom of the pool, a metallic system to represent fullyopen 3D fissures of the rock mass was implemented. It comprises a box in which a 200 mm side cubic block was inserted, with a 1 mm thick fissure between the block and the box. Dynamic pressures were measured with a frequency of 1 kHz at 12 positions uniformly distributed along one half of the block. The pressure transducers were of the type Kulite HKM-375M-17-BAR-A.
The recent research assessed the influence of the air bubbles on the jet dissipation along the plunge pool, the resulting dynamic pressures acting on the water-rock interface and inside underlying fissures on pools with a flat bottom [7] and with a confined bottom [8], as well as the ejection of blocks from the rock mass [9]. This paper ties the former work together and proposes a sound and straightforward method for the engineering practice.
《2. Proposed adaptations of the Comprehensive Scour Model (CSM) for considering jet aeration》
2. Proposed adaptations of the Comprehensive Scour Model (CSM) for considering jet aeration
The CSM was developed based on a theoretical and experimental study of rock scour created by plunging high-velocity jets. The scour process is the result of complex subsequent physical phenomena and can be divided into three parts—the falling jet, the plunge pool, and the rock mass—each corresponding to a module of the CSM, as shown in Fig. 1.
In the following, the different modules of the CSM are presented. The developments refer to the proposed adaptations of the model, unless it is specifically stated otherwise.
《2.1. Falling jet module》
2.1. Falling jet module
The falling jet module reproduces the jet characteristics during the jet’s trajectory through the air. Ballistics theory governs the trajectory of the jet core. The jet develops an aerated outer layer as internal turbulence creates increasing disturbances on the jet’s surface. The jet, issued with velocity Vj, diameter (or thickness in the case of plane jets) dj, and turbulence intensity Tu, is subjected to acceleration of gravity g during the fall length L, impacting the pool at the plunge section with velocity Vi and diameter di. Providing enhancements to the representation of the falling jet considering aeration was not in the scope of this research project. The original references may be consulted for detailed information [2,3].
《2.2. Plunge pool module》
2.2. Plunge pool module
The plunge pool module represents the diffusion of the jet throughout the pool depth. This process dissipates a fraction of the energy of the jet. The jet entrains large quantities of air into the water pool at the plunge section, which strongly influences the diffusion properties. The jet aeration, or air-to-water ratio, is defined as β = Qa/ Qw, where Qa and Qw are the air and water discharges, respectively. To compute β, the expression proposed by Ervine et al. [10] is considered:
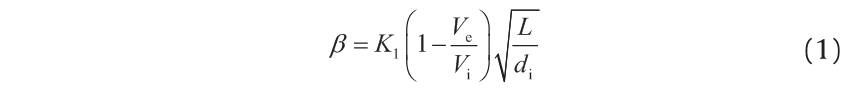
where, K1 is a parameter that varies between 0.2 for smooth turbulent jets and 0.4 for very rough jets; Ve is the onset velocity of the jet at the plunge section above which air entrainment begins, normally taken as ~1 m·s-1.
《Fig. 1》

Fig.1 Physical processes responsible for scour formation and definition of the main parameters. Adapted from Ref. [2].
The mean density of the air-water jet inside the pool ρaw is given by

where, ρa and ρw are the air and water densities, respectively. The input of energy to the process is determined by the kinetic energy per unit volume of the air-water jet at the plunge section:

After plunging into the pool with aeration β, mean density ρaw, and kinetic energy Ek, the dissipation process of the jet begins. The inner core of the jet is progressively disintegrated from its contour toward the centerline, where the flow remains approximately at the same velocity as at the plunge section. The jet core vanishes according to the following expressions [7]:

where, yc is the core development length; ν is the kinematic viscosity of the fluid; the parameter A′ is 3.5 for submerged jets and 7.8 for plunging jets; the term Vidi/ ν corresponds to the Reynolds number of the jet at the plunge section. Once the jet core is disintegrated, the jet velocity decay follows a linear function of the pool depth for both submerged and plunging jets.
The remaining kinetic energy of the jet is converted into dynamic pressures acting on the plunge pool bottom. The time-averaged pressures pmean are maximal at the intersection of the jet centerline with the water-rock interface, which is commonly referred to as stagnation. The time-averaged pressure coefficient is defined as Cp = ( pmean – ρwgY)/ Ek. For the non-aerated jets at stagnation, Cp is reproduced by the following relationship [7]:
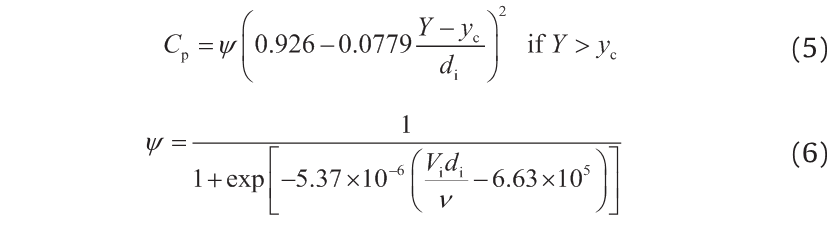
If Y< yc, the core of the jet impacts directly on the rock bottom and Cp = 0.86. The parameter ψ reflects the loss of energy that takes place at the impingement region formed at the vicinity of the intersection of the jet centerline with the pool bottom (for a complete description of the impingement of axisymmetric developing jets, refer to the work of Beltaos and Rajaratnam [11]). Duarte et al. [7] showed that ψ is a logistic function of the jet velocity that asymptotically reaches the value 1 for high jet velocities.
Aerated jets have a lower momentum compared to clear-water jets of the same discharge, due to a reduced mean density of the air-water mixture [12,13]. However, as pointed out by Duarte et al. [7], the air bubbles also reduce the shear stresses with the surrounding water in the pool, resulting in lower velocity decay rates and higher Cp values for the aerated jets at the bottom.
The influence of the jet aeration β on the Cp values could be precisely assessed for the tests with submerged jets, as the full air entrainment discharge was provided at the nozzle. Fig. 2 shows the time-averaged pressure coefficients for aerated jets  divided by the corresponding Cp value for non-aerated jet as a function of β. A linear increase can be observed, represented by the expression:

《2.3. Rock mass module》
2.3. Rock mass module
The rock mass module reproduces the physical processes occurring on the rock media. These processes are the progressive break-up of rock joints and subsequent ejection of the so formed blocks from the pool bottom. Two methods were developed to simulate each of these processes, respectively: the Comprehensive Fracture Mechanics (CFM) method and the Dynamic Impulsion (DI) method [3].
This research enables the improvement of the latter by including the experimental results of high-velocity jets of different air contents impinging on a completely open-ended 3D joint. This open-ended 3D joint is represented by a block inserted into a cavity where dynamic pressures and displacements were measured simultaneously. Fixed and mobile block responses were studied.
《2.4. Dynamic Impulsion (DI) method》
2.4. Dynamic Impulsion (DI) method
The DI method aims at evaluating the scour potential of plunging jets by means of their capacity to remove the mobilized rock blocks from the pool bottom [2,3]. In contrast to the CFM method, the DI method does not consider the evolution in time of the scour hole, but instead computes the equilibrium or ultimate scour depth.
It uses a non-dimensional maximum dynamic impulsion coefficient  , defined as the non-dimensional uplift force acting on the rock block during a given time period. The impulse IΔp is defined as a time integration of the forces applied on the block:

where, Δp is the pulse time; Fv is the sum of the vertical forces around the block due to the impinging jet; Fu is the resistance of the fluid inside the fissures to a change in volume; Wi is the immerged weight of the block; Fhf and Fsf are the hydraulic and solid friction forces on the vertical fissures around the block; mb is the block mass; madd is the added mass of the block; and Vb is the block displacement velocity.
《Fig. 2》
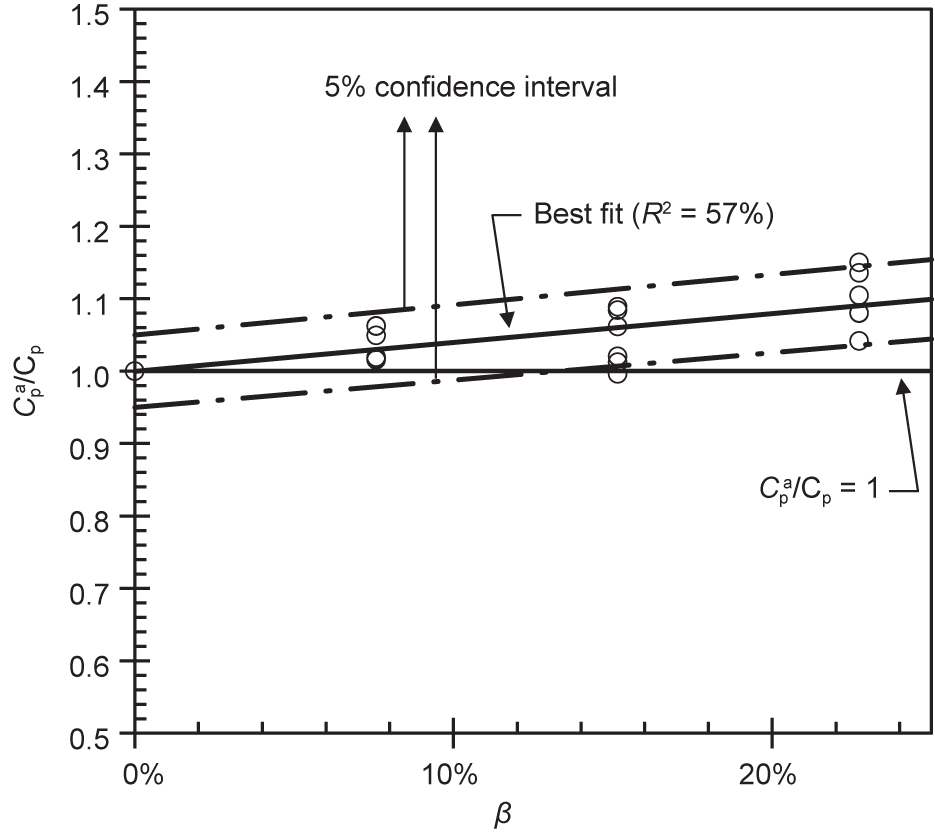
Fig.2 Time-averaged pressure coefficient for aerated jets Cpa divided by the time-averaged pressure coefficient of the corresponding non-aerated jet Cp versus air-to-water ratio β. Test results for submerged jets at stagnation; Y/ di = 9.7; jet velocities Vi ranging from 7.4 m·s-1 to 22.1 m·s-1.
Eq. (8) is a complete formulation of the impulse according to the detailed description of the forces developed by Duarte et al. [9]. For practical engineering applications, a simplified formulation will be used, discarding the stabilizing forces. This simplification is conservative in that it results in stronger destabilizing impulses. Furthermore, it is also realistic to neglect the fluid resistance to a change in the volume of the lower fissure as this reflects the situation in real cases. This effect was important when modeling block movements in the experimental facility by Duarte et al. [9]. However, in prototype conditions, with the progressive widening of the fissures caused by a simultaneous hydraulic fracturing, the fluid can rapidly fill the volume created by a positive block displacement, which was not the case in the facility. The resulting expression is equivalent to the formulation proposed by Bollaert and Schleiss [3]:

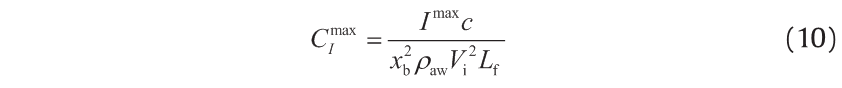
The impulse IΔp is considered whenever net uplift forces exist. The maximum impulse of a test run is Imax. The time is made non-dimensional by dividing it by the period of the pressure waves inside the joints Tp = 2 Lf/ c, where Lf is the fissure length and c is the wave celerity [3]. For simplicity, the rock blocks are considered to have a square base of side xb and height z. Hence, Lf = 2 z + xb. The forces are made non-dimensional by transforming them into a pressure acting on a block face (in this case the top or the bottom of the block with area  ) and dividing the result by the kinetic energy per unit volume, Ek. The maximum dynamic impulsion coefficient can thus be computed with the following expression:
The experimental results of are presented in Fig. 3 as a function of jet aeration at issuance β1, in Fig. 4 as a function of incoming jet velocity Vaw, and in Fig. 5 as a function of relative pool depth Y/ dj.
The maximum and minimum values of range roughly between 0.35 and 0.15, respectively. The influence of the issued jet aeration β1 is relatively small and the values decrease for high β1 values toward approximately 0.2 (Fig. 3). Analyzing the influence of the issued jet velocity (Fig. 4), it can be seen that decays smoothly toward 0.2 for high jet velocities. The convergence toward 0.2 can also be observed as a function of relative pool depth in Fig. 5, where the results for the different jet aerations approach the average value for deeper pools. Hence, based on the experimental results, the use of C Imax = 0.2 is proposed, which corresponds to the strongly aerated high-velocity jets found in prototype conditions.
《Fig. 3》

Fig.3 Experimental results of the maximum dynamic impulsion coefficient versus jet aeration at issuance β1: (○) Vaw = 12.3 m·s-1; (△) Vaw = 14.7 m·s-1; (▲) Vaw = 17.2 m·s-1; (●) Vaw = 19.6 m·s-1; and (●) Vaw = 22.1 m·s-1. (a) Y/ dj = 4.2; (b) Y/ dj = 6.9; (c) Y/ dj = 11.1. varies between 0.15 and 0.35 with an average of 0.2 (dashed lines).
《Fig. 4》
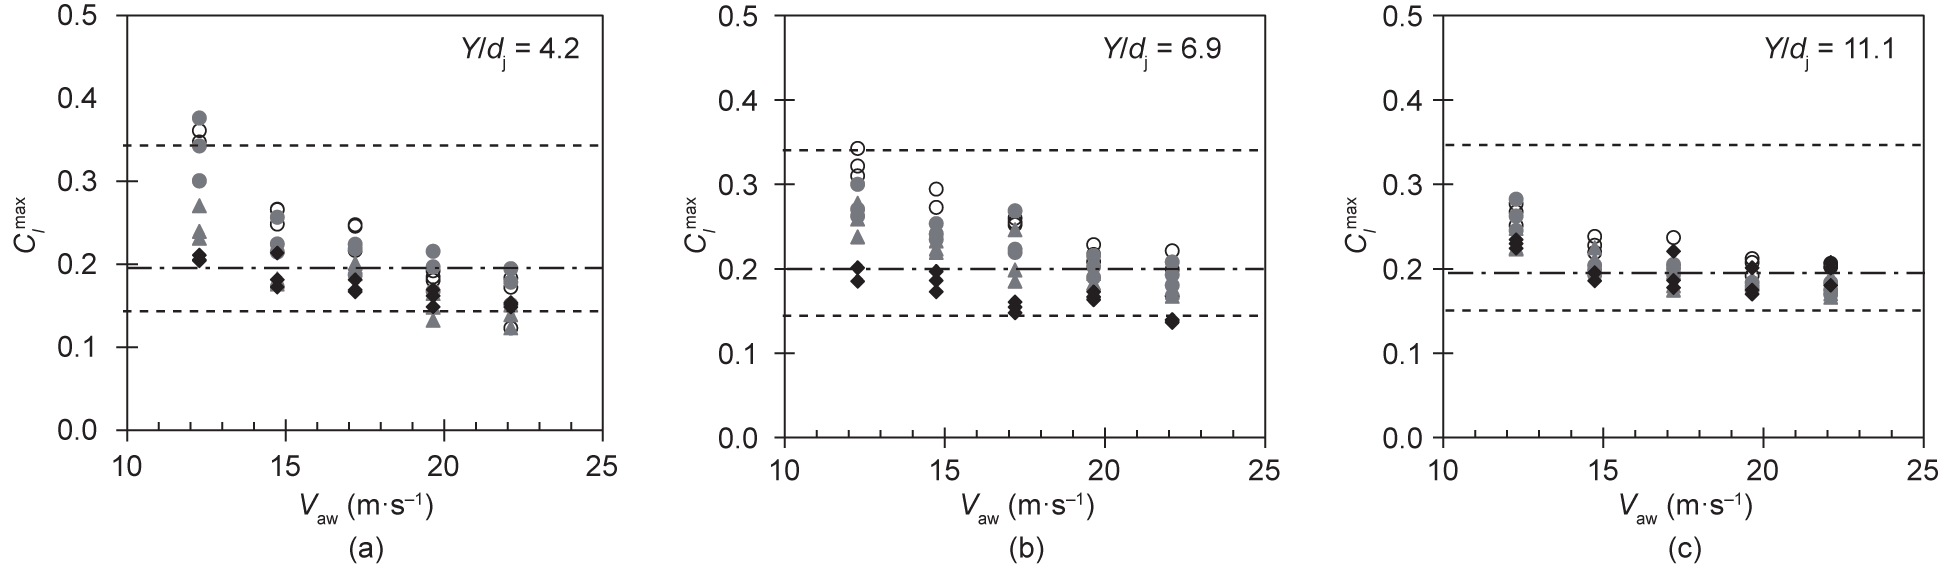
Fig.4 Experimental results of the maximum dynamic impulsion coefficient versus jet velocity at issuance Vaw: (○) β1 = 0%; (●) β1 = 8%; (▲) β1 = 15%; and (◆) β1 = 23%. (a) Y/ dj = 4.2; (b) Y/ dj = 6.9; (c) Y/ dj = 11.1. varies between 0.15 and 0.35 with an average of 0.2 (dashed lines).
《Fig. 5》

Fig.5 Experimental results of the maximum dynamic impulsion coefficient versus relative pool depth Y/ dj: (○) β1 = 0%; (●) β1 = 8%; (▲) β1 = 15%; and (◆) β1 = 23%. Dashed lines indicate outer bounds and average value.
Finally, the maximum dynamic impulsion on dislodged rock blocks on the plunge pool bottom depends on the dissipation of the jet kinetic energy in the water pool and on the maximum impulsion coefficient acting on a block. The former is represented by the time-averaged pressure coefficient  , which considers the effect of aeration. The maximum dynamic impulsion and the vertical displacement of the block are computed with the following expressions:


This adapted method differs from the proposals of Bollaert and Schleiss [2,3], who suggested a maximum impulsion dependent exclusively on , instead of on both and as in Eq. (11). They proposed an empirical relationship of as a decreasing function of the relative pool depth, based on their experimental results:
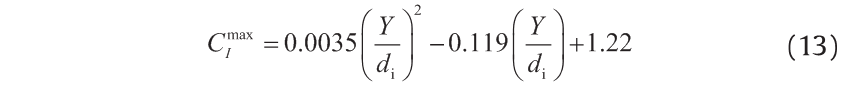
In the method proposed in the present study, is a decreasing function of the relative pool depth. Eqs. (5) and (6) reflect the dissipation of non-aerated jets along the pool. The higher pressures due to lower velocity decay caused by the entrainment of air bubbles are represented in the formulation of in Eq. (7). On the other hand, the pressure reduction due to a lower apparent density of aerated jets is reproduced by a lower kinetic energy of the jet in Eq. (11).
《3. Case study: Kariba Dam scour hole》
3. Case study: Kariba Dam scour hole
《3.1. Description of the hydraulic scheme》
3.1. Description of the hydraulic scheme
The Kariba Dam is located at the Zambezi River between Zambia and Zimbabwe, where it creates one of the largest human-made reservoirs in the world. The hydropower plant has a capacity of 1266 MW, with refurbishment work currently underway to increase the total capacity to 1450 MW [14,15]. The facility is operated by the Zambezi River Authority (ZRA). The flood release devices comprise six middle outlet gates with a discharge capacity of 1500 m3·s-1 each. No additional structure is located outside the dam with the purpose of flood release (Fig. 6).
As a result of long spilling periods since the dam started operation in 1959, a deep and steep-sided scour hole has formed at the bottom of the plunge pool downstream of the dam. Bathymetry campaigns indicate that the pool bottom was at an elevation of 306 meters above sea level (m a.s.l.) in 1981 (Fig. 7), which corresponds to the pool bottom elevation in 2001. This is still considered to be the current shape of the pool bottom and is therefore approximately 80 m below the normal tailwater level and 70 m below the original riverbed.
《Fig. 6》
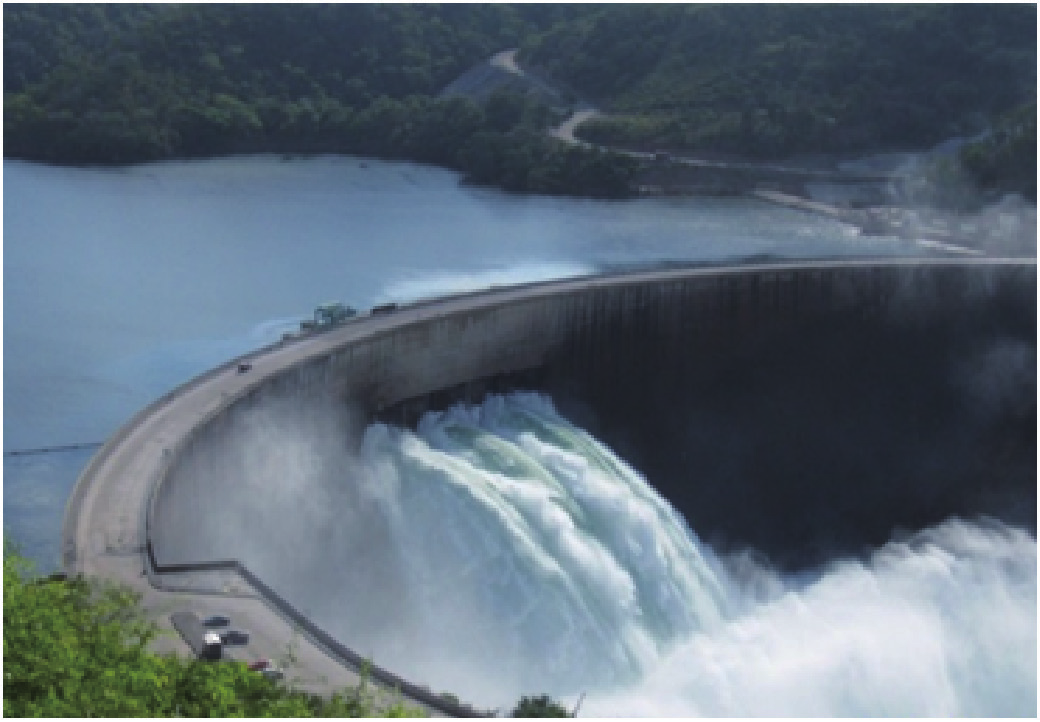
Fig.6 Downstream view of the Kariba Dam during spillage through three non-adjacent gates in April 2010 (courtesy of B. Goguel).
Hybrid modeling, using a combination of physical model tests and CSM numerical modeling, was carried out to find a solution to stabilize the scour hole [16,17]. The main concern is preventing further erosion toward the dam toe. For this purpose, excavation works are planned to reshape the plunge pool bottom, in order to reduce pressure fluctuations at the rock and guide the deflected jet downstream [14].
《Fig. 7》
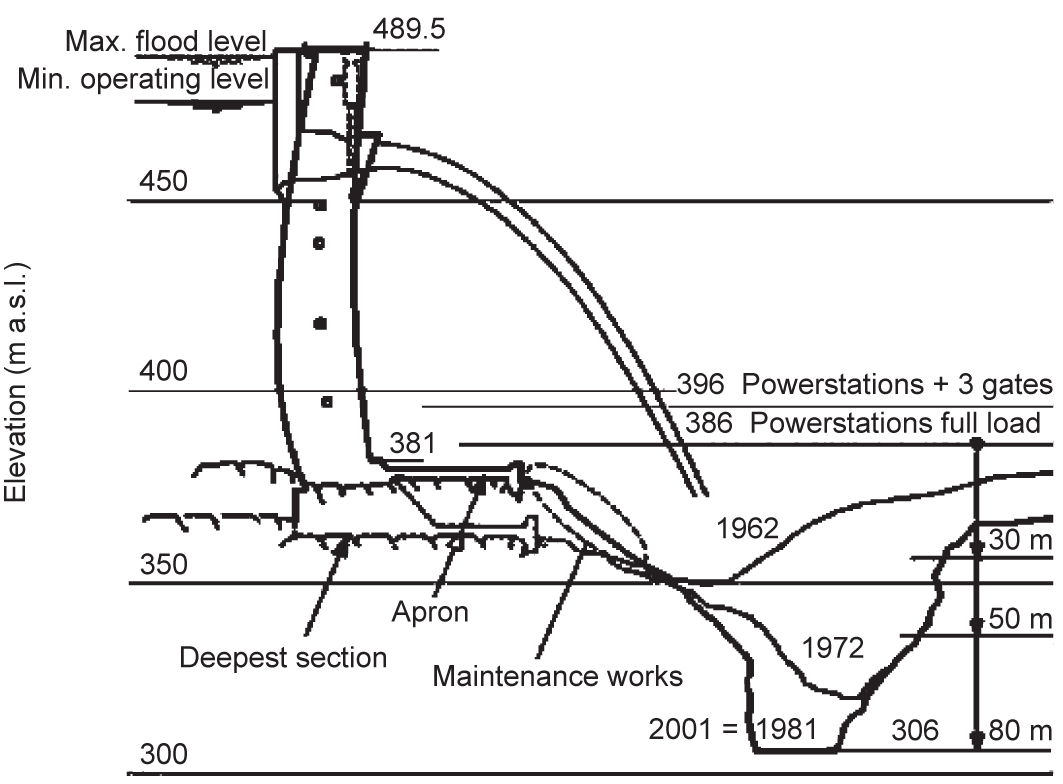
Fig.7 Longitudinal section of the Kariba plunge pool with time evolution of the scour hole [14], figuring upstream levels (maximum flood level and minimum operating level), tailwater levels and geological surveys of 1962, 1972, and 1981 (same as 2001)
《3.2. Rock scour estimates with the adapted DI method》
3.2. Rock scour estimates with the adapted DI method
The main input parameters and intermediate results are shown in Table 1. The jet reaches the plunge pool surface with a velocity Vi = 41.4 m·s-1. The jet entrains very large air quantities into the plunge pool ( Ca = 48%). With a jet core length of 49.1 m, a developed jet reaches the pool bottom.
《Table 1》
Table 1
Parameters used in the adapted Dynamic Impulsion (DI) method.


A pressure wave celerity inside the rock fissures of 70 m·s-1 is chosen, in accordance with the results of Duarte et al. [8] for a highly aerated high-velocity jet. It was found that pressure wave celerity is strongly reduced by the air content and by the block vibrations, which corresponds to a pseudo-elastic behavior of the flow boundaries.
Indeed, the fissures around the blocks located at the water-rock interface are progressively widened by the hydraulic fracturing caused by the jet, allowing the blocks to vibrate more and more inside the cavity. As shown by Duarte et al. [8], these vibrations reduce the celerity of the pressure waves, together with the effect of aeration. In addition, as pointed out by Duarte et al. [9], the opening of the joints facilitates the establishment of a flow that fills in the fissures almost immediately as the block rises, and vice-versa, thus reducing the resistance force of the fluid to a change in volume inside the fissures. This aspect supports the simplifying assumption of neglecting the stabilizing forces that was considered in Eq. (9).
The geological surveys indicate that the rock mass is a composition of fresh and altered gneiss of very good quality (approximately 150–200 MPa). The rock contains vertical and sub-horizontal joint sets at a dip angle of approximately 20°–30° [17].
Regarding block ejection from the rock mass, different criteria have been used in the literature. The critical parameter is hup/ z, which determines the degree of displacement of the block inside the rock mass cavity. Bollaert [2] used hup/ z = 1 to determine the threshold below which the rock bottom is stable. Later, Bollaert and Schleiss [3] assumed that an intermediate region exists for hup/ z > 0.2, where the blocks are vibrating. A stable plunge pool is thus attained below this limit.
Recently, Asadollahi et al. [18] investigated rock scour based on the ejection of rock blocks from a fractured rock media. They developed an iterative algorithm, the Block Stability in 3 Dimensions (BS3D), which was validated with experimental data from Federspiel [19]. Asadollahi et al. [18] suggested that rock blocks are most likely removed from the pool bottom mass if their displacements are higher than a quarter of the block height.
Table 2 presents the results of the ultimate scour depth computed using the adapted DI method. The results are given for a failure criterion of hup/ z = 1 or 0.25. These results are shown and compared to the longitudinal profiles measured in 1972 and 1981 in Fig. 8.
The difference between the two failure criteria is small. Furthermore, the results for the ultimate scour depth are close to the deepest point of the pool bottom as measured in 1981 and 2001. In fact, a failure criterion of hup/ z = 0.25 resulted in exactly the same pool bottom elevation of 306 m a.s.l. It indicates that the scour hole has attained its scour potential considering the capacity of the impinging jet to eject blocks from the rock mass.
《Table 2》
Table 2
Numerical results of the ultimate scour depth based on the adapted DI method.


For comparison, the original DI method with a failure criterion of hup/ z = 0.25 gives a bottom elevation of 289.5 m a.s.l. Moreover, if these results are compared to the empirical formulation proposed by Mason and Arumugam [20] with constant parameters,
《Fig. 8》

Fig.8 Results of the adapted Dynamic Impulsion (DI) method for the Kariba Dam scour hole. The grey solid line represents the pool bottom measured in 1972; the black solid line represents the pool bottom measured in 1981, also corresponding to the measurement in 2001; the dashed black lines represent the adapted DI method with either hup/ z = 1 or hup/ z = 0.25; and the dashed grey line represents the original DI method with hup/ z = 0.25.

where, H is the hydraulic head determined by the difference between the reservoir and tailwater levels; q is the discharge rate; dm is the mean particle or rock size; α = 3.27, α1 = 0.05, α2 = 0.60, α3 = 0.15, α4 = 0.30, and α5 = 0.10. The resulting bottom elevation is found at 338.8 m a.s.l., far above the present elevation. In addition, if Eq. (14) is computed with variable parameters, as obtained by Mason and Arumugam [20] with both model and prototype data, the results show a total pool depth of only 1.5 m, showing that the parameters are out of range in this case. This example demonstrates that empirical formulas can seldom represent complex prototype situations, and only a physically based representation can estimate the scour phenomenon with accuracy.
However, these statements have to be taken with precaution, since other aspects have to be analyzed. It must be noted that the DI method takes into account only the erosion capacity of the turbulent shear layer of the jet. In other words, it considers the effect of a direct jet impingement and does not include the influence of the rollers formed by the deflection of the jet against the scour hole.
As highlighted by Manso et al. [5], the geometry of the plunge pool bottom generates induced flow patterns and has a strong influence on the way the jet dissipates and is deflected at the pool bottom. Subsequently to jet impingement at the intersection of the jet centerline with the water-rock interface, the jet is deflected and forms a wall jet parallel to the bottom. Wall jets have a scour potential as well [21,22], which is not represented in the DI method, as stated before. In the case of Kariba, jet deflection toward upstream of the impingement point is a specific concern, which may cause erosion toward the dam foundations. The current reshaping efforts have the objective of leading the deflection of the impinging jet toward downstream, thus avoiding further erosion toward the dam. With the pre-excavation works, the scour is expected not to deepen any further [14,16,17].
Other uncertainties arise from the parameters used in the model. For example, it is highly dependent on the considered wave celerity. Although the celerity used in this case is a robust result of the experimental campaign, in the future, the study can be extended to assess the influence of the block geometry relativeto the jet and pool geometric scales and the interlocking of the joints on the wave celerity. Moreover, the dynamic impulse applied on a rock block was computed while neglecting the stabilizing forces of the moving block as a simplifying assumption for the engineering practice.
The adapted DI method allows the simulation of changes in the jet air entrainment rates. Although purely hypothetical in the case of Kariba, the effects of adding air to the jets on the ultimate scour depth are represented in Fig. 9. The failure criterion used was hup/ z = 0.25. Increasing entrained air concentrations were simulated, starting with the estimated value of 48% of the existing jets, up to approximately 65%.
The results represented in Fig. 9 show that adding air to the jets reduces scour. The bottom elevation increases steadily with the entrained air concentration. Nevertheless, this elevation increase is small. The simulated air concentration increase of 17% resulted in an ultimate scour depth only 2.1 m smaller, raising the bottom from an elevation of 306 m a.s.l. to 308.1 m a.s.l.
《Fig. 9》
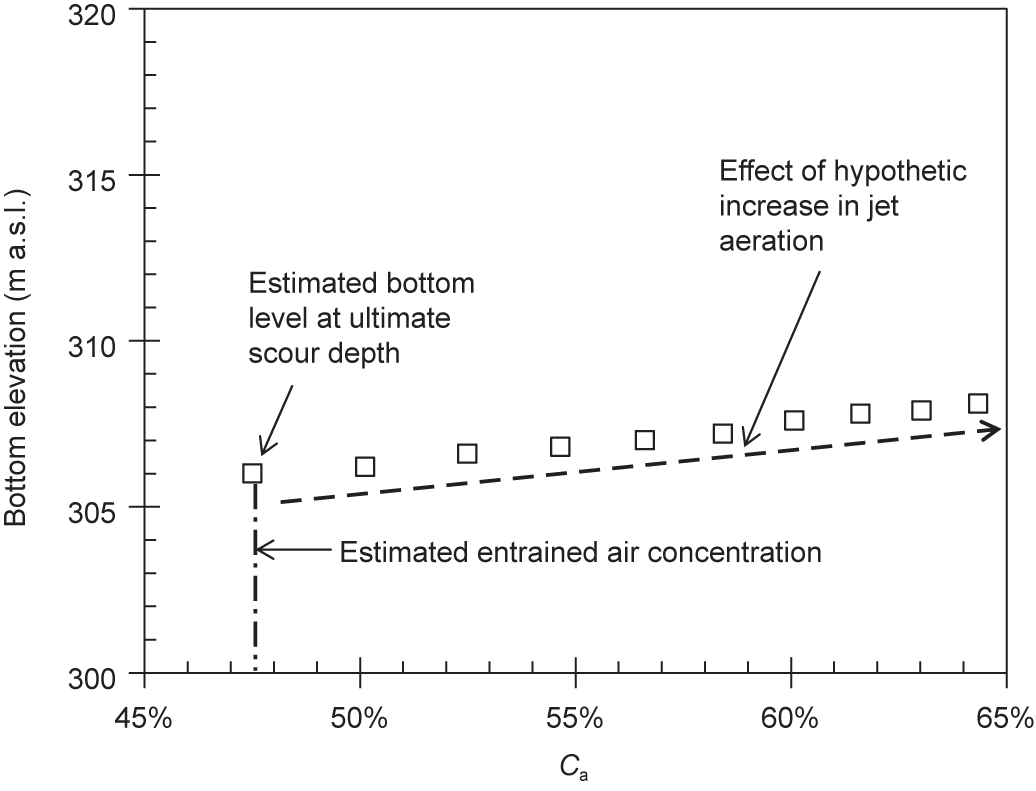
Fig.9 Bottom elevation of the Kariba Dam scour hole at the ultimate scour depth versus entrained air concentration Ca. The symbol “□ ” represents the model results, and the black dashed arrow represents the tendency of the results. Computational results were achieved with the adapted DI method, hup/ z = 0.25.
《4. Conclusions》
4. Conclusions
The proposed enhancements to a physically based scour model originally developed by Bollaert and Schleiss [2,3] take into consideration the influence of jet air entrainment by the use of systematic experiments with near-prototype velocity jets. With the proposed modifications, the CSM is the only engineering method to evaluate the erosion of rock downstream of jets issued from hydraulic schemes that is fully based on the physical-mechanical processes involving the three phases; namely, water, rock, and air.
The adaptations involve the time-averaged pressures attaining the water-rock interface as a result of the dissipation in the pool, which is greatly influenced by air entrainment. These pressures are represented by the aerated time-averaged pressure coefficient, which considers the lower density of the air-water mixture as well as the lower dissipation of the aerated jet flow in the pool, thus taking into consideration the recent findings of Duarte et al. [7].
Moreover, adaptations were proposed to the representation of the dynamic impulse applied on a dislodged block at the pool bottom. This feature is represented by the maximum dynamic impulsion coefficient, which was found to be a value of approximately 0.2, especially for high-velocity jets impinging into deep pools. Finally, the impulsion acting on a rock block is the combined influence of the aerated time-averaged pressure coefficient and the maximum dynamic impulsion coefficient.
A case study of the Kariba Dam scour hole was presented. The results are close to the bottom elevation obtained in the 1981 and 2001 surveys. Specifically, if the failure criterion is that a block is ejected whenever one quarter of its height leaves the cavity, the computed ultimate scour depth coincides with the measured elevation of the scour hole bottom (306 m a.s.l.). However, it was pointed out that the DI method only considers the erosion capacity of the impinging jet, and does not account for other scour mechanisms, such as the wall jet created by the deflection of the impinging jet on the water-rock interface.
Additional developments to the model may include the influence of the block dimensions relative to the jet dimensions and their influence on parameters such as the wave celerity and the maximum dynamic impulsion. Additional case studies will also help to validate the adapted model for engineering practice.
《Acknowledgements》
Acknowledgements
This research project was funded by the Portuguese Foundation for Science and Technology (FCT, Portugal) (No. SFPH/BD/51074/2010) and Laboratory of Hydraulic Constructions (LCH) of École polytechnique fédérale de Lausanne (EPFL).
Rafael Duarte, António Pinheiro, and Anton J. Schleiss declare that they have no conflict of interest or financial conflicts to disclose.


 京公网安备 11010502051620号


