
《1.Introduction》
1.Introduction
With rapid advances occurring in nanomaterials and nanotechnology, many new fluorescent nanomaterials have recently been developed [1], including semiconductor quantum dots [2,3], dyedoped polymeric or silica nanoparticles [4–6], metal nanoclusters [7], rare-earth-doped up-conversion nanoparticles [8,9], and carbon dots (CDs) [10,11]. Among these, CDs, which are also known as carbon quantum dots or carbon nano-dots, are especially attractive due to their low cost, earth abundance, excellent biocompatibility, and resistance to photobleaching [12,13]. Thus far, various potential applications, including biosensing [14], bioimaging [15], photodynamic therapy [16], solar cells [17], light-emitting diodes [18], andcatalysts, have been proposed for CDs [19], and have led to a huge amount of literature on the synthesis of fluorescent carbon dots (FCDs), ranging from candle burning to laser ablation and hydrothermal carbonization [20]. One of the frequently used approaches to synthesize bright nitrogen-doped CDs involves hydrothermal reactions of citric acid (CA) with nitrogen-containing bases [21]. For example, CDs with a record high quantum yield (94%) were prepared via hydrothermal treatment of a mixture of CA and ethylenediamine (EDA) at 160 °C [22]. Although hydrothermal methods are very versatile for the preparation of various nanomaterials, they still suffer from multiple disadvantages regarding the commercialization of commodity chemicals, including the high cost of the Teflon-lined stainless steel autoclaves that are used as reactors, the difficulty of real-time reaction monitoring due to their closed (or “black-box”) reaction processes, and the safety risks that are associated with the high-temperature and high-pressure reaction conditions [23]. Therefore, both for fundamental research and for industrial scale-up, it is important to develop a facile and scalable route for synthesizing high-quality CDs.
Herein, we report a facile and scalable approach to synthesize FCDs by reacting CA with EDA at 150 °C under ambient air pressure. FCDs prepared in this way can be well dispersed in aqueous solution. Having an optical bandgap of 3.4 eV and an excitation-wavelengthindependent blue emission (λEm = 450 nm), the newly developed FCDs were used as internalized fluorescent probes for two-photon excited imaging of cells by fluorescence lifetime imaging microscopy (FLIM) with a high-contrast resolution under 750 nm femtosecond (fs) laser excitation. Compared with the commonly used hydrothermal methods, the methodology developed in the present study has the following advantages: ① It involves much greener reactions that occur at relatively low temperature and ambient pressure [24];② it is safer and more scalable for mass-production; and ③ the newly observed excitation-wavelength-independent emission for the resultant FCDs is likely to lead to new research and development opportunities. The FCDs exhibited low cytotoxicity and long fluorescence lifetime, which are promising for bioimaging. Two-photon excited fluorescence imaging in HeLa cells by FLIM was performed using these FCDs as internalized probes. The FCDs were also successfully mixed with commercial inks and retained their fluorescence in the solid state, characteristics that are promising for solid-state fluorescent sensing, security labeling, and wearable optoelectronics.
《2.Materials and methods》
2.Materials and methods
《2.1. Preparation and characterization of fluorescent carbon dots》
2.1. Preparation and characterization of fluorescent carbon dots
The FCDs were prepared via reactions of CA with EDA by refluxing the reaction mixture at the ambient air pressure. In a typical procedure, 2 g of CA were dissolved in 3 mL of water within a 50 mL beaker. Next, 3 mL of EDA at room temperature were added. The mixture was heated up (~15 °C·min–1) and maintained at the boiling temperature of water for 30 min. A thermometer was used to monitor the reaction temperature. After the water completely evaporated, the reaction mixture was heated further and transformed from a yellow liquid into a dark brown, soft semisolid, allowing the condensation of CA and EDA to form polymer-like dots. By air-cooling the product down to room temperature, FCDs were obtained as brown solid powder.
A typical high-resolution transmission electron microscopic (HRTEM) image of the FCDs was taken using a Hitachi H-9500 TEM working in bright-field mode. The molecular weights of the FCDs were investigated by polyacrylamide gel electrophoresis (PAGE), using the Pierce™ Prestained Protein Molecular Weight Marker (Thermo Fisher Scientific) as the marker [25]. A PerkinElmer Spectrum GX Fourier-transform infrared (FTIR) spectrometer was used to obtain the F TIR spectra. X-ray photoelectron spectroscopic (XPS; VG Microtech ESCA 2000) measurements were performed using a monochromic aluminum (Al) X-ray source. Thermogravimetric analysis (TGA; TA Instruments) was measured in air with a heating rate of 10 °C·min–1. The absorption spectra of the FCDs were recorded using a Shimadzu UV-1800 ultraviolet-visible (UV-Vis) spectrophotometer. One-photon luminescence and excitation spectra were obtained using a fluorescence spectrophotometer (Hitachi F-2500). Two-photon luminescence spectra excited by a fs laser (750 nm, 150 fs) were recorded using an optical fiber spectrometer (Ideaoptics PG2000). The fluorescent lifetime of the FCDs was measured using a time-correlated single-photon-counting (TCSPC) system with 390 nm excitation and 450 nm emission.
《2.2. Cell culture and cytotoxicity studies》
2.2. Cell culture and cytotoxicity studies
HeLa cells were used for in vitro studies. The cells were typically cultured in commercial Dulbecco’s minimum essential media (DMEM) at 37 °C with 5% CO2. At 24 h before the in vitro cytotoxicity studies, the cells were cultured in 96-well dishes containing about 6000 cells in each well. The FCD samples were then added to each well to achieve a final concentration of 0, 50, 100, 150, 200, 250, and 300 μg·mL–1, respectively. The cytotoxicity of the FCDs after incubation with the cells for 3 h and 24 h was assessed by 3-(4,5dimethylthiazol-2-yl)-2,5-diphenyltetrazolium bromide (MTT) assay according to the manufacturer’s protocol. The cells without FCD treatment were considered to be control cells; their viability was estimated to be 100%, and they were used as a reference for the relative viabilities of the cells incubated with FCDs.
《2.3. Two-photon excited cell imaging》
2.3. Two-photon excited cell imaging
HeLa cells were used for in vitro cell-imaging studies. After the cells were seeded in 35 mm dishes for 24 h, 100 μL of an aqueous solution of FCDs (1 mg·mL–1) was added into the dishes. The cells without FCD additions were considered to be the control groups. After incubation with FCDs for 2h, the cells were washed with 1× phosphate buffered saline (PBS) three times. A confocal laser scanning microscope (CLSM; Olympus FV1000) combined with a fs laser excitation system (mode-locked Ti:sapphire laser system) and a PicoQuant MicroTime 200 FLIM unit were used for the FLIM imaging of the cells.
《3.Results and discussion》
3.Results and discussion
《3.1. Synthesis and characterization of fluorescent carbon dots》
3.1. Synthesis and characterization of fluorescent carbon dots
Fig. 1(a) illustrates the formation of the FCDs by the reaction of CA and EDA as the starting materials. The temperature of the mixture increased very quickly due to the external heating (~15 °C·min–1) and the heat released from the acid-base neutralization between CA and EDA. After about 5 min heating, the temperature reached the boiling point of water (100 °C), and significant bubble generation was observed due to water evaporation. After the water completely evaporated, the reaction mixture was heated further to 150 °C (measured by a digital infrared thermometer), allowing the condensation of CA and EDA to form polymer-like dots. Spontaneous self-assembling of the polymer-like dots led to nano-sized spherical FCDs. As shown in Fig. 1(b), this newly developed one-pot synthesis approach was also scalable for mass-production. Fig. 1(c) reproduces the HRTEM image for the resultant FCDs, and shows uniform nanoparticles with an average diameter of 3 nm. A corresponding enlarged HRTEM image given in the inset of Fig. 1(c) shows the crystalline structure of the FCDs. The lattice spacing of the FCDs was measured to be 0.205 nm, which is in agreement with the (102) facet of graphite [26]. PAGE studies of the FCDs also indicated that these FCDs have a narrow size distribution and a low molecular weight, as evidenced by the narrow electrophoretic band in the range of 20–25 kDa (Fig. 1(d)).
《Fig. 1》
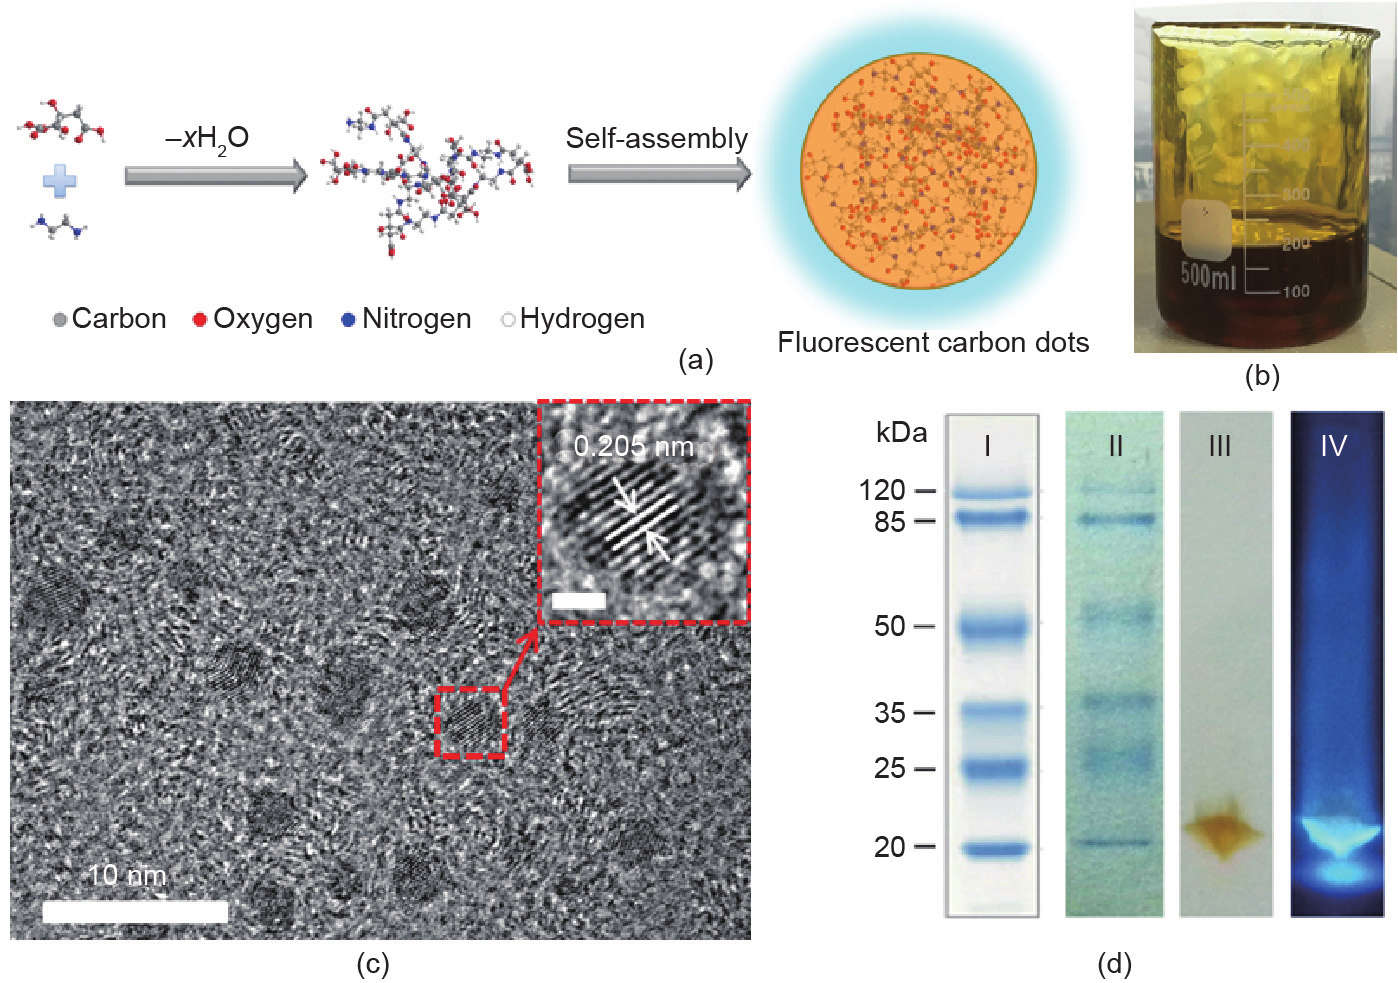
Fig. 1. (a) A schematic process for the formation of FCDs; (b) a photograph of mass FCDs obtained via one-pot synthesis; (c) a typical HRTEM image of the as-synthesized FCDs, where the inset represents the crystal lattice of an individual dot, and the scale bar in the inset is 1 nm; (d) PAGE measurements of the FCDs, where I represents a 12% Tris-glycine gel SDS-PAGE band profile of the Prestained Protein Molecular Weight Marker, II represents an SDS-PAGE of the Protein Molecular Weight Marker, III represents an SDS-PAGE of FCDs under visible light, and IV represents an SDS-PAGE of FCDs under UV illumination (365 nm). SDS: sodium dodecyl sulfate.
Fig. 2(a) reproduces the X-ray diffraction (XRD) pattern for the FCDs, which shows a broad peak that is characteristic of CDs with an ultra-small size. The corresponding F TIR spectrum in Fig. 2(b) reveals the characteristic peaks of —COOH (3431 cm–1 and 1638 cm–1),—NH (1576 cm–1), and C—NH—C (1125 cm–1). The XPS spectrum of the FCDs given in Fig. 2(c) shows the presence of carbon, nitrogen, and oxygen with atomic percentages of 62.4%, 21.5%, and 16.1%, respectively [27]. As seen in Fig. 2(d), an initial weight loss of 20% was observed by TGA; this loss was caused by the thermal desorption of physically adsorbed water by the FCDs. The subsequent thermogravimetric weight loss in the range of 200–500 °C was attributed to the loss of oxygen-containing groups. When the temperature was increased to over 550 °C, decomposition of the FCDs was observed in TGA.
《Fig. 2》
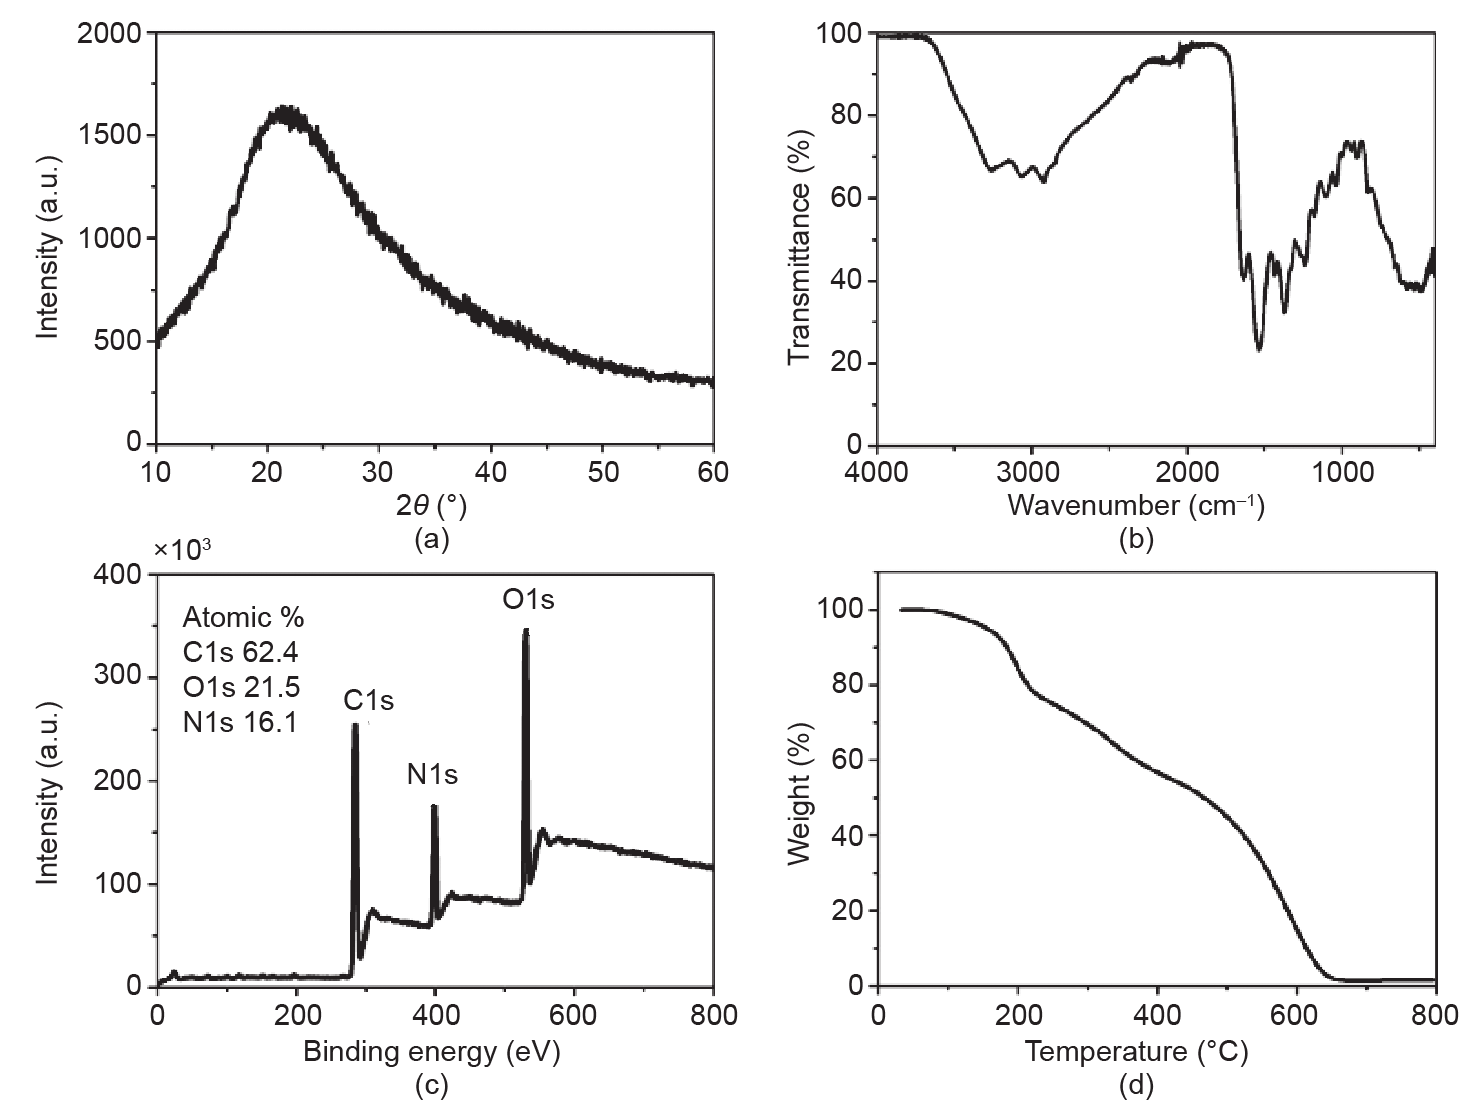
Fig. 2. Structure and composition characterization of the FCDs; (a) XRD; (b) FTIR, (c) XPS spectrum; (d) TGA results of FCDs in air.
《3.2. Oneand two-photon excited fluorescence of fluorescent carbon dots》
3.2. Oneand two-photon excited fluorescence of fluorescent carbon dots
Fig. 3(a) shows the optical absorbance and fluorescence emission spectra of the FCDs (1 μg·mL–1 in water) under visible light and ultraviolet (UV) lamp (365 nm) excitation in a darkroom. As can be seen from the digital images in the insets of Fig. 3(a), the colorless and transparent solution of FCDs in water exhibited bright blue emission under UV excitation. Fig. 3(a) shows a distinct peak at 350 nm that is characteristic of the n–π* transition of a carbonyl bond, along with a shoulder at 230 nm that is attributable to the π–π* transition of the nitrogen heterocyclic sp2 moieties. The absorbance spectra of CA and EDA were also measured, and no absorbance peaks were observed to occur over 250 nm (see Fig. S1 in Supplementary Information). Under UV excitation at 350 nm (i.e., absorption peak wavelength), the FCDs showed a fluorescence emission peak at 450 nm (Fig. 3(a)). The FCD excitation spectrum that was obtained by setting the emission wavelength at 450 nm exhibited a similar trend to the absorbance spectrum in the range of 200–400 nm (see Fig. S2 in Supplementary Information). To obtain an excitation-emission map, the FCDs solution was excited with excitation wavelengths over 300–450 nm. The emission intensity of the FCDs at various emission wavelengths (x-axis) was measured and then shown as a function of the excitation wavelength (y-axis) in the color scheme (Fig. 3(b) and Fig. S3 in Supplementary Information). As shown in Fig. 3(b), the FCDs exhibited an excitation-wavelength-independent narrow emission band at 450 nm, suggesting uniformity of both the size and surface state of these FCDs [28]. The quantum yield of the obtained FCDs was measured to be 42.7% when excited by 350 nm UV light.
《Fig. 3》
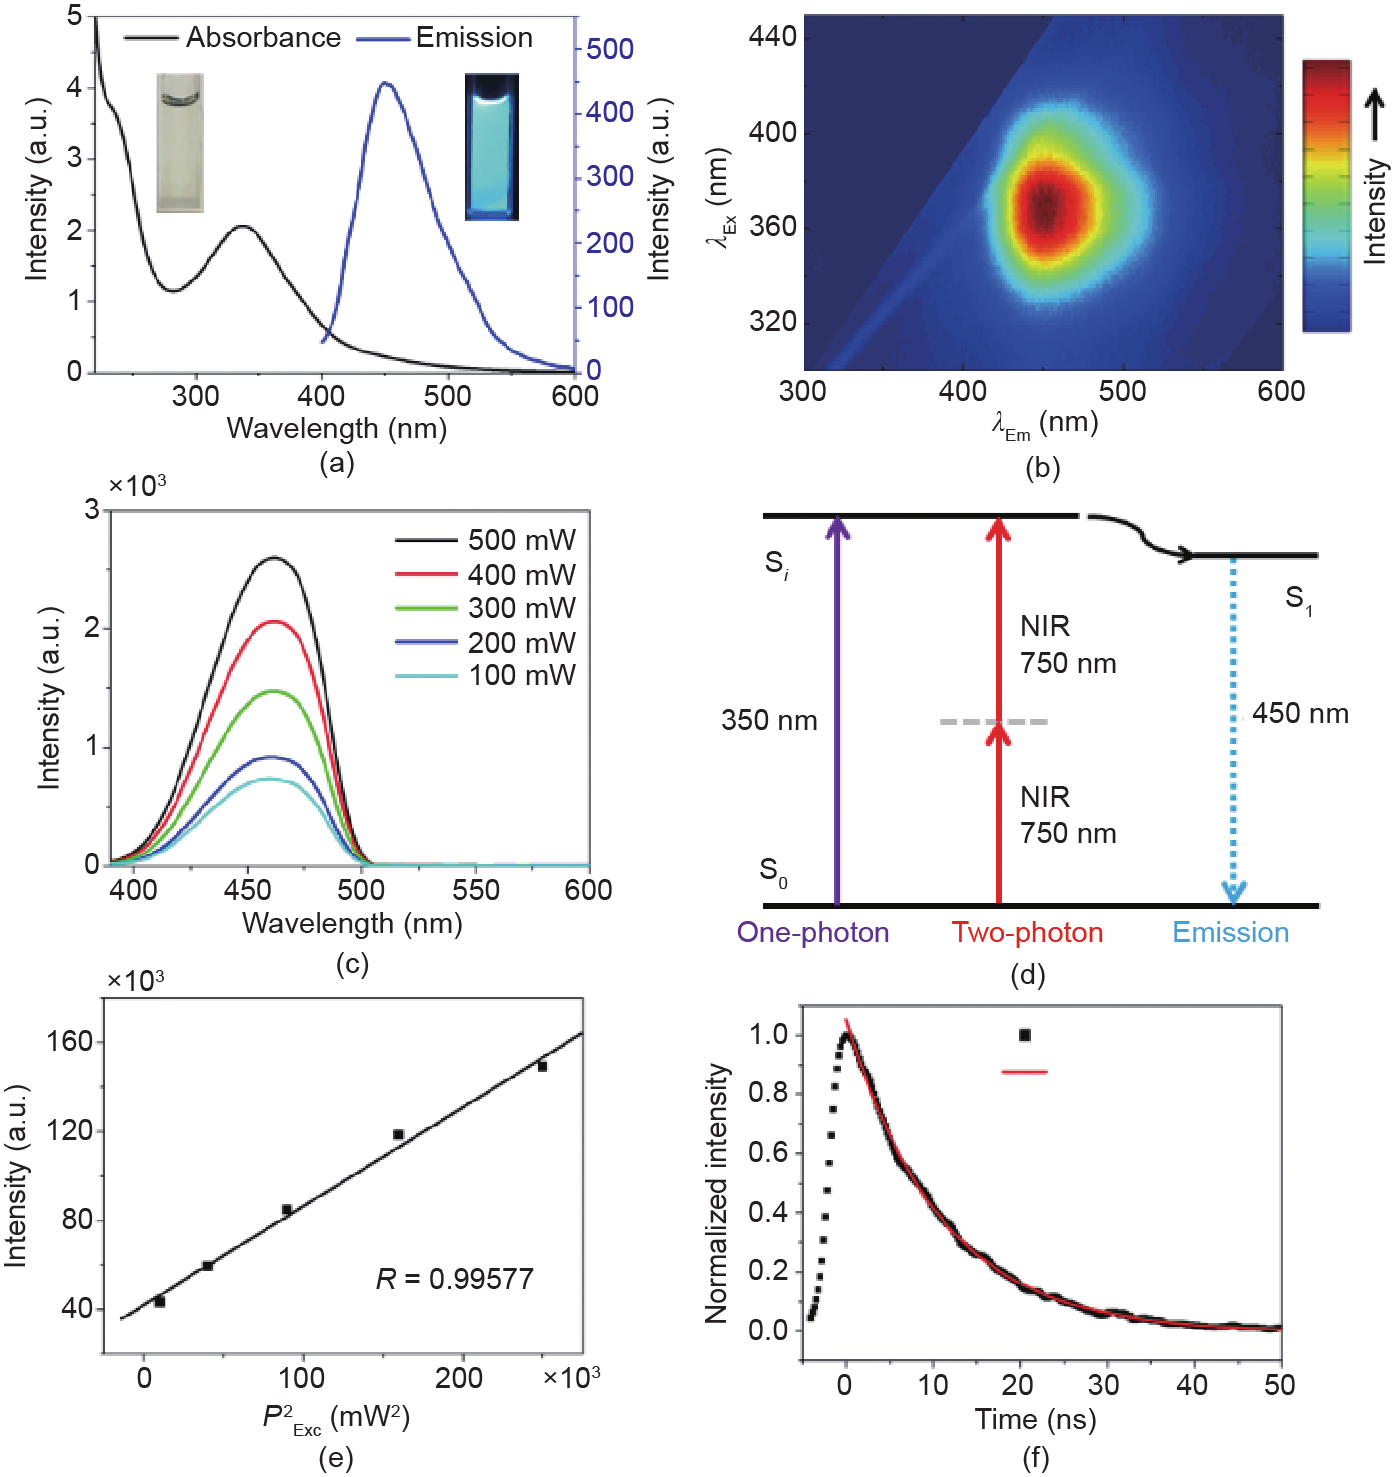
Fig. 3. (a) UV-Vis absorption (black curve) and one-photon excited fluorescence (blue curve) spectra for an aqueous solution of FCDs (1 μg·mL–1); the insets are photos of the FCDs solutions with daylight lamp irradiation (left) and UV lamp excitation (right). (b) Excitation-emission map of the FCDs. (c) Two-photon excited fluorescence spectra of the FCDs under excitation of a 750 nm fs laser at various power densities. (d) The proposed mechanism for one and two-photon excitation and for the fluorescence emission, where S0 represents the ground state, S1 represents the lower radiative state, and Si represents a higher electronic or vibronic state. NIR: near-infrared. (e) Quadratic relationship of the fluorescence intensity of the FCDs excited by a 750 nm fs laser at various powers. (f) Time-resolved photoluminescence (TRPL) decay curve and line fit for the FCDs excited with a 390 nm picosecond laser and monitored at 450 nm.
To investigate the two-photon excited fluorescence properties of the FCDs, we excited the FCDs (10 μg·mL–1 in water) with a 750 nm and circa 150 fs pulsed laser and used an optical fiber spectrometer to record the luminescence spectrum. The transmission spectrum of the FCDs was measured (see Fig. S4 in Supplementary Information), and showed negligible one-photon absorbance or extinction in the range of 600–900 nm. However, the two-photon excited fluorescence spectra of the FCDs by a 750 nm fs laser were observed in the wavelength range of 400–600 nm, with a peak maximum located at ~460 nm (Fig. 3(c)), which was similar to the counterpart under one-photon excitation (the blue curve in Fig. 3(a)). These results suggest that for both the oneand the two-photon excited fluorescence process, the excitons in the FCDs eventually relaxed to the same state, from which the fluorescence emission occurred (Fig. 3(d)). To verify the generation of the observed fluorescence emissions shown in Fig. 3(c) from the two-photon excitation, the emission intensities of the FCDs under fs laser excitation (at 750 nm) with various average powers were measured. As seen in Fig. 3(e), a quadratic relationship of the fluorescence intensity and the values of laser power was observed, which demonstrated that at least two photons were indeed absorbed at the same time in the two-photon process (Fig. 3(d)). The average fluorescence lifetime of the FCDs was estimated to be about 7.2 ns, according to the TCSPC results for the FCDs (Fig. 3(f)); this lifetime is significantly longer than that of the cell autofluorescence (1–3 ns) [29]. Therefore, these FCDs show promise for use as nanoprobes for fluorescence lifetime imaging in biomedical applications.
《3.3. In vitro cytotoxicity studies of the fluorescent carbon dots》
3.3. In vitro cytotoxicity studies of the fluorescent carbon dots
To investigate potential bio-related applications for the FCDs, we performed in vitro cytotoxicity studies on the FCDs in terms of cell viability by MT T assay. The relative cell viability of HeLa cells treated with FCDs at various concentrations after 24 h incubation (see Section 2 in this paper) is shown in Fig. 4. No significant decrease in cell viability was observed, even when the FCD concentration increased to 300 μg·mL–1, indicating a low cytotoxicity for the FCDs.
《Fig. 4》
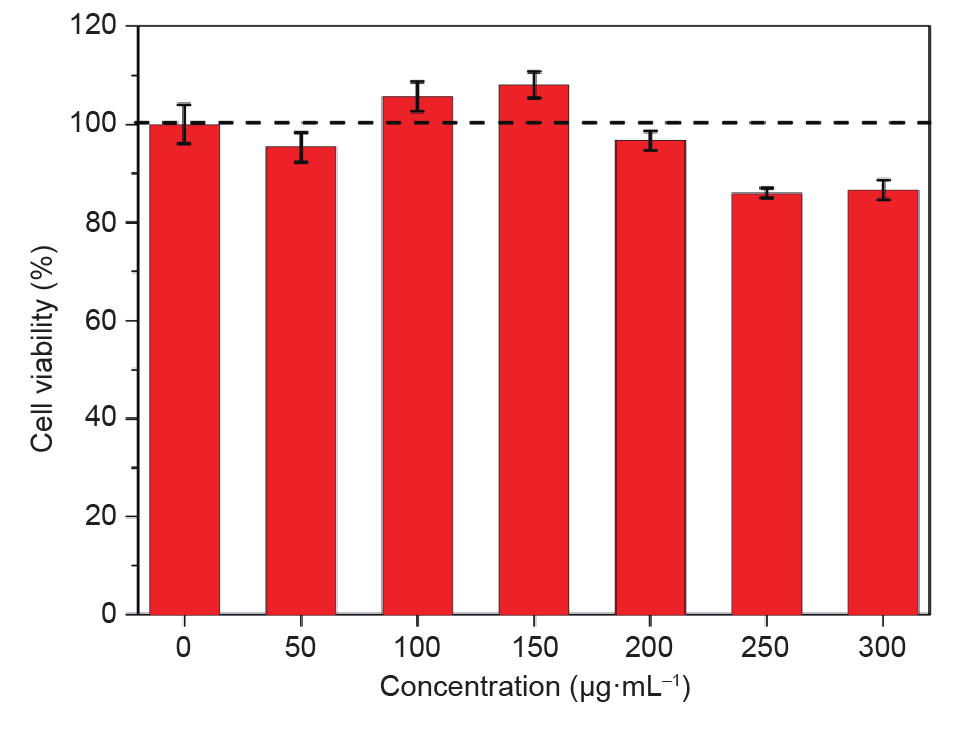
Fig. 4. Cell viability from MT T assays with different FCD concentrations after 24 h incubation.
《3.4. Fluorescent carbon dots for two-photon excited FLIM imaging of cells》
3.4. Fluorescent carbon dots for two-photon excited FLIM imaging of cells
Due to their bright fluorescence emission and low cytotoxicity, CDs have been previously used as fluorescent probes for cell imaging[30–32]. However, most of the previous studies on the bioimaging of CDs in cells were based on using the photoluminescence emission intensity of CDs to enhance the contrast between the cells and the background. Since CDs usually show photoluminescence emissions in the blue-to-green region (400–500 nm, Fig. 3(a)), where cellular autofluorescence is also very intense under short-wavelength excitation, the fluorescence signal from the CDs is hardly distinguished from the cellular autofluorescence unless there is a very high CD concentration in cells [30]. The long fluorescence lifetime of the FCDs prompted us to investigate their potential applications for fluorescence lifetime imaging in living cells. FLIM produces images based on the differences in fluorescence lifetimes from a fluorescent sample excited by two-photon excitation [33], making it possible to view the contrast between materials with different fluorescence decay rates (even if they fluoresce at exactly the same wavelength) [34]. Furthermore, the use of two-photon excitation (750 nm fs laser) is beneficial for potential deep-tissue imaging, due to the robust penetration capacity of near-infrared (NIR) excitation light in tissues. Fig. 5 shows the FLIM images of control cells (left column), of incubations with FCDs with a long fluorescence lifetime (~7.2 ns, middle column), and of graphene quantum dots (GQDs) [31] with a short fluorescence lifetime (~1 ns, right column). It is obvious that the long fluorescence lifetime of the FCDs facilitated the discrimination of the FCD fluorescence emission from the autofluorescence of the cells. These results indicate the great potential of FCDs for use as intracellular imaging probes for FLIM imaging.
《Fig. 5》

Fig. 5. (a–c) Bright-field, (d–f) two-photon excited FLIM imaging, and (g–i) recovered lifetime histograms of control cells without FCD treatment (left column), experimental cells incubated with FCDs (middle column), and GQDs (right column), respectively.
《3.5. Fluorescent carbon dots for patterning》
3.5. Fluorescent carbon dots for patterning
Due to the bright fluorescence of the FCDs, they were also combined with inks and used to draw patterns. The FCDs were added to a commercial ink (Hero 2104S), forming a homogeneous mixture. No significant precipitate or aggregates were observed after 7 d, indicating good stability of the FCDs in the ink. After drawing (Fig. 6(a)), the FCD patterns adhered well to commercially available papers and gave significant fluorescence emission over 400–600 nm under 365 nm UV lamp excitation (Fig. 6(b)), whereas the paper showed negligible background UV fluorescence over the same wavelength range (Fig. 6(c)). It was also observed that the FCD ink could be drawn onto many other substrates (e.g., certain flexible plastic films, textiles, and clothes) and that the fluorescence peak of the FCDs in the solid state was the same as that of the FCDs in solution, at 450 nm (Fig. 6(c) and Fig. 3(a)). After continuous irradiation under a UV lamp (365 nm) for 1 h, the pattern still showed a clear fluorescence signal (see Fig. S5 in Supplementary Information), suggesting that the FCD ink was photostable. These results suggest that the FCDs are promising for use in solid-state fluorescent sensing and anti-fake labeling.
《Fig. 6》

Fig. 6. Photographs of FCD patterns drawn using FCD ink under (a) daylight and (b) 365 nm UV lamp excitation; the scale bar is 1 cm. (c) Photoluminescence (PL) spectra of the FCDs in the solid state and background fluorescence of the paper.
《4.Conclusions》
4.Conclusions
In summary, we have synthesized novel FCDs via a one-pot reaction of CA and EDA at a low temperature and under ambient air pressure. The resultant FCDs are biocompatible and exhibit a strong excitation-wavelength-independent blue emission with a long fluorescence lifetime of about 7.2 ns. Their long lifetime facilitates the discrimination of the FCD fluorescence emission from the autofluorescence of cells, thus indicating that the FCDs are promising for use as internalized fluorescence nanoprobes for the two-photon excited FLIM imaging of cells in order to produce images with a high-contrast resolution. We also homogenously mixed FCDs with commercial inks and used the mixture to draw fluorescent patterns on normal papers and on many other substrates (e.g., certain flexible plastic films, textiles, and clothes), showing that the FCDs are promising for use in solid-state fluorescent sensing, security labeling, and wearable optoelectronics. We believe that these newly developed FCDs have unique properties and hold great potential for many multifunctional applications.
《Acknowledgments》
Acknowledgments
This work was supported by the National Natural Science Foundation of China (51641201, 21620102007, 61675071, and 61405062), the National Key Research and Development Program of China (2016YFA0201701/2016YFA0201700), the Fundamental Research Funds for the Central Universities (BUCTRC201601), and the “111” Project of China (B14004).
《Compliance with ethics guidelines》
Compliance with ethics guidelines
Dan Wang, Zhiyong Wang, Qiuqiang Zhan, Yuan Pu, Jie-Xin Wang, Neil R. Foster, and Liming Dai declare that they have no conflict of interest or financial conflicts to disclose.
Supplementary Information
http://engineering.org.cn/EN/10.1016/J.ENG.2017.03.014
Figs. S1–S5


 京公网安备 11010502051620号


