

《1.Introduction》
1.Introduction
《1.1. Biological wastewater treatment》
1.1. Biological wastewater treatment
Wastewater treatment is an important process for protecting both the environment and human health. Pollutants and bacteria in wastewater can cause severe damage to water resources, resulting in further damage to humans and other animals that come in contact with tainted water. For centuries, humans were able to simply release their waste into the environment with little or no effect, as the environment was able to take up the pollutants. With the growth of the human population, however, this is no longer possible; nature’s capacity for taking up pollutants has long been exceeded, and wastewater must be treated before release, or risk damaging both humans and the environment. Today, wastewater is collected from buildings (residential, industrial, business, medical, etc.) and enters sewer pipe systems. It then flows through pipes and pumping stations (which keep the flow moving) until it reaches a treatment plant. Many established processes are capable of treating wastewater effectively. However, as the human population continues to increase, more wastewater will be produced, creating a greater demand for treatment [1].
To meet the ever-increasing demand for wastewater treatment, new plants will need to be constructed and existing plants will require upgrades and expansions. These new plants and expansions will take up more space in population centers; however, as cities expand, less space will be available for treatment plants. To combat this problem, more efficient treatment processes will be needed that are capable of treating larger volumes of wastewater in less time than conventional methods. One technology that has been shown to have high efficiency in wastewater treatment is the circulating fluidized-bed bioreactor (CFBBR) [2], which was developed at the University of Western Ontario, Canada. This review covers the research that was done at the university on laband pilot-scale CFBBR systems used for the treatment of municipal wastewater (MWW) and of various industrial wastewaters.
The primary pollutants that must be removed from wastewater are carbon, nitrogen, and phosphorus, including organic compounds, ammonia, phosphates, and many other pollutants. Particulate and colloidal solids must also be removed. Finally, harmful pathogens need to be stabilized and/or destroyed [1].
The conventional layout of a wastewater treatment plant (WWTP) starts with primary treatment, which removes large solids through a physical separation process such as screening and gravity settling. This is followed by secondary treatment, where most of the biological treatment occurs. Finally, the wastewater moves to tertiary treatment, where it is chemically polished and disinfected (if necessary). Fig. 1 shows the basic layout of a WWTP that uses an activated sludge system.
《Fig. 1》

Fig. 1. Layout of a conventional WWTP.
Biological treatment processes are employed in the secondary treatment section. Biological treatment is carried out by microbial growth contained within bioreactors; the microbes consume the pollutants through their metabolic processes. Biological treatment generally comes in two forms: suspended and attached growth. In suspended growth, the microbial colonies (flocs) freely swim/ float in the mixed liquor. Mixing is mechanically induced, either by impellers or by air flow from the bottom. The most well-known suspended growth process is the activated sludge process (Fig. 1). Attached growth, also called fixed film, is characterized by a biofilm that is composed of bacteria, particulates, extracellular polymers, and gels growing on a support media (Fig. 2). The typical carrier media used for attached growth are rock or plastic. Ideal carriers are porous and have rough surfaces, allowing for more effective attachment than smooth, non-porous surfaces [1].
《Fig. 2》
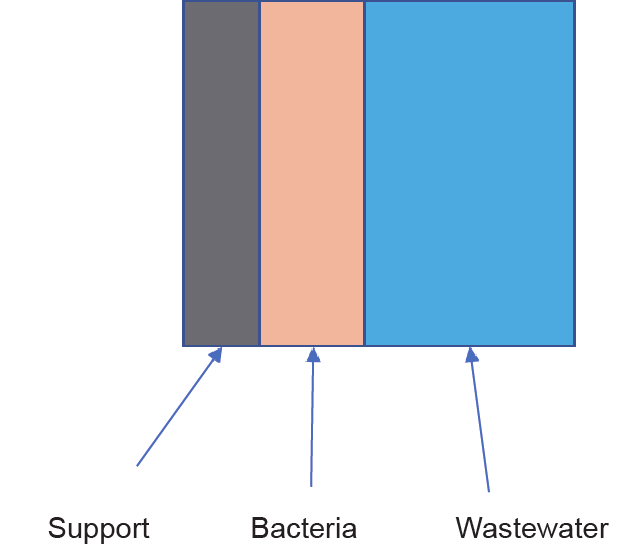
Fig. 2. Attached-growth biological treatment.
The four main processes that are carried out in general wastewater treatment are aerobic organic oxidation, nitrification, denitrification, and biological phosphorus removal. Through these processes, most of the carbon, nitrogen, and phosphorus are removed. These processes are carried out by different types of bacteria and require different environmental conditions and substrates [1]. The two main classes of bacteria involved are categorized based on the type of carbon they consume for cell growth: Heterotrophic bacteria consume organic carbon, whereas autotrophic bacteria consume inorganic carbon. The three main environmental conditions are aerobic (presence of oxygen), anoxic (presence of nitrates, little to no oxygen), and anaerobic (no oxygen or nitrates) conditions [1].
1.1.1. Aerobic organic oxidation
Heterotrophic bacteria oxidize organic material to gain energy and use it for biomass synthesis. The basic reaction is as follows:

As seen in reaction (1), the organic material (e.g., C5H7O3N) is broken down into carbon dioxide, water, and ammonia, using oxygen gas as the oxidizing agent [1].
1.1.2. Nitrification
Autotrophic bacteria carry out a carbon-fixation process using ammonia as the electron donor to convert inorganic carbon into organic carbon compounds. This reduction-oxidation reaction oxidizes the ammonia to form nitrites and then further oxidizes the nitrites to form nitrates. The same reaction is used by bacteria to gain energy for other cellular functions. Due to the lower growth yields and rates of autotrophic bacteria, most of the biodegradable organics in the liquor must be removed first. Otherwise, heterotrophic bacteria will dominate the growth and outcompete the nitrifying bacteria, leading to washout of the nitrifiers.

Reaction (2) shows ammonia being used as an electron donor to reduce inorganic carbon (HCO3– and CO2 ) into organic carbon. Some of the ammonia is also incorporated into the new biomass. Reaction (3) shows the overall oxidation of ammonia to form nitrates [1].
1.1.3. Denitrification
Certain bacteria have a nitrate reductase enzyme in their electron transport chain that allows them to substitute nitrates for oxygen as the electron acceptor. Through this process, nitrates are reduced in a series of reactions to diatomic nitrogen, which then bubbles out of the water due to its low solubility. It should be noted that this process can only occur in low-oxygen and high-nitrate concentrations (anoxic conditions); otherwise, the nitrate reductase enzyme will be inhibited [1].

Reaction (4) is similar to reaction (1) in that organic material is oxidized into carbon dioxide, water, and ammonia. However, in this case, nitrates have replaced oxygen as the electron acceptor. When the nitrates are reduced, they become diatomic nitrogen (N2) and leave the system as nitrogen gas [1].
1.1.4. Biological phosphorus removal
In addition to phosphorus removal by biomass synthesis, enhanced biological phosphorus removal (EBPR) occurs when large concentrations of phosphorus are present. EBPR is a two-stage process that is carried out by a group of bacteria called polyphosphate accumulating organisms (PAOs). These microbes are capable of storing large amounts of phosphates in the form of polyphosphate granules. This is a method of energy storage that is used to replace adenosine triphosphate when the aerobic metabolic pathways are not functional (i.e., in the absence of oxygen).
The first stage is an anaerobic process, in which the PAOs use their stored phosphate to take up and store organic material (acetate and short fatty acids), while simultaneously releasing phosphates into the water. The second stage is an aerobic process, in which the PAOs use the stored fatty acids as an energy source for taking up the phosphates in the water, and store the phosphates as polyphosphate granules. The microbes are then settled in the clarifier and recycled to the start of the process, and any excess sludge is removed. In EBPR, phosphates are ultimately removed in the waste sludge stored in the PAOs [1].
《1.2. Fluidized-bed bioreactors》
1.2. Fluidized-bed bioreactors
Fluidization is a process in which the upward flow of a fluid suspends a bed of particles. Fluidization offers many advantages, including excellent mixing, increased mass transfer, large specific surface area, and uniform particle and temperature distributions. Fluidization was first used in the 1920s for coal gasification [3]. Its second major application was fluidized catalytic cracking, which was developed in the 1940s [4]. Both processes utilized gas-solid fluidization, which has since been developed and applied to many other processes. Liquid-solid (LS) and gas-liquid-solid (GLS) threephase fluidization were developed later, and have been proven to have great potential and application in biochemical processes [5]. The basic outline and function of these two forms of fluidization are covered in the next two subsections.
1.2.1. Fluidization
LS fluidization works by means of an upward-moving liquid stream that suspends and/or entrains a bed of solid particles. Although several fluidization regimes exist, the two regimes used in wastewater processes are the conventional and circulating regimes. Fig. 3 and Fig. 4 [5] provide basic depictions of conventional and circulating fluidization systems, respectively. In conventional fluidization, the liquid velocity is insufficient to entrain the particles and wash them out of the column [3]. In circulating fluidization, a high liquid velocity is used to carry the particles to the top of the column and then return them to the bottom via a recycle line or column [6].
《Fig. 3》

Fig. 3. Conventional twin fluidized-bed system. Adapted from Ref. [5].
《Fig. 4》

Fig. 4. Layout of a liquid fluidized bed with particle circulation. Adapted from Ref. [5].
GLS three-phase fluidization has the same general layout as LS fluidization, except with the addition of an air distributor as well as the liquid distributor. In GLS fluidization, both the liquid stream and gas bubbles fluidize the particles. Like LS fluidization, GLS fluidization can operate in both conventional and circulating regimes [7]. However, depending on the specific requirements of the process, only one of the columns may have a gas distributor; thus, only one of the columns may operate with GLS fluidization. The process discussed in this paper follows this setup.
1.2.2. Principle of the fluidized-bed bioreactor
The fluidized-bed bioreactor (FBBR) is an application of the LS fluidized bed. These bioreactors can be run in a single or double column system, depending on the treatment process being carried out. The FBBR is an attached-growth process. The microbes attach to the fluidized media and form a biofilm on the surface (Fig. 5) [1]. Fluidization in the column is caused by the recirculating wastewater and/ or by the air stream, if the process includes aeration [5].
《Fig. 5》
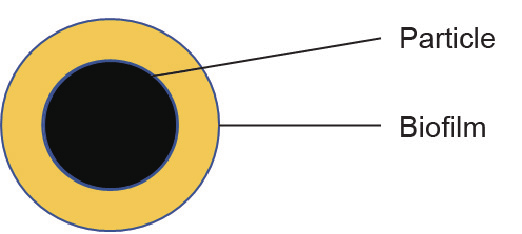
Fig. 5. Particle biofilm.
Like all fluidization processes, the excellent mixing, increased mass transfer, and enlarged surface area in the FBBR process enhance its function. The use of smaller particles than those in other attached-growth systems such as integrated fixed-film activated sludge (IFAS) and moving-bed bioreactor (MBBR) systems, coupled with excellent microbial attachment characteristics, results in much thicker biofilms; hence, the surface area of the film exposed to the water is much higher than in traditional attached-growth processes. The increased contact between the wastewater substrates and the biofilm also allows this process to break down larger compounds that are typically more difficult to treat. In addition, the FBBR has proved to be capable of handling larger loadings and operating at lower hydraulic retention times than a typical bioreactor.
《2.Circulating fluidized-bed bioreactor》
2.Circulating fluidized-bed bioreactor
The CFBBR system developed at the University of Western Ontario is a twin-column system that is capable of maintaining two different environments, which is advantageous for biological treatment [5]. The CFBBR has an aerobic column (medium to high oxygen) and an anoxic column (low oxygen, high nitrates), enabling it to achieve nitrification and denitrification in the same process. It can also be run with particle exchange between the two columns in order to enhance phosphorus removal due to transfer between aerobic and anaerobic environments [8]. The CFBBR has been tested in laband pilot-scale reactors to treat MWW and leachate.
《2.1. Scales of research studies》
2.1. Scales of research studies
2.1.1. Lab scale
CFBBR-1
The CFBBR was first tested with a lab-scale reactor (CFBBR-1) consisting of a riser, downer, and liquid-solid separator at the top of each column. A schematic of the system is shown in Fig. 6 [9]. The configuration of CFFBR-1 is similar to the circulating fluidization system shown in Fig. 4, which operates with particle circulation between the riser and downer. The system operates with the riser in the circulating fluidization regime and the downer in the conventional regime, with the liquid and particles being separated at the top in the LS separators. The particles at the top of the riser are transferred to the downer. Because the particles are more tightly packed in the downer than in the riser, the biofilm-rich particles transferred to the downer from the riser will lose their biofilm due to shear and abrasion as the particles collide with each other. As a result, the loss of biomass increases the density of the particles, enhancing their downward flow through the conventional fluidized bed. The particles in the bottom of the downer are recirculated to the riser bottom to begin the cycle again. The liquid at the top of the downer enters an LS separator, where most of the suspended solids (volatile suspended solids (VSS) and total suspended solids (TSS)) are separated for sludge wasting. The remaining nitrate-rich liquid is circulated back to the downer for fluidization and to the riser for fluidization and denitrification. In this apparatus, lava rock was used as the carrier media. The average particle diameter was 0.67 mm with a bulk and true density of 1720 kg·m–3 and 2560 kg·m–3, respectively. The lava rock had an approximate specific surface area of 9000 m2·m–3 [9].
《Fig. 6》

Fig. 6. Diagram of the CFBBR design showing the directions of the gas, liquid, and solid flow [9].
The system is designed so that the downer operates under aerobic conditions (three-phase fluidization) to achieve the biological organic oxidation and nitrification of ammonia. The riser operates under anoxic conditions (two-phase fluidization) to achieve the denitrification of nitrates. The system has also demonstrated potential for EBPR, albeit not to the same degree as a system that is specifically designed for EBPR. This is because the CFBBR lacks a true anaerobic zone, which is required for EBPR [1]. Table 1 [9] provides a summary of the influent and effluent qualities of the CFBBR.
《Table 1》
Table 1 Influent and effluent qualities of the CFBBR (unit: mg·L–1 ) [9].

COD: chemical oxygen demand; SCOD: soluble chemical oxygen demand; TN: total nitrogen; TP: total phosphorus.
CFBBR-2
The other system tested at the lab scale is the twin fluidized-bed bioreactor (CFBBR-2). Fig. 7 [10] provides a diagram of this system. Like the CFBBR-1, the CFBBR-2 consists of two columns: one aerobic and one anoxic. However, these columns are the same height, and both operate with conventional fluidization, similar to the configuration shown in Fig. 3. Since both columns operate in the conventional fluidization regime, no continuous particle exchange occurs. The CFBBR2 was designed after the discovery that particle circulation does not play a significant factor in the CFBBR treatment performance. Circulation of the particles is only necessary if enhanced phosphorus removal is required. When necessary, particle circulation between the riser and downer can be carried out by using impellers at the top and bottom of the columns to periodically transfer the particles, making particle circulation independent within the process. Particles at the bottom of the aerobic column would thus be transferred to the anoxic column and those at the top of the anoxic column would be transferred to the aerobic column [10]. This particular system has two columns of identical shape and volume; however, the column sizes can vary depending on the required hydraulic retention time (HRT) for each column.
Because this system operates with conventional fluidization in both columns, the shear rate on the biofilm is lower than in the CFBBR-1. This led to a much lower detachment rate and longer solids retention time (SRT), culminating in a much lower observed biomass yield for the overall system. The observed solids yield ranged from 0.06–0.071 g(VSS)·g(COD)–1 (COD: chemical oxygen demand) [10], which was significantly lower than the yields seen in CFBBR-1 [0.12–0.16 g(VSS)·g(COD)–1] [9]. The CFBBR-2 system was shown to have similar biological nutrient removal (BNR) performance and effluent quality to that of the CFBBR-1. Table 2 [10] summarizes the influent and effluent quality of the CFBBR-2.
《Fig. 7》
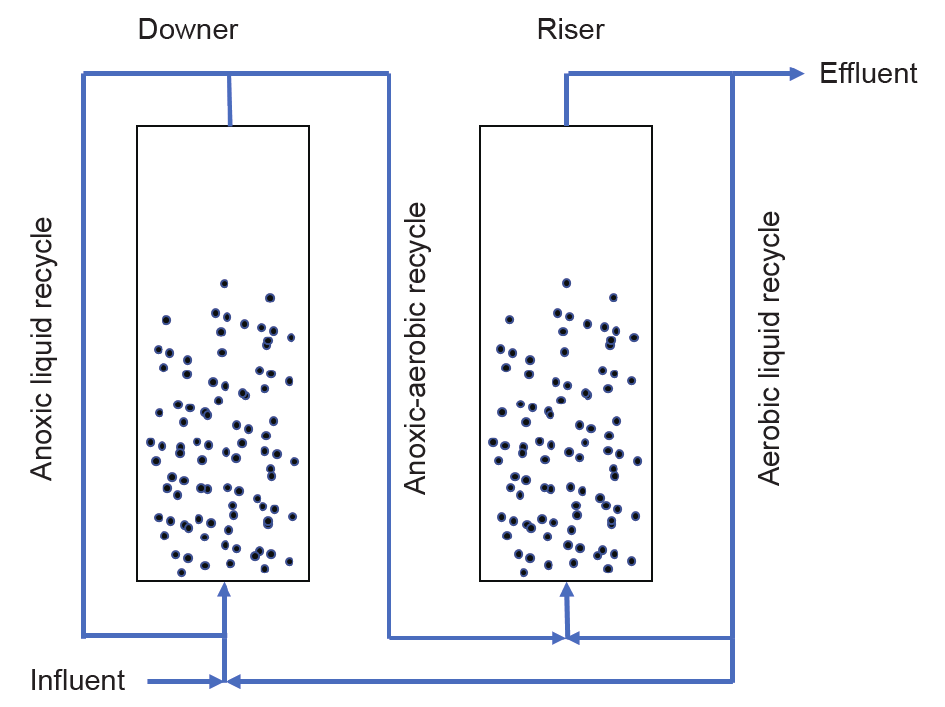
Fig. 7. Diagram of the CFBBR-2 system [10].
《Table 2》
Table 2 Influent and effluent quality of the CFBBR-2 system (unit: mg·L–1) [10].

The CFBBR-2 system was tested at various organic loading rates (OLRs) with synthetic loading of 1.3, 1.7, and 2.3 kg(COD)·(m3·d)–1. The effluent quality and BNR efficiency were similar for all of these loadings. Above an OLR of 2.3 kg(COD)·(m3·d)–1, the COD removal efficiency began to decrease due to increased shear on the particles and subsequent biomass detachment. However, in the lower OLRs, the detachment rate was measured to be much lower than that of the CFBBR-1 at both the lab and pilot scale, giving it a comparatively longer SRT [10].
2.1.2. Pilot scale
Following success at the lab scale, a pilot-scale system was established and tested at the Adelaide Wastewater Treatment Plant in London, Canada. As one of the City of London’s six wastewater treatment plants, Adelaide treats an annual average of 27 500 m3·d–1 [11]. The system had the same general configuration, layout, and operation as the lab-scale system. Fig. 8 shows the design of the pilotscale system [12].
《Fig. 8》
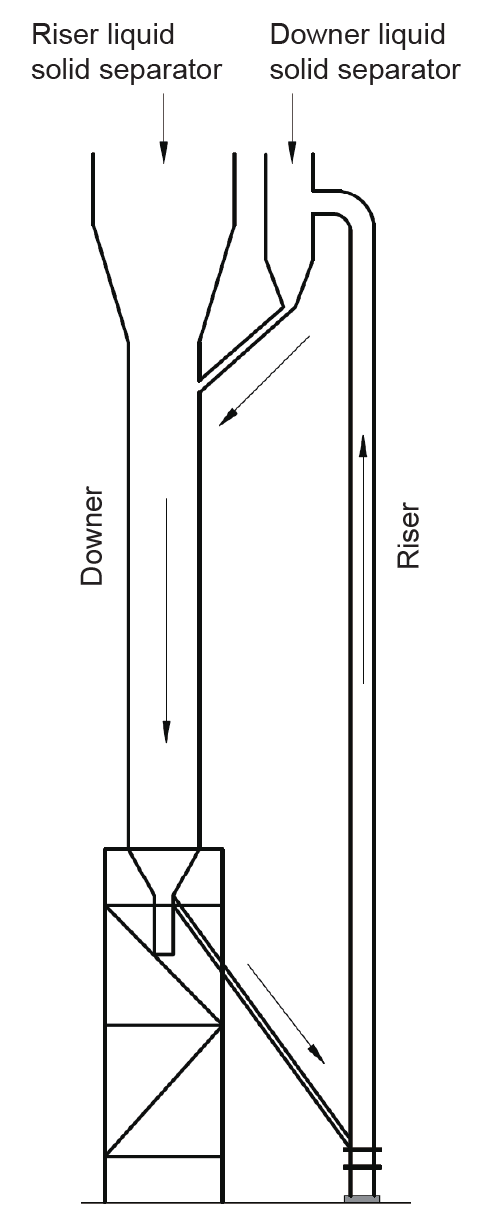
Fig. 8. Configuration of the pilot-scale CFBBR [12].
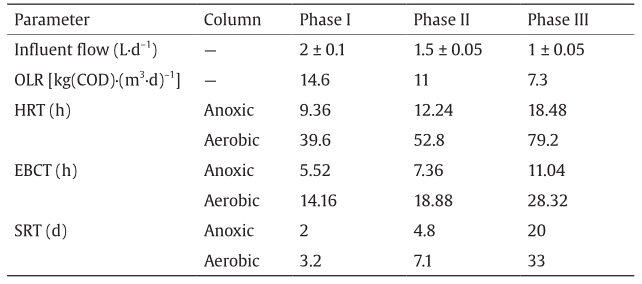
The carrier media for this system was lava rock, with a similar particle diameter (an average of 0.67 mm) and bulk density (1720 kg·m–3) as those used in the lab-scale system. The pilot-scale CFBBR was designed to treat 5 m3·d–1 of primary influent and achieved removal efficiencies that were close to those of the lab-scale system [12]. An exceptional aspect of this system was demonstrated by its effluent quality: The VSS and phosphorus concentrations were low enough to meet the required secondary effluent quality without the need for secondary clarification or chemical phosphorus removal. This system’s ability to handle high-solid feeds and produce low-solid effluent could allow future WWTPs to reduce the size and cost of their clarifiers [13]. Table 3 [12] provides the treatment data from all three phases of the study. The influent flow rates for Phases I– III were 2880, 4320, and 5800 L·d–1 on average, respectively. Table 4 [9,10,12,14,15] provides a full summary of the laband pilot-scale BNR efficiencies along with those of alternative technologies and methods.
《Table 3》
Table 3 Influent and effluent data of the pilot-scale CFBBR study (unit: mg·L –1 ) [12].

TCOD: total chemical oxygen demand.
《Table 4》
Table 4 Summary of BNR performance.

HRT = VReactor/Q; EBCT = VCompacted bed/Q (empty bed contact time); UASB: upflow anaerobic sludge blanket; AnMBR: anaerobic membrane bioreactor.
Typical activated sludge processes operate at aerobic HRTs of 4–24 h [1], so the fact that the CFBBR achieves comparable nutrient removal efficiencies at considerably lower HRTs clearly demonstrates this system’s effectiveness for BNR.
《2.2. Response to dynamic loading conditions》
2.2. Response to dynamic loading conditions
One crucial aspect of a wastewater system is its ability to handle dynamic loadings while still treating wastewater effectively and maintaining sufficient BNR. There are two common forms of dynamic loading. The first is a sudden increased flow with similar nutrient loading as before, resulting in a larger volume of diluted wastewater. An example of this would be wet weather flows [16]. The other form is organic shock loading, in which there is a sharp increase in the organics and/or solids concentration in water, while the volume remains unchanged [1]. Both forms of dynamic loading were tested in the pilot-scale system at the Adelaide Wastewater Treatment Plant.
2.2.1. Wet weather flows
Wet weather flows are a challenge for any plant in an area with frequent rain and snow. The increased volume of wastewater flowing through the same units results in a reduced residence time, thereby lowering the removal efficiency of the system. This causes the effluent to have higher than usual concentrations of pollutants. It is also possible in extreme cases for water to be sent through a bypass, forgoing any treatment at all. Both scenarios can be damaging to the environment unless handled properly [1].
Wet weather flows were simulated in the pilot-scale CFBBR at the Adelaide Wastewater Treatment Plant. Clean tap water was added to the influent to increase the volumetric loading, thereby simulating wet weather flows. The baseline flow rate started at 5 m3·d–1 of de-gritted MWW. The clean water was then added to increase the total flow to 10 m3·d–1 and again to 20 m3·d–1. Each of these increased flows was maintained for 4 h, the average time for an increased wet weather flow [17]. Considering that the system was designed for a 5 m3·d–1 flow rate, the flows of 10 m3·d–1 and 20 m3·d–1 correspond to peak flow factors of 2 and 4, respectively. A peak flow factor of 4 is a common design parameter when accounting for wet weather flows in the design of a wastewater treatment system [17].
As shown in Section 2.4.2, the steady-state COD, total nitrogen (TN), and total phosphorus (TP) removal efficiencies in the pilot were approximately 90%, 80%, and 70%, respectively. During the dynamic testing, there was a measurable decrease in effluent quality and organics and nutrient removal, but the levels remained within acceptable limits. This result was somewhat expected, since a decrease in efficiency is the main effect of hydraulic overloading [16]. The steady-state and dynamic effluent quality and BNR efficiencies are summarized in Table 5 and Table 6 [17].
《Table 5》
Table 5 Summary of steady-state and dynamic loading effluent quality in the pilot-scale CFBBR (unit: mg·L–1) [17].
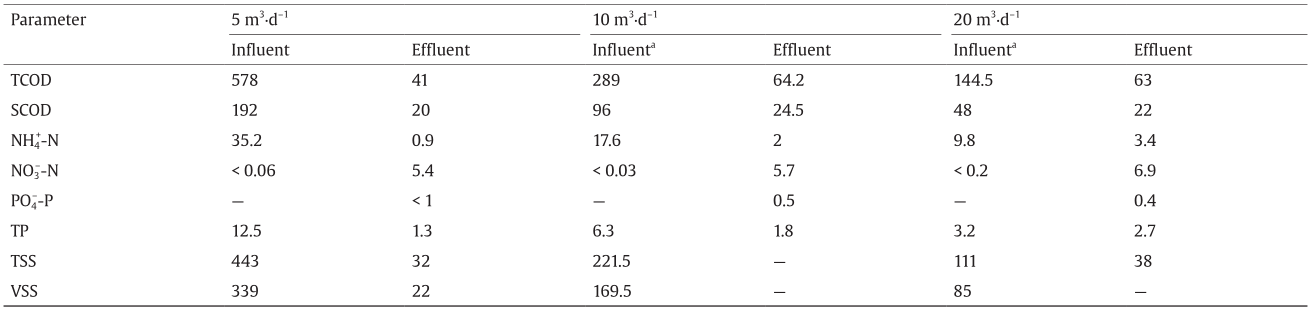
a Estimated from 5 m3 ·d–1 influent data.
《Table 6》
Table 6 Summary of dynamic loading BNR efficiency in the pilot-scale CFBBR [17].

The organic and nutrient removal efficiency did drop during the simulated wet weather flows. At twice the typical flow rate (10 m3·d–1), the removal efficiencies and effluent quality were within acceptable parameters [18]. However, at four times the flow rate (20 m3·d–1), the removal efficiencies effluent quality became too poor and no longer met acceptable standards. This result indicates that the maximum allowable wet weather flow is somewhere between 10 m3·d–1 and 20 m3·d–1; that is, perhaps three times the baseline flow rate (15 m3·d–1). The CFBBR could continue operating without the need for secondary clarification or chemical addition for phosphorus removal.
When the CFBBR’s response to dynamic loading was compared with those of other fixed-film processes, the CFBBR was found to have similar effluent quality and removal efficiency. Table 7 [17,19– 21] compares the treatment efficiency of several different processes with the CFBBR’s performance.
《Table 7》
Table 7 Comparison of dynamic loading effluent and nutrient removal percentages.

Aside from the immediate response of a system to dynamic loading, the other important factor is the system recovery—that is, how quickly the system returns to its steady-state effluent quality and removal efficiency. Past studies on conventional processes show that they can take anywhere from 7 d to 15 d to recover from sustained peaking factors of 2.5 for 2 h [1]. The study on the CFBBR’s recovery from hydraulic overloading showed that the system almost fully recovered within 24 h of the end of the peak flow. Table 8 [17] shows the changes in the attached biofilm, nitrification rate, and denitrification rate that were measured before, during, and 24 h after hydraulic overloading.
《Table 8》
Table 8 Biomass characteristics during the dynamic loading study [17].

2.2.2. Organic shock loading
Sharp increases in organic concentrations disrupt the biological processes occurring in the system. A large increase in biodegradable organic pollutants without a corresponding increase in available oxygen will result in the domination of non-nitrifying heterotrophs over the nitrifying autotrophs, due to the higher biomass yields and faster utilization rates of aerobic heterotrophs. This occurrence leads to washout (loss) of nitrifiers and to an overall decrease of nitrification efficiency. A large loss of nitrifiers can be difficult to recover from, due to their slow growth rates. Ultimately, there will be an increase in effluent COD and ammonia because of the drop in nutrient removal efficiency [1].
During a lab-scale study using the CFBBR-2 to treat synthetic wastewater, the system’s response to organic shock loading was tested by increasing the influent COD in a stepwise fashion. The influent COD concentration started at 420 mg·L–1 and was then increased to 720 mg·L–1 for 4.5 h, followed by a further increase to 1200 mg·L–1 for 4 h. 1200 mg·L–1 corresponded to an ultimate OLR of13.2 kg(COD)·(m3·d)–1. Liquid circulation and aeration rates remained unchanged during the shock loadings [22].
During testing, as expected, the nitrification efficiencies dropped from 95% to 49% due to heterotrophs dominating growth and to the limitations of dissolved oxygen (DO). The DO was measured in the riser and downer as 0 mg·L–1 and 2.5 mg·L–1, respectively, at its lowest. During steady-state operation, the DO was measured as0.3 mg·L–1 and 4.9 mg·L–1 in the riser and downer, respectively. The COD removal also dropped, although not as much as the nitrification efficiency, from 93.4% to 64.1%. Decreases in COD removal and in nitrification efficiency were seen in the effluent when both COD removal and nitrification efficiency sharply increased at the same time, 1.8 h into the test.
Batch-specific nitrification rate tests verified the decreased nitrification efficiency, which showed a 15% decrease in activity after the 10 h carbon shock load. This result indicates a 15% washout of the nitrifying biomass during the shock load. Despite the changes in biomass activity, the total amount of attached biomass measured in the system did not materially change during the shock load.
《2.3. Water reuse》
2.3. Water reuse
In addition to meeting typical secondary effluent quality standards without the need for additional treatment (clarification or chemical addition), the CFBBR was shown to generate an effluent that might be usable for non-potable reuse applications such as agricultural irrigation or industrial uses. In order for treated wastewater to be reclaimed, it must have reasonable disinfection characteristics—meaning that it must be easily disinfected without requiring large amounts of chemicals or energy. The two main requirements that must be met for reasonable disinfection are biochemical oxygen demand and TSS concentrations of less than 30 mg·L–1 [18], because meeting these requirements makes ultraviolet disinfection reasonable [9]. The CFBBR is capable of meeting or closely approaching these requirements during its steady-state operation. With some additional treatment, such as clarification or chemical addition, the effluent from dynamic loadings could also meet this standard.
《2.4. Additional design considerations, issues, and challenges》
2.4. Additional design considerations, issues, and challenges
2.4.1. Worm predation
The SRT in a wastewater treatment system can have a considerable impact on the solids yield. Longer SRTs typically lead to lower yields, since the biomass decays to a greater extent [23]. The solids yield can also be affected by the presence of larger organisms in the system that are capable of consuming the microbes, such as protozoans, metazoans, and oligochaete worms. These predators are aided by longer SRTs because a longer SRT gives them more time to consume the microbes [24,25]. In the past two decades, developments have been made in using worms for solids yield reduction in wastewater systems. In most cases, a separate worm reactor is employed between the activated sludge basin and the secondary clarifier [26].
The effect of worm predation in the CFBBR was studied at the lab scale. In this system, the worms were active in the downer, consuming the biofilm as the particles moved down the column. When the particles moved back to the riser, the biofilm would regrow until the particles returned to the downer to continue the cycle [27].
Overall, it was found that simultaneous COD and nitrogen removal could be achieved with worm predation integrated into the system. The BNR efficiencies were consistent with those of past studies and the system showed greatly reduced solids yields due to the worm predation. The study revealed an observed solids yield of 0.082 g(VSS)·g(COD)–1.
2.4.2. Effects of carbon-to-nitrogen ratio on BNR efficiency
To study the effects of the carbon-to-nitrogen ratio, a lab-scale study was conducted to examine how varying COD loading with constant nitrogen loading would affect the simultaneous COD and nitrogen removal. Since a high-COD concentration reduces nitrifier activity, fewer nitrates will be produced, subsequently enhancing the denitrifier activity [1]. COD/nitrogen (COD/N) ratios of 10 : 1, 6 : 1, and 4 : 1 were tested at the same empty bed contact time (EBCT) (0.82 h). The total COD removal did not vary much between the three phases, achieving above 90% removal throughout. However, the amount of COD oxidation occurring in the riser compared to the downer changed between the phases. At a COD/N ratio of 10 : 1, approximately 37% of the COD was oxidized in the riser. This relatively low value was due to that phase having the lowest amount of nitrates produced from nitrification. A COD/N ratio of 4 : 1 resulted in approximately 57% of the COD being oxidized in the riser. This higher value was due to a higher amount of nitrates being produced during nitrification. It was also shown that as the ratio became smaller, the amount of nitrogen removal decreased, with ratios of 10 : 1, 6 : 1, and 4 : 1 achieving TN removals of ~91%, ~82%, and ~71%, respectively. The first two phases both reached acceptable effluent quality, while the third phase did not, and would need additional treatment to reach an acceptable effluent quality [18]. All three phases showed low solid yields, a finding that was consistent with the other CFBBR studies; the yields of the three phases ranged from 0.11–0.15 mg(VSS)·mg(COD)–1 [28].
《3.High-strength wastewater treatment》
3.High-strength wastewater treatment
In addition to MWW, the CFBBR technology has been applied to the treatment of landfill leachate and to rendering waste. An aerobic platform called the anaerobic fluidized-bed bioreactor (AnFBR) was applied to the treatment of wastewater sludges (primary and secondary) and of thin stillage from bioethanol.
《3.1. Application of CFBBR in its basic form》
3.1. Application of CFBBR in its basic form
3.1.1. Landfill leachate
Landfill leachate forms when organic waste in landfills is broken down by the bacteria that are present and mixes with water, producing a high-concentration solution of soluble COD, ammonia, and other pollutants. Because of its toxicity, treating landfill leachate effectively is of high importance. The high concentrations of COD, ammonia, and heavy metals, along with many other pollutants, that are present in landfill leachate can seriously damage the environment if they are not properly treated and removed. In addition, the low carbon-to-nitrogen ratio of landfill leachate makes biological treatment challenging. As discharge limits become increasingly stringent, conventional biological treatment paired with physical and chemical treatment methods may no longer be effective enough for the treatment of landfill leachate [29].
In addition to being tested as a means of treating MWW, the pilotscale CFBBR located at the Adelaide Wastewater Treatment Plant was tested as a means of treating landfill leachate. Its integration of aerobic and anoxic conditions into a single process made it a suitable candidate to achieve higher required standards of treatment. The physical operation of the CFBBR system was the same as the operation when treating MWW. The anoxic riser operated in the fast fluidization regime and the aerobic downer operated in the conventional regime. For leachate treatment, the CFBBR was not run with particle circulation [30].
The pilot-scale CFBBR was tested at various loadings and corresponding HRTs with leachate taken from the W12A landfill in London, Canada. Table 9 [30] shows the three flow rates that were used and their corresponding loading values. Table 10 [30] shows the average influent and effluent quality from each stage.
《Table 9》
Table 9 CFBBR operating conditions for leachate treatment [30].

《Table 10》
Table 10 Influent and effluent quality of leachate (unit: mg·L–1) [30].

The CFBBR showed very low solid yields. For Phases I–III, the yields were 0.13, 0.15, and 0.16 g(VSS)·g(COD)–1, respectively; these are similar to the yields that were obtained when treating MWW in the CFBBR. In the second phase, at an OLR of 2.15, the CFBBR achieved COD, nitrogen, and phosphorus removal efficiencies of~85%, ~80%, and ~70%, respectively. These removal efficiencies are similar to those that were obtained when treating MWW in the CFBBR. However, the actual effluent concentrations from the treated leachate were higher, given the higher influent concentrations. Table 11 [30–34] compares the COD removal efficiencies of other treatment methods with those of the CFBBR.
《Table 11》
Table 11 Comparison of leachate treatment methods.

3.1.2. Rendering waste
The CFBBR was also used to treat another high-strength wastewater: rendering wastewater. Rendering comes from the livestockfarming and food-processing industry; it is produced when organic wastes are mixed together to form wastewater with high organic and nutrient concentrations. Like all high-strength wastewater, rendering wastewater must meet certain effluent quality standards before it can be discharged into municipal sewers [35]. For this study, a lab-scale reactor of the CFBBR-1 configuration was built at a rendering facility in Hamilton, Canada, using lava rock as the carrier media (0.67 mm in diameter, 1720 kg·m–3 in bulk density). The study was carried out in three phases with varying influent flows and OLRs [36]. Table 12 [36] provides a summary of the operating parameters of the reactor.
《Table 12》
Table 12 Summary of rendering treatment operational parameters [36].
The CFBBR showed excellent performance in treating the rendering waste. In Phase I, which had the highest OLR in the study, the COD removal efficiency was above 90% and the nitrogen removal efficiency was 79%. The solids yields in this test were similar to those in the other studies using the CFBBR, with an average yield of 0.12 g(VSS)·g(COD)–1. Table 13 [36] provides the influent and effluent parameters of the reactor.
《Table 13》
Table 13 Influent and effluent parameters of rendering treatment (unit: mg·L–1 ) [36].

Although the CFBBR had very high COD and nitrogen removal efficiencies, it was unable to meet sewer discharge requirements because the high influent COD concentration resulted in an effluent COD concentration above 1000 mg·L–1 in all phases of the study (whereas typical sewer discharge is 300 mg·L–1 [18]). Many of the other parameters were also above their allowable limits for discharge. However, the high removal efficiencies and low solids yields showed the CFBBR’s potential for treating rendering. Increasing the residence time of the rendering in the reactor could improve the treatment performance. Also, using a multistage treatment process or chemical polishing could improve the treatment performance and enable the CFBBR to meet discharge standards.
《3.2. Anaerobic fluidized-bed platform》
3.2. Anaerobic fluidized-bed platform
The CFBBR-2 has also been tested as an anaerobic platform for the treatment of high-strength and high-solids waste streams such as municipal sludges and corn ethanol thin stillage. A schematic of the AnFBR is shown in Fig. 9 [37]. Like the CFBBR, the anaerobic platform utilizes a biofilm attached to a carrier media to treat the wastewater; however, the microbes in this process are anaerobic. Because this process only requires an anaerobic environment (i.e., it does not require aerobic or anoxic environments), a single column was used and was operated in the conventional fluidization regime [37]. Due to the environmental requirements of the anaerobic microbes, the system had to be maintained at 37 °C and at a pH of 6.8–7.4 for ideal operation [1].
《Fig. 9》
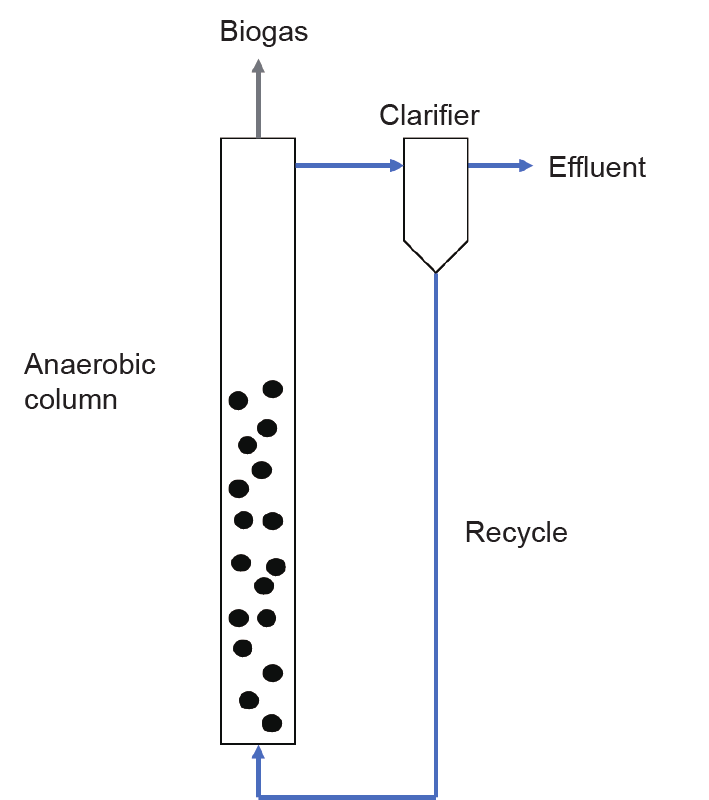
Fig. 9. Diagram of the AnFBR system [37].
3.2.1. Municipal wastewater sludge
Municipal sludge is a byproduct of the wastewater treatment process. Primary sludge (PS) is generated from the primary clarifiers following the screening and de-gritting of the wastewater, and is mostly composed of organic material. Activated sludge is settled in the secondary clarifier and later thickened to become thickened waste activated sludge (TWAS). TWAS is mostly active biomass, being composed of the bacteria and other microbes present in activated sludge. TWAS typically takes longer to treat because it is largely composed of active biomass [38].
The AnFBR was tested for the digestion of both PS and TWAS. The digestion of each sludge was tested separately at flow rates ranging from 1.8–16 L·d–1, corresponding to HRTs ranging from 8.9–1.0 d. The average influent for TSS was 38 989 mg·L–1 for PS and 34 834 mg·L–1 for TWAS, while the average total chemical oxygen demand (TCOD) was 37 488 mg·L–1 and 34 414 mg·L–1, respectively [37]. Table 14 and Table 15 [37] summarize the results from treating PS and TWAS, respectively.
《Table 14》
Table 14 Summary of PS treatment [37].

《Table 15》
Table 15 Summary of TWAS treatment [37].

As expected, the treatment of TWAS was less extensive than the treatment of PS because TWAS is largely composed of active biomass and is thus more difficult to digest, while PS is predominantly composed of inactive organic material. However, the AnFBR was able to effectively treat both PS and TWAS at considerably shorter HRTs than conventional methods while maintaining comparably high SRTs due to the large amount of biomass attachment [37].
The AnFBR achieved much higher VSS and COD removal efficiencies at much shorter HRTs, compared with conventional methods. In addition, it was able to achieve these efficiencies while operating at OLRs that were 5–10 times higher than those of conventional anaerobic digesters. Table 16 [37,39–41] compares the treatment results of the AnFBR with the results from several examples of conventional digestion methods.
《Table 16》
Table 16 Comparison of AnFBR treatment capability with those of conventional methods.

CSTR: continuous stirred-tank reactor.
3.2.2. Thin stillage
One of the feed stocks used to produce ethanol as a biofuel is corn. The corn is mashed and fermented, producing ethanol. The leftover mash and liquid of unfermented corn is a high-strength waste called stillage, which must be treated before discharge [42]. Although stillage can be repurposed as a food source for livestock, he drying process often makes this uneconomical, due to high energy requirements. Instead, anaerobic digestion is a suitable treatment method that can convert stillage into biogas, which can be recovered for energy production via combustion, while simultaneously removing a large portion of the organics present [43].
The treatability of thin stillage using the AnFBR was explored. The AnFBR was fed thin stillage at an OLR of approximately 29 kg(COD)·(m3·d)–1, an anaerobic HRT of 3.5 d, and a solid loading rate of approximately 10–10.8 kg(TSS)·(m3·d)–1. Despite the short retention time, the AnFBR achieved a TCOD removal efficiency of about 88% [37]. Table 17 [37] provides a summary of the major influent and effluent parameters.
《Table 17》
Table 17 Summary of thin stillage treatment (unit: mg·L –1 ) [37].

When compared with other anaerobic digestion technologies for the treatment of thin stillage, the performance of the AnFBR in treating thin stillage was similar to its performances when treating PS and TWAS. The AnFBR achieved comparable VSS and TCOD removal efficiencies at lower HRTs than conventional methods, thus demonstrating its great capability for treating high-COD and high-solids waste products. Table 18 [37,42,44] provides a comparison of the treatment efficiency of the AnFBR with those of other methods.
《Table 18》
Table 18 Comparison of AnFBR treatment of thin stillage with those of conventional methods.
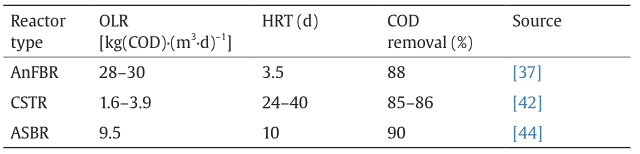
ASBR: anaerobic sequencing batch reactor.
《4.Modeling》
4.Modeling
Several models have been developed for the CFBBR using the modeling programs AQUIFAS and BioWin. AQUIFAS combines activated sludge and fixed-film kinetics into a single model. This model utilizes semi-empirical equations and a two-dimensional biofilm model [45–47]. BioWin models the biofilm processes as onedimensional fully dynamic and steady-state models. AQUIFAS was used for modeling MWW treatment, while BioWin was used for modelling leachate treatment. The models were used to predict the treatment performance of the CFBBR in treating MWW at the lab and pilot scale, and leachate at the pilot scale.
《4.1. Modeling municipal wastewater treatment using AQUIFAS》
4.1. Modeling municipal wastewater treatment using AQUIFAS
AQUIFAS unifies activated sludge and fixed-film processes to simulate particulate biofilm operations. It uses semi-empirical equations, incorporating Monod kinetics and the mass transfer kinetics of a biofilm, in order to simulate BNR. By changing the input parameters for the different loadings, the model calculates the theoretical effluent parameters and estimates the biofilm thickness on the particles. The AQUIFAS model has previously been used to successfully model the IFAS and MBBR processes, indicating its potential for modeling the FBBR process [48].
AQUIFAS was used to estimate the effluent parameters based on the pilot-scale data. The error from simulated to actual results varied between 0% and 60%. Most simulated results were close to the actual results, with deviations of 0%–30%, particularly the results for the COD, nitrogen, and phosphorus. However, the suspended solids results differed from the actual results by anywhere from 20% to 67%, although the results remained within the standard deviation [49]. Table 19 [49] provides the results of the simulation compared with the actual pilot study results.
《Table 19》
Table 19 Simulated vs. actual data from the pilot study (unit: mg·L–1) [49].

AQUIFAS was also used to model the CFBBR-2 process. This iteration of the model incorporated a predictive fluidization model, including both two and three phases. The fluidization was used to link the dynamics of the fluidized bed to the BNR efficiency more accurately. The model was based on the media type and size, flow rate, and cross-sectional area. It was then used to calculate parameters such as bed expansion, phase hold up, and specific surface area [50].
The simulated effluent data obtained was compared with experimental values from the CFBBR-2 study, and was confirmed with a two-sided t-test to be within a 95% confidence interval. The updated model that incorporated fluidization was a significant improvement over the previous AQUIFAS model. Table 20 [50] presents the comparative results.
《Table 20》
Table 20 Simulated vs. actual data (unit: mg·L–1) [50].

《4.2. Modeling leachate treatment using BioWin》
4.2. Modeling leachate treatment using BioWin
Leachate treatment using the CFBBR was modeled with BioWin. BioWin models the CFBBR systems as one-dimensional, fully dynamic, and steady-state models. It uses data on loading, biomass concentration, and biofilm thickness against experimentally obtained data from large-scale treatment plants. It also incorporates data on the amount of non-biodegradable and non-colloidal solids present (which are easily or readily measurable) [51]. Since the landfill leachate had a high soluble fraction of COD, the influent specifications needed to be altered from those of typical wastewater [52]. Table 21[52] shows the results of the simulation compared with the actual data from the leachate study.
《Table 21》
Table 21 Simulated vs. actual data of leachate treatment in the CFBBR (unit: mg·L–1) [52].

《5.Discussion》
5.Discussion
《5.1. The CFBBR》
5.1. The CFBBR
The CFBBR demonstrated its exceptional ability for treating MWW. It achieved COD removal efficiencies above 90% and the removal of nitrogen and phosphorus (80% and 70%, respectively) at very low HRTs. It was also able to handle higher solid loadings than conventional methods due to its enhanced contact between the substrates and the biofilm. Since the CFBBR was able to treat unclarified primary influent, it is possible for the influent to bypass primary clarification entirely, eliminating the need for primary clarifiers and thereby reducing capital costs. Overall, the CFBBR is capable of treating larger volumes of wastewater at lower retention times than its conventional counterparts.
The longer solid retention time of the CFBBR also leads to reduced solid/sludge yields. Low solids concentrations in the effluent stream could potentially eliminate the need for secondary clarifiers if the concentration meets discharge standards, which in some cases it did. Even in situations where the concentration is unable to meet discharge standards, the low solids concentrations of the CFBBR could at least reduce the size of the clarifiers needed and the amount of sludge produced, thus reducing the capital and operating costs for a plant. Lower overall sludge production from wastewater treatment would also reduce the required sludge treatment capacity. Less sludge to treat would lead to the possibility of using smaller digesters or incinerators for treatment.
《5.2. High-strength wastewater treatment》
5.2. High-strength wastewater treatment
The single-column anaerobic platform for the CFBBR had excellent results when treating high-strength wastewaters. Given the ability of the CFBBR to handle high-solids and COD loadings, it is well-suited for treating wastes such as municipal sludge and thin stillage. Conventional digesters for MWW sludge are often a large capital expenditure and require a large footprint. The significantly lower retention times of the AnFBR would allow the same volume of sludge to be treated in a much smaller reactor. This would reduce the cost and size of the digesters required to treat the sludge produced by the treatment plant. Coupled with the already lower solid/ sludge yield of the CFBBR, the use of the AnFBR would significantly cut down on the capital cost of treatment plants.
The AnFBR is also an excellent option for treating high-strength organic wastes from food industries such as dairy processing plants or breweries. The AnFBR can be employed to treat such waste streams and reduce the COD and solids concentrations in order to meet allowable sewer discharge standards.
《5.3. Modeling》
5.3. Modeling
The results of modeling using both AQUIFAS and BioWin were fairly accurate, with some variation of accuracy between parameters. More work needs to be done to increase the accuracy of modeling the effluent solids concentration. However, the other parameters were estimated accurately. Both the AQUIFAS and BioWin models could serve as viable bases for developing future models for the CFBBR during scale-up work.
《6.Future perspectives》
6.Future perspectives
The next stage in the development of the CFBBR is scaling up to a full-scale system that can be implemented at municipal treatment plants. Since fluidization is key to the process’s enhanced treatment capabilities, maintaining fluidization at a large scale will be the main focus of the scale-up work. The other aspect of the scale-up will be devising methods of retaining the particles within the system, or of recycling the entrained particles back to the reactor. Scaling up can take two possible directions: developing larger fluidized beds based on the same configuration as the laband pilot-scale systems, or modifying existing systems to add a fluidization component to enhance treatment performance. Once the scale-up is complete, the implementation of the CFBBR system offers great potential for reducing the capital and operating costs of treatment plants. The CFBBR’s compact design also presents an opportunity to establish wastewater treatment systems in a more geographically localized or isolated manner; for example, it could provide on-site treatment for remote resorts or small communities with little to no wastewater piping or treatment plants. Smaller systems could also be installed for individual buildings to avoid the need for wastewater collection and piping entirely. These small local systems would also be excellent for the immediate reclamation and reuse of wastewater, instead of discharging it to the environment, assuming that the wastewater meets reuse standards after treatment. These options show the great potential of the CFBBR for bringing a more effective means of wastewater treatment to places with established treatment systems in need of upgrades, and for introducing wastewater treatment into remote locations that currently lack any adequate treatment.
《Compliance with ethics guidelines》
Compliance with ethics guidelines
Michael J. Nelson, George Nakhla, and Jesse Zhu declare that they have no conflict of interest or financial conflicts to disclose.
Nomenclature
AnFBR Anaerobic fluidized-bed bioreactor
BNR Biological nutrient removal
CFBBR Circulating fluidized-bed bioreactor
COD Chemical oxygen demand
DO Dissolved oxygen
EBCT Empty bed contact time
EBPR Enhanced biological phosphorus removal
FBBR Fluidized-bed bioreactor
HRT Hydraulic retention time
MWW Municipal wastewater
OLR Organic loading rate
PAO Polyphosphate accumulating organism
PS Primary sludge
SCOD Soluble chemical oxygen demand
SRT Solids retention time
TCOD Total chemical oxygen demand
TN Total nitrogen
TP Total phosphorus
TSS Total suspended solids
TWAS Thickened waste activated sludge
VSS Volatile suspended solids


 京公网安备 11010502051620号


