

《1.Introduction》
1.Introduction
Large amounts of complex liquids with high viscosity, high salinity, and multiple components are used in the production of nonferrous metals, petrochemicals, coal coking, and other industries .Online real-time monitoring of the concentration of the target substances is of great significance for the real-time adjustment of the working conditions and for pollution reduction. For example, in the wet process of the nonferrous metallurgical industry, it is necessary to strictly control the target metal ions and impurities during the purification and aging of new electrolytes and during electrolyte mixing in order to ensure the quality of the electrolytes. However, because the high salinity, strong coating, multi-ion states, and multi-phase coexistence interfere with the electrolyte system, it is impossible to carry out online real-time monitoring with current technologies.
Given this problem,researchers worldwide have conducted preliminary investigations into the online real-time monitoring of complex liquids[1,2]. In the field of online monitoring for organic matter, Motteran et al.[3] developed an online liquid analysis chromatography–tandem mass spectrometry (LC–MS/MS) technique that was able to detect different anionic and nonionic surfactants in laundry wastewater and anaerobic fluidized-bed reactor effluent. Salazar-Beltrán et al.[4] achieved the automatic detection of three kinds of phthalates by coupling an online solid-phase extraction (SPE) technology with liquid chromatography–ultraviolet spectrophotometry (LC–UV) and using a flow injection technique. In the field of online monitoring for inorganic ions, Lv et al.[5] developed an electrochemical monitoring instrument capable of the fully automatic monitoring of heavy metal ions in water. Dadfarnia and Jafarzadeh[6] and Anthemidis et al.[7] developed online trace enrichment and atomic absorption spectrometry flow injection detection technology for cobalt, lead,and cadmium ions. Fasihi et al.[8] established a trace enrichment inductively coupled plasma (ICP) emission spectrometric method for the online real-time monitoring of uranyl ions during the process of the surface graft polymerization of silicon particles. Kozak et al.established two types of reverse-phase flow injection spectrophotometry for the online monitoring of the concentrations of phosphates and silicates[9] and of Fe2+and Fe3+[10].
However, all these methods require different degrees and methods of pretreatment. Their timeliness is poor and real-time monitoring, which is required for practical application and production, cannot be achieved. In addition, the analysis instruments used in these methods must be in contact with the test samples; this causes problems such as packaging, corrosion, and blockage. In this study, we present a monitoring method that is capable of non-contact original-state online real-time monitoring for strongly coated, high-salinity,and multi-component liquids; we describe the details of the method, present a case study, and describe a plant-scale application.
《2.Methods and case study》
2.Methods and case study
《2.1.Methods》
2.1.Methods
The steps of the method are as follows.
Step 1:Determine the target substance concentration and the type and concentrations of the other substances in the actual working solution.
Use instruments such as ICP–MS,spectrophotometry, and so forth to determine the concentrations of the target substance C1,...,Cm, and the types of other substances and their concentration ranges in liquid samples that are collected from the actualworking solution.
Step 2:Establish a color space corresponding to the concentration of the collected target substance.
Arbitrarily select an intermediate concentration Cx (where C1≤ Cx ≤Cm) from the concentration range C1,...,Cm and prepare a standard solution corresponding to this concentration. Determine the coordinate positions (L*,a*,b*) of Cx in the color space (Fig. 1).
《Fig. 1》
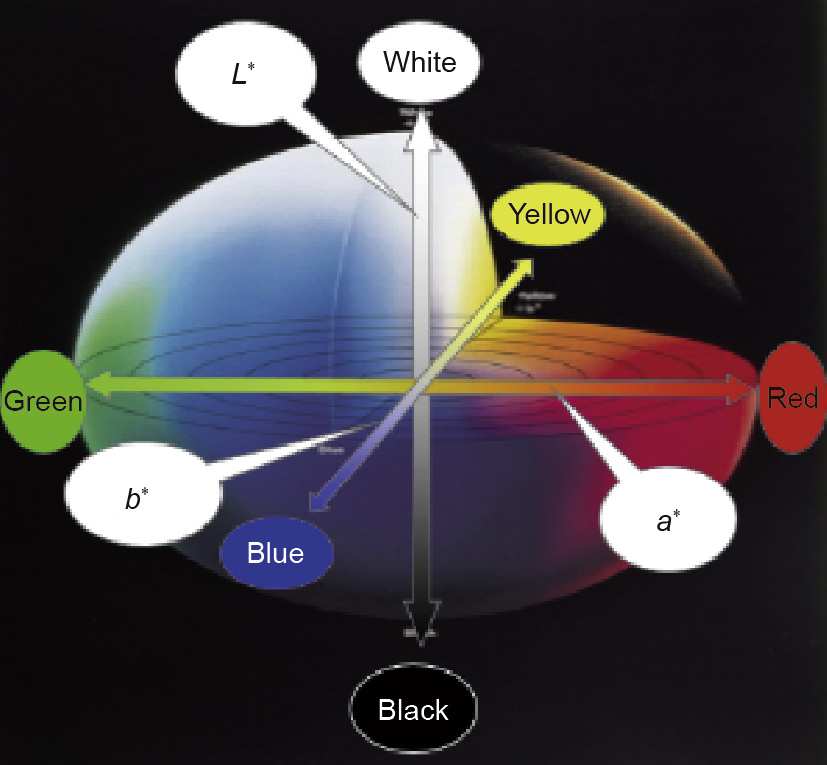
Fig.1.Color space spherical chart.
Prepare standard solutions for the concentration collection C0,C1,...,Cx—1,Cx,Cx+1,...,Cn (where C0≤ C1 and Cm ≤Cn). Establish the corresponding relationships among the different concentrations C0–Cn and their coordinate positions (L*,a*,b*), and obtain the corresponding color space.
Step 3:Select the optimum wavelength λT for the corresponding color space.
C0,...,Cx,...,Cn determines the corresponding color space. Based on the corresponding relationship between color and energy in the light, determine the maximum absorption wavelengths λ0,max ,…… ,λx,max ,…… ,λn,max ,of C0,...,Cx,...,Cn.By comparison among(c0,λ0,max),……(cx,λx,max),……(cn,λn,max), select the optimum wave-length λT from λ0,max ,…… ,λx,max ,…… ,λn,max.
Step 4:Establish the relationship C→A for the actual liquid.
(1)Using the principle of spectrophotometry and the Beer–Lambert law A=abC (where A is the absorbance, a is the absorption coefficient, b is the liquid thickness, and C is the target substance concentration), obtain A0,...,Ax,...,An by the standard samples of the known concentrations C0,...,Cx,...,Cn and establish the initial relationship of C→A.
(2)Use the selected λT to determine A', the absorbance of the other components in the solution, to be measured from the actual working solution.
(3)Deduct A' and establish the calibration curve of C→A for the actual working solution:A*=abC*A'.
(4)Perform a spike recovery experiment to slightly adjust"ab”and"A”in order to obtain the final C→A relationship: A=abC–A'.
Step 5:Use the light strength information of the liquid incident light/transmitted light to express the target substance concentration of the actual working solution.
The actual working solution is continuously input to a non-contact identification device. While the liquid flows continuously, a dedicated optical system with wavelength λT continuously illuminates one side of the non-contact identification device; at the other side of this device, a high-precision scanning-type monitoring system is used to continuously express the digital information of the light strength of the flowing liquid,as shown in Fig. 2.
《Fig. 2》
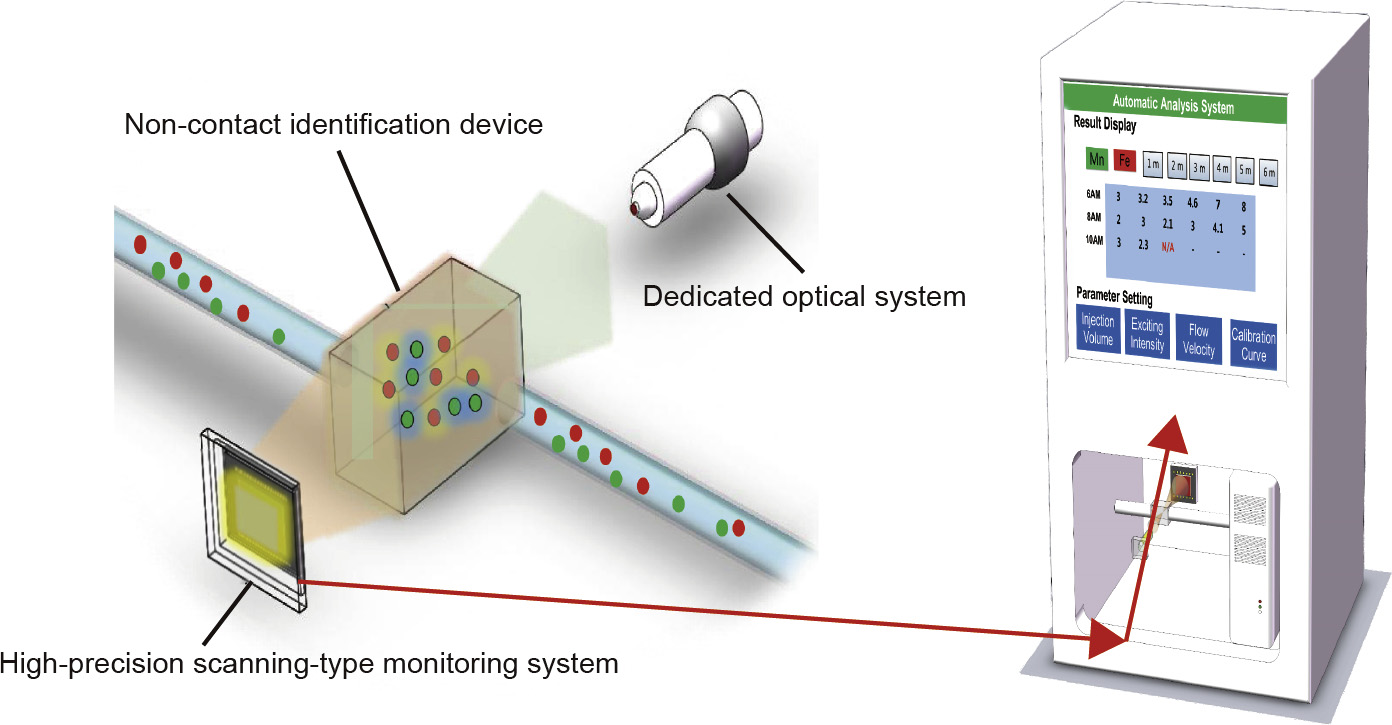
Fig.2.Configuration of light strength detection of the flowing liquid and display of the results.
The high-precision scanning-type monitoring system transmits real-time signals to an intelligent analysis-and-control system,where the absorbance is transformed into an instantaneous target substance concentration using a mathematical model.The online monitoring concentration of the target substance is obtained after data optimization by determining the data with high dispersion and then averaging the data,as shown in Fig. 3.
《Fig. 3》
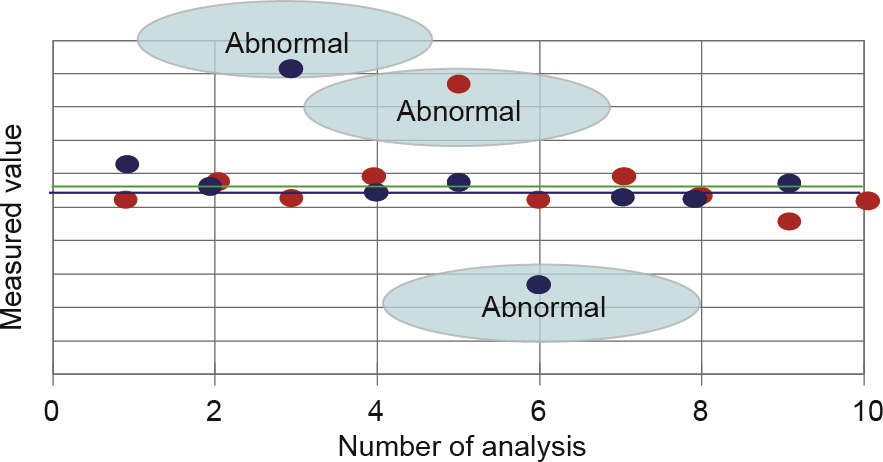
Fig.3.Schematic diagram of the digital information of the flowing liquid.
《2.2.Case study》
2.2.Case study
The target substance was trivalent iron ion (Fe3+) in a liquid form. The ICP–MS analysis showed that the concentrations of Fe3+, manganese ion (Mn2+), and ammonium sulfate ((NH4)2SO4) were 0.5–18 mg·L-1,35–39 g·L-1, and 90–110g·L-1, respectively. In addition, the solution contained nearly saturated ions of calcium and magnesium and trace amounts of cobalt, nickel, copper, and other heavy metal ions. The solution that was monitored had a very complex composition, had high salinity, was strongly coated, contained multiple ions, and had multiple phases.
Standard solutions of Fe3+at concentrations of 0.1,0.5,1,5, and 20 mg·L-1 were prepared. The color space coordinates of the standard solutions were measured. The results are shown in Table 1 and Fig. 4 (D65 is a deuterium lamp).
《Table 1》
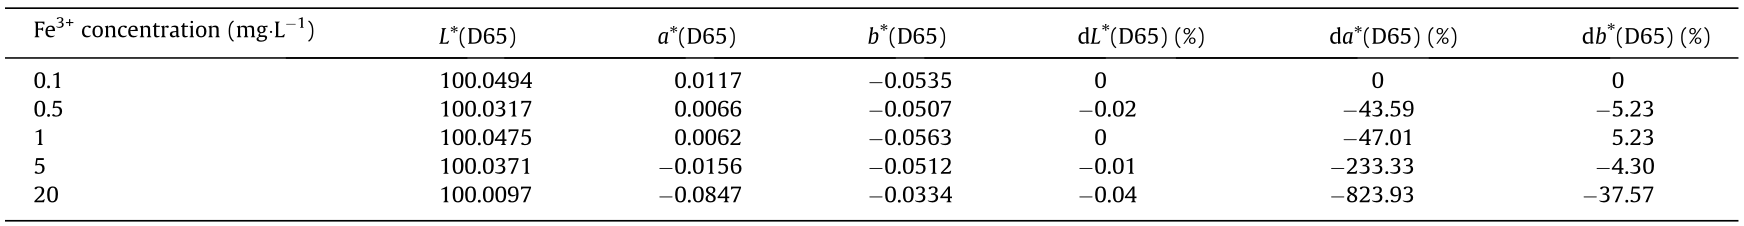
Table 1 Color space coordinates of different Fe3+ concentrations and their changes.
《Fig. 4》
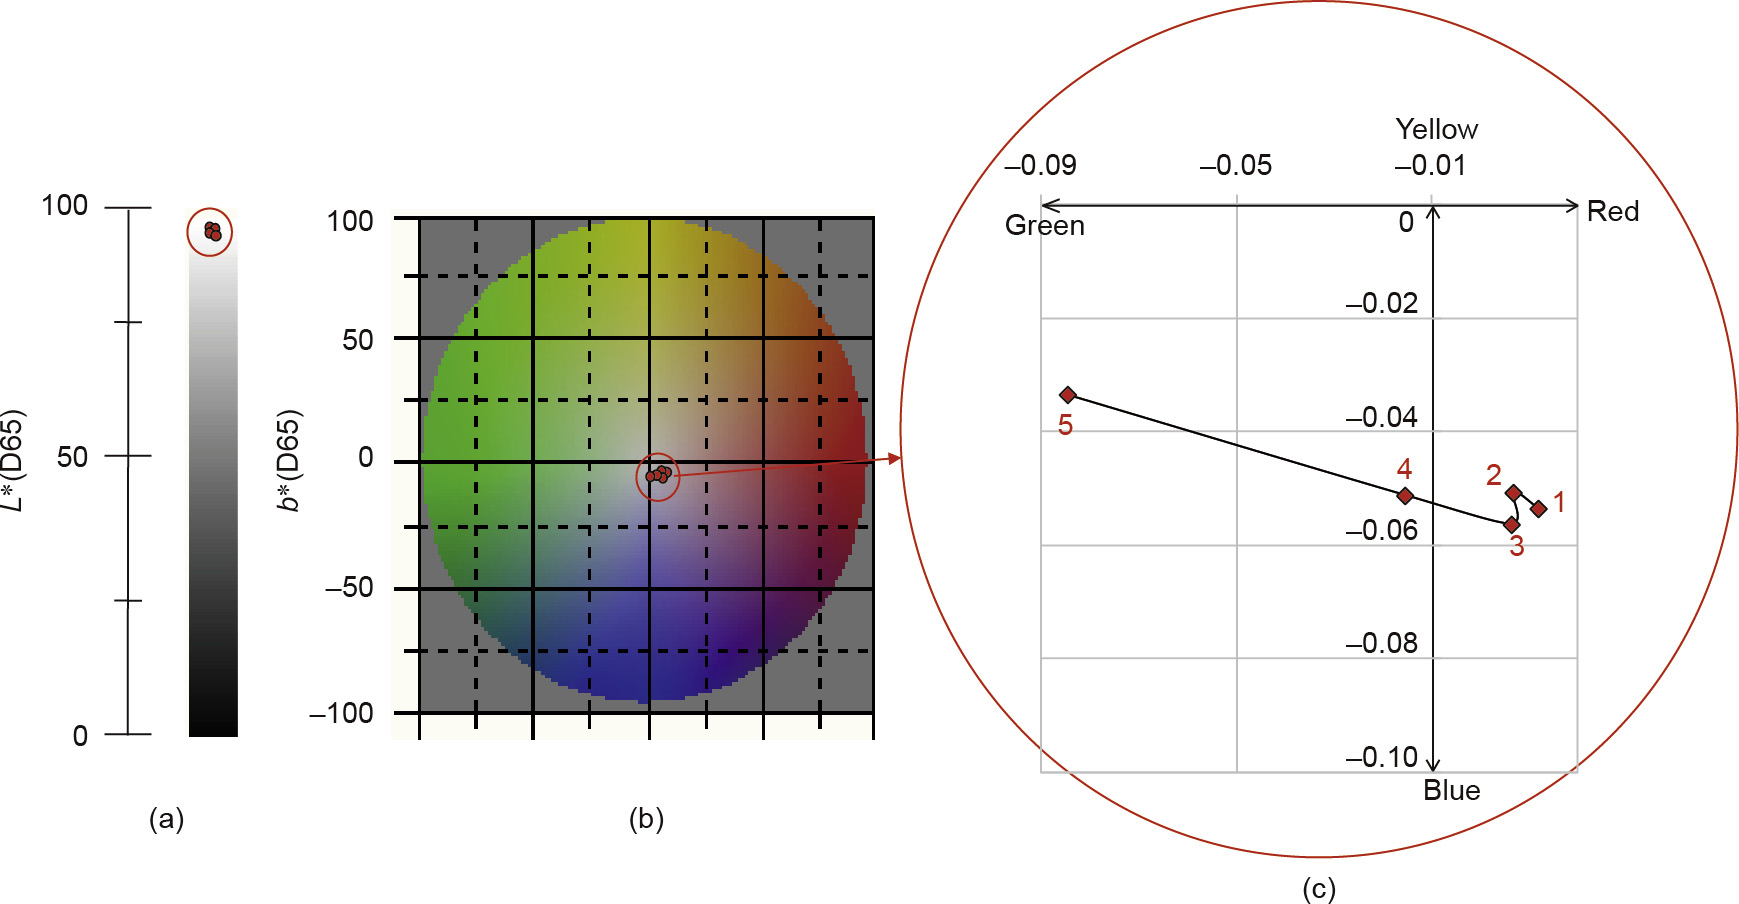
Fig.4.Distribution of color space corresponding to changes in the Fe3+concentration.(a)The L*axis of the color space;(b)the plane of axis a*and axis b*in the color space;(c)the enlargement of(b).
As can be seen from Table 1, as the iron ion concentrations increase from 0.1 to 20 mg L-1, the change in the value L* in the corresponding color space is very small, at -0.04%; the change in b* is larger, at -37.57%; and the change in a* is in the negative direction (green) and is the largest, at -823.93%. The red dots in part Fig.4(a) are the coordinates of the five Fe3+concentrations on the L* axis of the color space; the red dots in Fig.4(b) are the coordinates of the five Fe3+ concentrations on the plane of axis a* and axis b* in the color space; and Fig.4(c) is an enlargement of Fig.4(b).
The maximum wavelengths λmax for Fe3+ for the five standard solutions containing different Fe3+ concentrations are shown in Fig. 5. It can be seen that in the actual measurement, the most sensitive wavelengths of the five concentrations of the Fe3+ solution are not exactly the same, but are all around 300 nm (Fig.5). Therefore, 300 nm was selected as the optimum wavelength (λT=300 nm).
《Fig. 5》

Fig.5.Analysis of optimal wavelength corresponding to the Fe3+concentrations.
Based on λT=300 nm,the absorbance corresponding to the five concentrations of Fe3+ inTable 1 is obtained by the Beer–Lambert law.The corresponding initial working curve of  is
is

Based on λT=300 nm, A', the absorbance of other components in the solution (such as of Mn2+, (NH4)2SO4, impurity ions,etc.) is measured in the actual working solution: A'=0.00211.
The actual working solution is tested at λT=300 nm,and the absorbance Atotal is obtained from the ultra-high-precision spectro-graph. Subtracting A', the absorbance of other components in the solution, from Atotal generates, the calibrated curve of the actual working solution is

The Fe3+ spike recovery experiment that was performed showed there was no need to adjust "ab”and "A”in the above equation; therefore,theworking curve is finally obtained,as follows:

The online real-time monitoring concentration of Fe3+ is obtained using the device shown in Fig.2 and Eq.(3).
《3.Demonstration project》
3.Demonstration project
《3.1.Problems occurring during the aging process of wet electrolysis》
3.1.Problems occurring during the aging process of wet electrolysis
In the electrolysis of a sulfate water solution, which is commonly used in the electrolytic manganese and electrolytic zinc industries, the iron in the ore enters the electrolyte during the leaching process and a redox reaction occurs on the cathode ( Eqs.(4) and (5)) and anode (Eq.(6)) of the electrolysis cell. The iron ions in the electrolyte reduce the current efficiency and decrease the purity of the target product. Therefore, it is important to strictly control their concentration.

Static aging is the final control process of the iron ions during the electrolytic process;the aging time ranges from 4 to 72 h. Its main function is to achieve complete iron ion purification through the colloidal mechanism. During the aging process,the iron ions undergo irreversible structural changes, and colloidal particles of the nuclei are continuously growing and are removed. Aging tanks are widely used in the electrolytic manganese, electrolytic zinc, and other industries, and many large tanks are required, which adds to the cost. Some representative aging tanks are shown in Fig. 6. If the aging time is too short, the concentration of the steady-state iron ion will exceed the standard;if the aging time is too long, the load of the liquid preparation process is too high, which results in a high cost that enterprises cannot bear.
《Fig. 6》
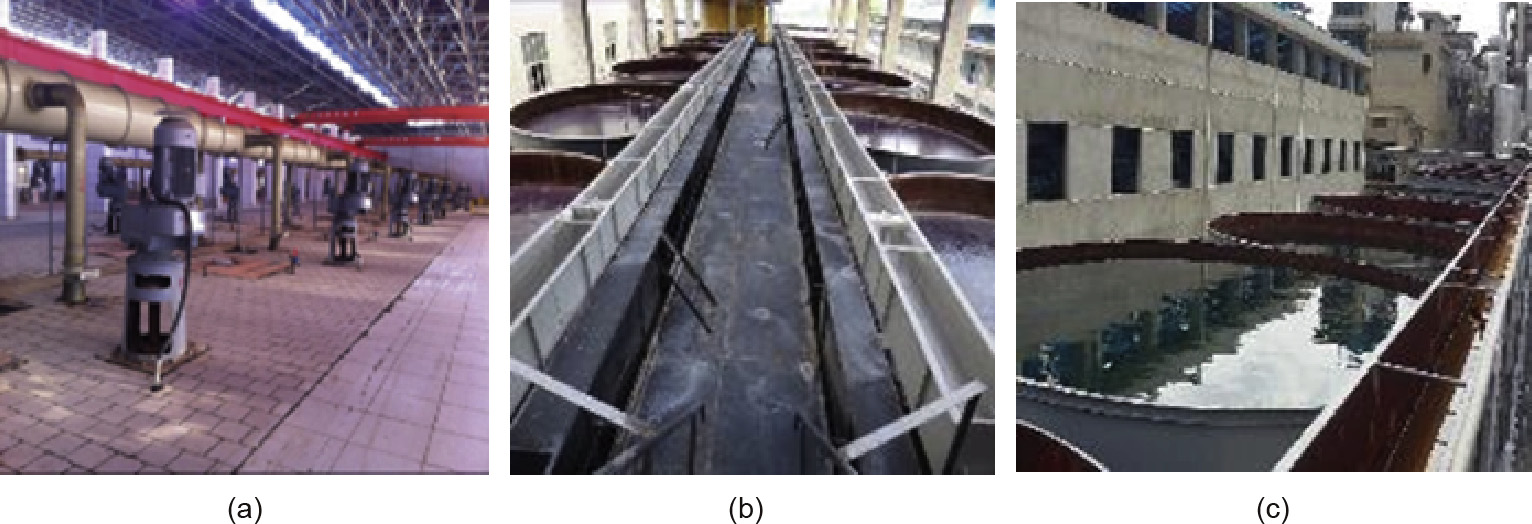
Fig.6.Aging tanks in the electrolytic manganese industry and electrolytic zinc industry. (a)34 400 m3 aging tanks in demonstration plant with a capacity of 300 000 t of electrolytic manganese per year; (b)3800 m3 aging tanks in a plant with a capacity of 105 000 t of electrolytic zinc per year; (c)3500 m3 aging tanks in a plant with a capacity of 105 000 t of electrolytic zinc per year.
Enterprises generally use the traditional visual colorimetric method for qualitative analysis and chemical titration method for quantitative analysis; some enterprises use spectrophotometers, ICP–MS, and other equipment for testing. The complexity of the various heavy metals that coexist in the aged liquid is sufficiently high for it to severely affect the coloration of the complex extract, resulting in the distortion of the qualitative result of the colorimetric method. The chemical titration method is not accurate, and it is difficult to obtain the concentration values of the trace metal ions precisely. Spectrophotometry involves many pretreatment steps—such as filtration, dilution, constant volume, oxidation /reduction, acidification, and coloring—which tend to result in large analysis errors and long periods of analysis; thus, it is difficult to meet the requirements of the production process using these methods. The ICP–MS method requires filtration, dilution (salinity <0.1%), constant volume, acidification (2% nitric acid), and strict operating requirements; otherwise, the inverse error is extremely large .In addition, the abovementioned methods require many staff members, large amounts of chemical agents, and especially long analysis periods; thus, the time required to obtain results affects the production time. There is no real-time feedback for the range and stabilization of the steady-state iron ion concentration in the liquid. Therefore, there is an urgent need for enterprises with wet electrolysis processes to develop a fast and accurate online analysis technology for the total dissolved iron ion.
《3.2.Process flow and operation results》
3.2.Process flow and operation results
The demonstration project is set up in the aging plant of a large-scale electrolytic manganese enterprise, in its liquid preparation system. There are 86 aging tanks in the plant,with a volume of 448 m3(8 m×8 m ×7 m) each; the effective volume totals 38 528 m3 (448 m3 ×86). The plane layout of the aging plant is shown in Fig. 7. The demonstration project uses aging tank 12 (capacity: 65 000 t ·a-1 electrolytic manganese liquid) in the fourth aging workshop, as shown in Fig.7. Online real-time monitoring is carried out at six levels with three angles for each level in the aging liquid of the tank.
《Fig. 7》
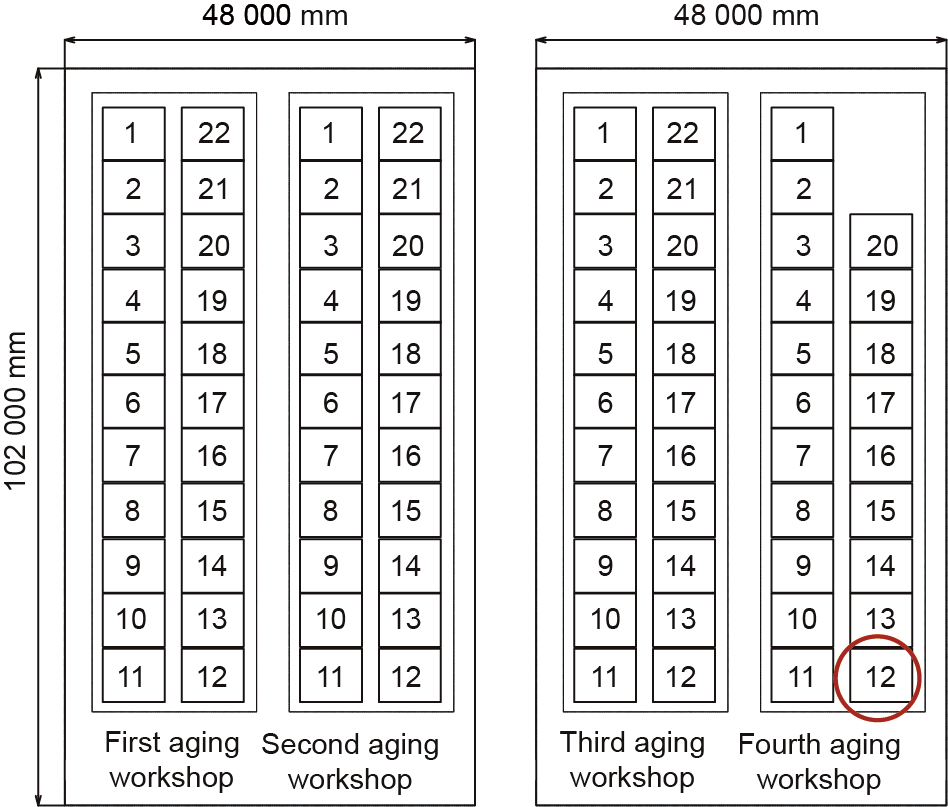
Fig.7.Layout of the aging plant of the enterprise’s liquid preparation system.
The process flow of the intelligent online real-time monitoring demonstration project is shown in Fig. 8.
《Fig. 8》
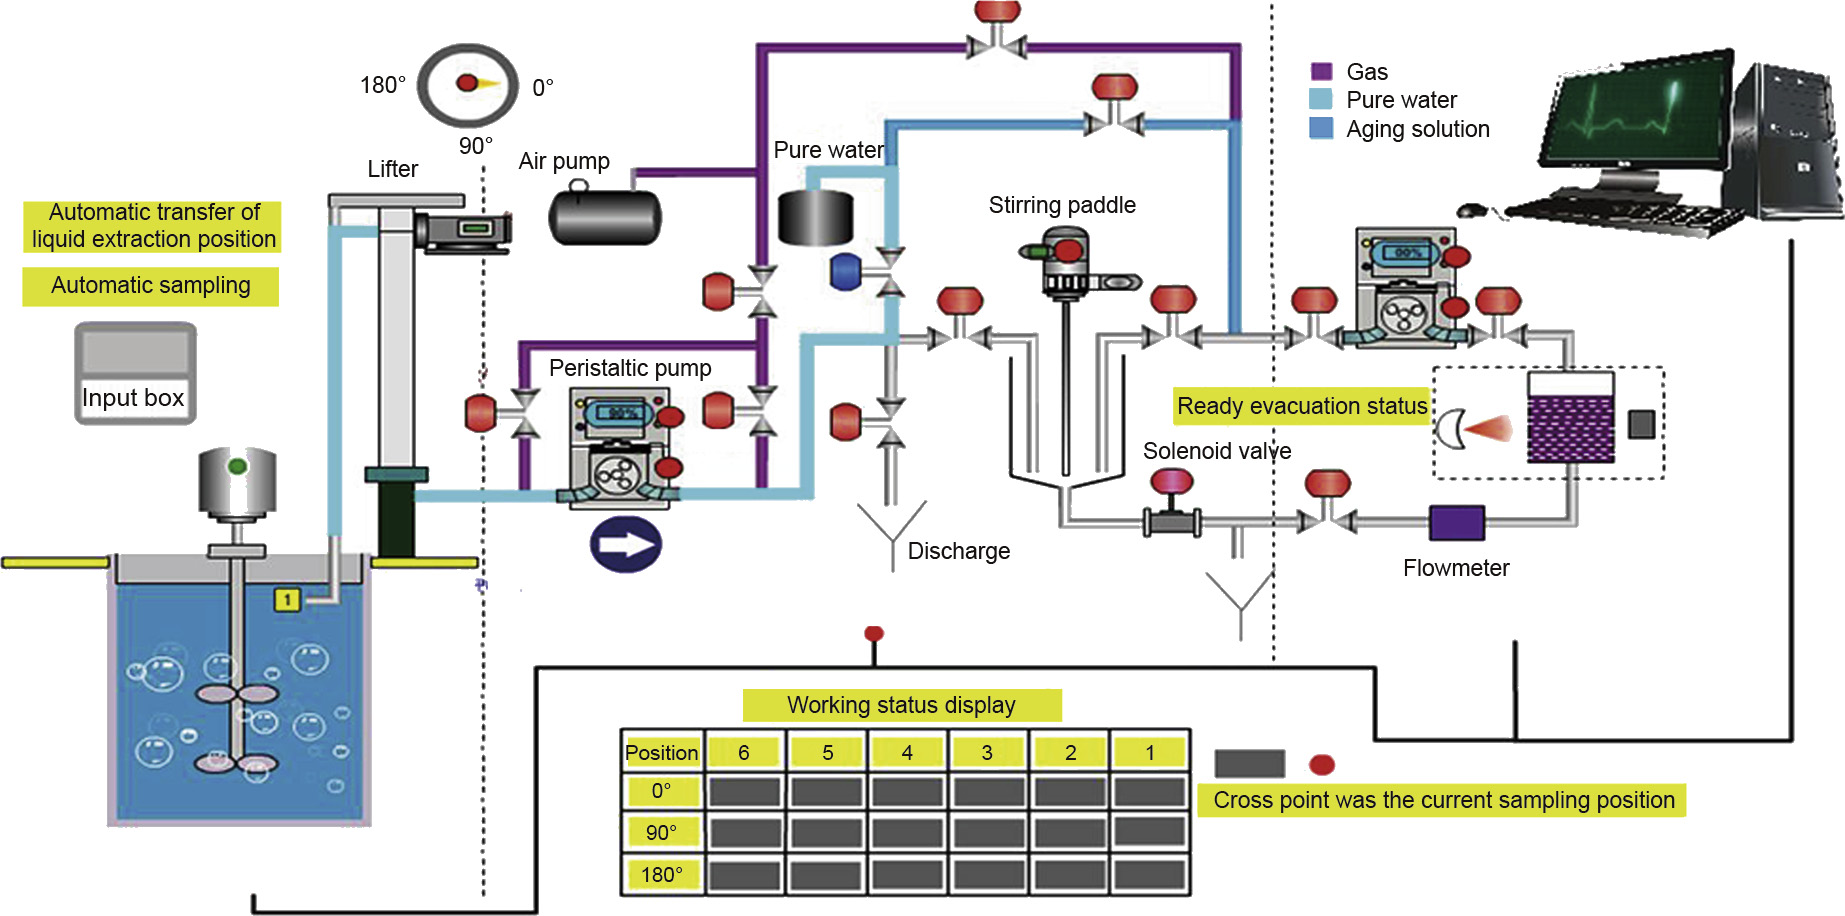
Fig.8.Process flow of the intelligent online real-time monitoring demonstration project for Fe3+ concentration in electrolytic manganese aging liquid.
The demonstration project uses online real-time monitoring equipment that integrates sample acquisition, detection and identification, real-time analysis, result feedback, closed-loop control, and other functions (Fig. 9) into one system. The system is based on a method that uses a non-diluted, non-chromogenic agent, and non-contact fast spectroscopy for iron ions.
《Fig. 9》
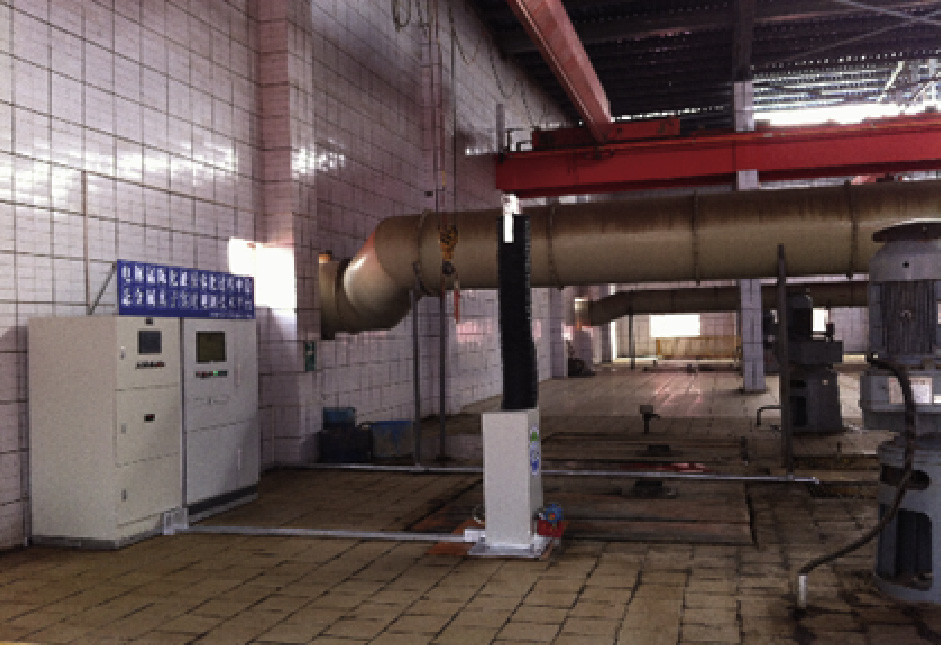
Fig.9.Intelligent online realtime monitoring equipment for Fe3+concentration in a 65 000 t·a-1 electrolytic manganese aging liquid colloidal process.
Ten samples that were collected at random during an arbitrarily selected six-month operation period were measured by the online real-time monitoring equipment and the traditional offline laboratory spectrophotometric method. A comparison of the results of the two methods shows that the relative error between the two analysis methods is less than 2% (Fig. 10).
《Fig. 10》
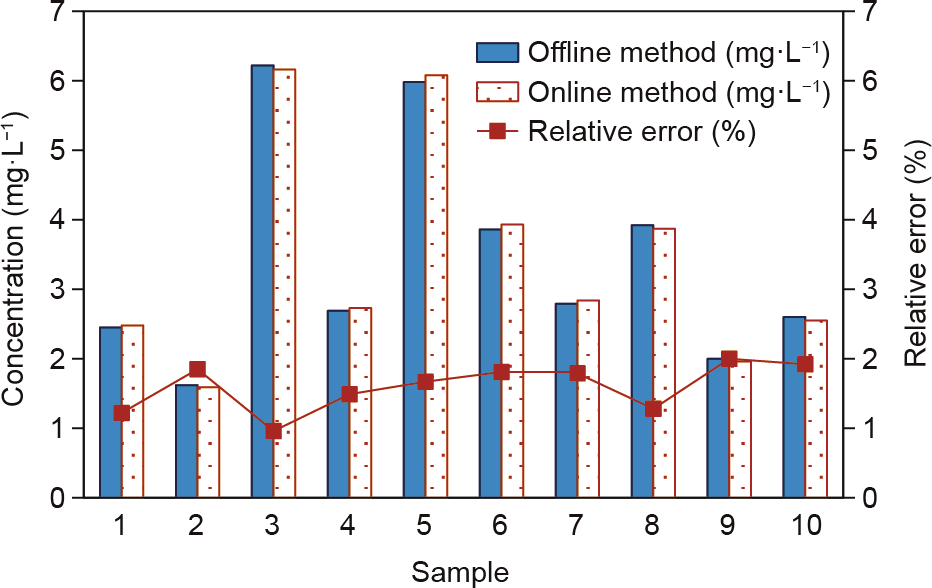
Fig.10.Comparison of online realtime monitoring equipment with traditional offline laboratory spectrophotometric method.
《4.Discussion and conclusion》
4.Discussion and conclusion
《4.1.Discussion》
4.1.Discussion
(1)Traditional analysis methods ignore and are separated from the mother process and the mother solution of the object to be measured. These methods have fixed and strict analysis conditions and require that the object to be tested be changed and adapted to unchangeable analysis conditions. That is, the object to be tested must be modified through a series of changes in order to meet the preset fixed and strict analysis conditions prior to the analysis of the object. From this point of view, traditional analysis methods are passive analysis methods. In contrast, the proposed analysis method is a proactive analysis method, in which the main production process of the object to be measured must be known and the chemical composition of the liquid must be analyzed. Therefore, the proposed optical analysis system is highly targeted.
(2)The passive design principle of traditional analysis methods (e.g.,the spectrophotometric method, ICP–MS,etc.) determines the complexity of the changes in the samples, such as changes in the sample’s optical properties, concentration, salinity, and acidity. Therefore, a complex pretreatment is needed,which means that it is difficult to achieve online real-time monitoring with traditional analysis methods. Because it is a proactive method, in the proposed analysis method, the samples are not contacted or changed during the collection and analysis. The process is fast and simple, from acquiring the sample to obtaining the analysis results.
In addition to being very time-consuming and requiring many chemical reagents, traditional analysis methods may produce errors during the analysis. As in the case of the liquid in Section 2 of this paper, the Mn2+ concentration is thousands of times higher than that of the target substance Fe3+, and the (NH4)2SO4 concentration is even higher than the Mn2+ concentration. If the traditional analysis method is used, the resulting errors from a many-fold dilution will not be insignificant.
(3)Compared with traditional analysis methods, the online real-time monitoring method proposed in this paper does not require any extra resources. It does require the remodeling of the existing spectrophotometer; however, this remodeling does not take much time. In addition, when analyzing a metal ion, this method uses a colorimeter to prejudge its optical response region (i.e.,ultraviolet light region, visible light region, or near-infrared light region) first, and then uses the modified spectrophotometer to determine the optical parameters corresponding to the metal ion. Many metal ions exist whose optical parameters are difficult to obtain using a spectrophotometer alone. Therefore, this method can be easily transferred to other metal ion systems.
《4.2.Conclusion》
4.2.Conclusion
The proposed analysis method is designed to be proactive and consists of a highly targeted optical system and intelligent system that determines the chemical properties of the sample. The method uses non-contact original-state online real-time monitoring for liquids that are used in large quantities in industrial processes and that have high viscosity,high salinity, and multiple components. The results of this method are accurate and reliable. After further research and improvement on theories,technologies, materials, and devices, this method is expected to be widely used in environmental quality analysis and in material analysis in industries such as the iron and steel industry,nonferrous metal industry, chemical industry, construction material industry, light industry, and so on.
Furthermore, artificial intelligence (AI) techniques can be coupled with the established online real-time monitoring system in order to optimally control a production process.For example, in the abovementioned application in a liquid preparation process in the electrolytic manganese industry, precise control of the aging time can be achieved with feedback from the online real-time monitoring results of the metal ions in the aging liquid.
《Acknowledgements》
Acknowledgements
This study is supported by the following projects: Major Science and Technology Program for Water Pollution Control and Treatment of China (2017ZX07402004), National Key Technologies R&D Program of China (2012BAF03B03), the Basic Scientific Research Special Program for Central Commonweal Research Institutes of China (2016YSKY034 and 2016YSKY-015), the Free Exploration Foundation of the State Key Laboratory of Environ-mental Criteria and Risk Assessment of Chinese Research Academy of Environmental Sciences(SKLECRA201754).
《Compliance with ethics guidelines》
Compliance with ethics guidelines
Ning Duan, Linhua Jiang, Fuyuan Xu,and Ge Zhang declare that they have no conflict of interest or financial conflicts to disclose.


 京公网安备 11010502051620号


