
《1.Introduction》
1.Introduction
Clathrate hydrates,also known as gas hydrates, are crystalline structures in which small gas molecules are trapped inside hydrogen-bonded water-molecule cages [1]. These gas molecules must be small enough to be trapped inside the water cages. As such, typical gas hydrate formers include methane, ethane, propane, and carbon dioxide. Gas hydrate formation typically requires high pressures and low temperatures (e.g.,10 MPa, 277 K for methane). Due to such formation conditions, gas hydrates can form in and plug subsea oil/gas flowlines, and thus pose a serious safety and environmental risk. Gas hydrates are often considered to be the major flow assurance issue for offshore oil/gas production, since the timescale of hydrate growth from nucleation to plug formation is much shorter than the timescale of other flow assurance issues, such as wax or asphaltene deposition. A conceptual picture for hydrate plug formation is shown in Fig. 1 [2].
《Fig.1》
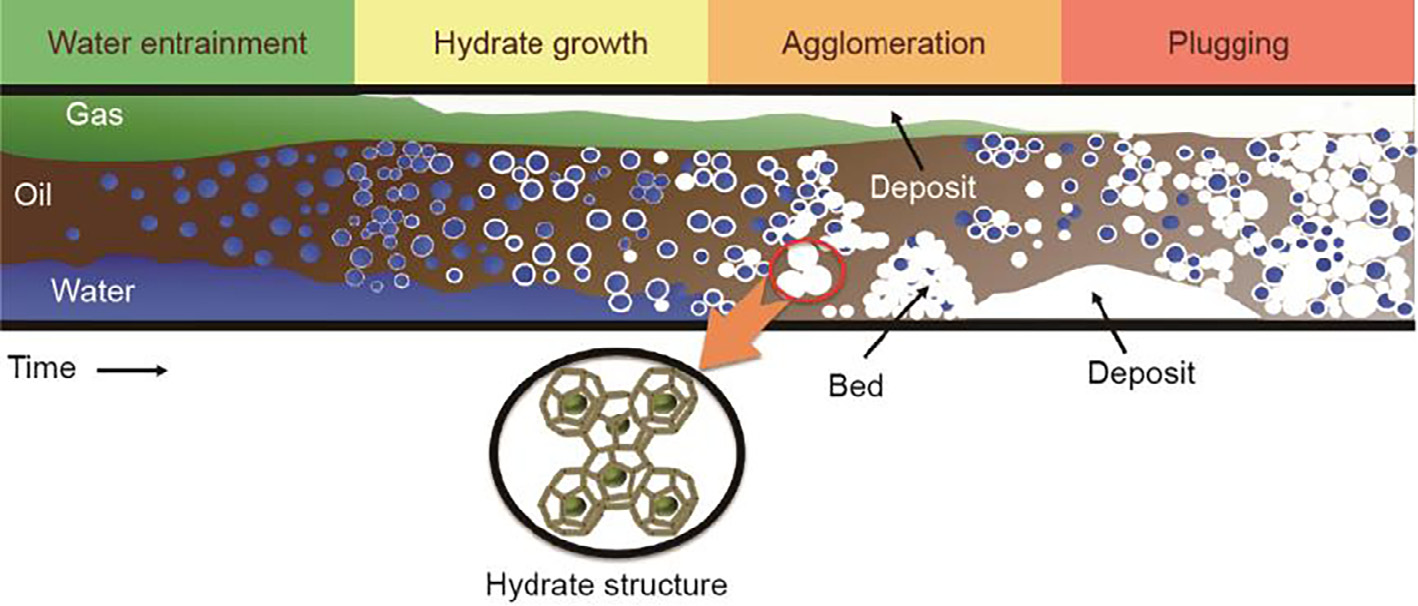
Fig.1.Conceptual picture of hydrate plug formation in a flowline. The inset picture shows the molecular structure of gas hydrates. (Edited from Ref.[2])
In addition, leakage of a well, such as in a deepwater blowout, can have serious implications for both safety and the environment. During a deep well blowout,the surrounding temperatures and pressures are typically well inside the thermodynamic phase boundary for hydrate formation.At first, the oil/gas that leaves the well is warm and outside of the hydrate equilibrium conditions. However, water cools the oil/gas to the point that the oil/gas is well inside hydrate equilibrium conditions. Moreover,hydrate formation will typically occur at the water/gas interface. This can cause a serious risk to the environment because as the gas hydrate particles rise, the hydrostatic pressure will decrease and gas hydrates will start to dissociate. The dissociation of gas hydrates at the surface will release flammable and even potentially toxic gas[3].
Traditionally, the petroleum industry treats gas hydrate formation in flowlines by "complete hydrate avoidance.”In this avoidance method,large quantities (up to 40 vol%) of thermodynamic hydrate inhibitors (THIs), such as methanol and glycol, are injected into the flowline to prevent the formation of gas hydrates. This method becomes uneconomical, especially as fields mature, since large quantities of THIs must be injected. In the last decade or so, there has been a paradigm shift in the treatment of gas hydrates in flowlines. The current gas hydrate treatment practice is “hydrate management.”In this practice,gas hydrates are allowed to form in the flowline, but the properties of the gas hydrate slurry are controlled/ managed by injecting small quantities (1–2 vol%) of low-dosage hydrate inhibitors–anti-agglomerants (LDHIs-AAs). Some of the gas hydrates’properties and the particle size distributions. It is known that these two properties can affect the viscosity of hydrate slurries and thus the transportability of gas hydrates in flowlines
Based upon the rheology of solid suspensions, it is known that the formation of gas hydrates in flowlines will increase the relative viscosity (and pressure drop in a flowline) of the slurry, and thus may affect the transportability of hydrate in flowlines. As such, an advanced knowledge of the rheological properties of gas hydrate slurries is needed in order to evaluate the transportability of hydrate particles. This advanced knowledge on gas hydrates’slurry rheology is required for a number of energy applications,including gas separation, desalination,or sequestration.
Several studies have been conducted to understand and model the viscosity of gas hydrate slurries. These reports include both small-and large-scale investigations. For small-scale investigations, researchers have used atmospheric and high-pressure rheometers to conduct viscosity measurements[4–12]. In large-scale investigations, researchers have used large-scale flowloops to measure the pressure drop and calculate the viscosity of the slurry [13–18]. This paper provides a review of the different relative viscosity models that are currently available in literature, and compares their performances in predicting the relative viscosity of gas hydrate slurries. Discussion and comparisons of each model are provided.
《2.Rheological models》
2.Rheological models
《2.1.Camargo–Palermo model》
2.1.Camargo–Palermo model
At present, the oil and gas industry uses the Camargo–Palermo model, which was introduced in 2002, to predict the relative viscosity of gas hydrate slurries[19]. This model is based on a force balance between two different forces that determine the size of hydrate aggregates suspended in the oil phase. For a flowing system, it is considered that there are two opposing forces that govern the size of hydrate aggregates. The first force is the cohesion force between hydrate particles, which increases the size of hydrate aggregates. The second force is the shear force,which acts to break up the hydrate aggregates and thus reduce the average hydrate aggregate size. In addition, the Camargo–Palermo model assumes that the hydrate aggregates behave as spherical particles. The resulting Camargo–Palermo equations that are used to predict the relative viscosity of gas hydrate slurry are shown in Eqs.(1)and(2).

In Eq.(1), dA and dp are the diameter of a hydrate aggregate and the diameter of an individual hydrate particle, respectively, and f is the fractal dimension of the hydrate aggregate. Several publications have reported the value for the fractal dimension,f, to be in the range of 2–2.7 for a gas hydrate system, while Camargo and Palermo[19] and Qin et al.[20] reported f to be 2.5. The variable Fa is the cohesive force between hydrate particles , φ is the volume fraction of solid particles, and φmax is the maximum packing fraction, which is typically taken to be either 0.64 or 0.74. The variable η0 is the viscosity of the suspending fluid, and  is the shear rate of the system. Eq.(2) defines the effective hydrate volume fraction, φeff.
In general, in order to predict the relative viscosity of a gas hydrate slurry using the Camargo–Palermo model, it is necessary to solve Eq.(1) to determine the size of the hydrate aggregate, dA. Once the size of a hydrate aggregate has been determined, the effective hydrate volume fraction, φeff, can then be calculated using Eq.(2). Finally, the relative viscosity of the gas hydrate slurry ηr, can then be calculated using a relative viscosity model, as discussed below. However, in the Camargo–Palermo model, the Mills equation is used,as presented in Eq.(5). It should be noted that if the solution for Eq.(1) provides a value of the hydrate aggregate size, dA, that is smaller than the original size of the individual hydrate particles, dp—that is ,if dA<dp— then the particles are assumed to remain unaggregated and the effective hydrate volume fraction is set as equal to the volume fraction of the gas hydrate slurry—that is, φeff=φ
《2.2.Relative viscosity models》
2.2.Relative viscosity models
Since gas hydrates are solid particles,the viscosity of a gas hydrate slurry is typically analyzed and presented in terms of relative viscosity. Relative viscosity is chosen for the analysis since it allows comparison across all water percentages, as well as for different oil viscosities. The relative viscosity can be defined as follows:

where the numerator is the viscosity of the hydrate slurry at a particular temperature (T), pressure(P), and volume fraction of gas hydrates (φhyd), and the denominator is the viscosity of the continuous oil phase (i.e.,the water content equals zero, WC=0) at the same temperature and pressure. In this paper, three different relative viscosity models are discussed and analyzed: ①Krieger– Dougherty model, ②Mills model, and ③Majid– Wu–Koh model.
Krieger–Dougherty model was chosen for this work because it is one of the most commonly used relative viscosity models for solid suspension. It is important to compare the performance of a widely used relative viscosity model with hydrate slurry viscosity data. Mills model was chosen since this model is used in the Camargo– Palermo model, and is currently being used for the prediction of gas hydrate relative viscosity by the petroleum industry. Finally, the Majid–Wu–Koh model was chosen because this model was recently introduced by the authors of this paper and was developed using gas hydrate slurry viscosity data.
2.2.1.Krieger–Dougherty model
The Krieger–Dougherty model was introduced in 1959. This model combines earlier models (i.e.,the Mooney (1951), Brinkman(1952), and Roscoe (1952) models) and used available literature data (up to 1959) to fit the model.Eq.(4) shows the Krieger–Dougherty model.

In Eq.(4), B is the Einstein coefficient and was obtained from a fit to a wide range of experimental data. The value for the Einstein coefficient is in the range of 2.5–5, while the value for the maximum packing fraction[21], φmax, is typically in the range of 0.64–0.74[22].
2.2.2.Mills model
The Mills model for relative viscosity was introduced in 1985. This model takes into account the packing and maximum packing fraction of the suspensions. Specifically,the model takes into account the immobilized fluid that can be trapped between the particles. The trapped fluid reduces the amount of suspending fluid and thus increases the overall viscosity of the system. As mentioned earlier, the Camargo– Palermo model uses the Mills model to predict the relative viscosity of a gas hydrate slurry. An equation for the Mills model is presented in Eq.(5). For the gas hydrates system,the value of φma is typically taken as either 0.64 or 0.74 [22].

2.2.3.Majid–Wu–Koh model
Majid et al.[23] recently reported a relative viscosity model, shown in Eq.(6), which is expressed as a differential equation over the volume fraction of solid particles, φ . This differential equation has three parameters. The maximum packing fraction, φmax, which is typically taken to be 0.64 or 0.74[22,24–26], but was set to 0.74 in this work. The Einstein coefficient,B, is usually taken to be 2.5 for a suspension of spheres[24–27]. However, since gas hydrate particles are mostly non-spherical, this constant can take a different value. The last parameter in Eq.(6) is σ, which can be taken as an interaction/ fitting parameter. For a gas hydrate slurry system, σ can be taken as reflecting the cohesive force between hydrate particles. It should be stated that both B and r do not necessarily have to be whole numbers.

Majid et al.[23] obtained values for both B and σ by fitting the experimental data for gas hydrate slurry systems conducted using a model emulsion system to this model. In the work,the value for the Einstein coefficient, B, was reported to be 5.33±0.73, while the value for the interaction parameter, σ, was reported to be 1.98±0.87. A similar method was recently employed to determine the corresponding constants for an ice slurry system. The investigation showed that for an ice slurry system, the Einstein coefficient, B, was reported to be 4.25±0.03, while the value for the interaction parameter, σ, was reported to be 0.88±0.01. When comparing the value of the Einstein coefficient, B,with the interaction parameter,σ, it can be seen that the standard deviation for the gas hydrate slurry system is larger than that of the ice slurry system. Since the values were obtained by fitting experimental data, it is likely that this is an artifact of the available dataset. In this work, the relative viscosity for the gas hydrate slurry system was fitted over a much broader range compared to that of the ice slurry system.
《3.Results and discussion》
3.Results and discussion
《3.1.Relative viscosity comparison and analysis》
3.1.Relative viscosity comparison and analysis
3.1.1.Hydrate slurry
In this paper,we compare gas hydrate slurry viscosity data that are available in literature with various relative viscosity models. It should be stated that since each apparatus has its own limitations, comparing two different types of experimental studies can be a challenging process. In addition, studies were conducted under various conditions (temperature, pressure, hydrate structure, fluid composition, and especially shear rate), which adds to the complexity of comparing the data with relative viscosity models. Regardless,a comparison of the literature data with the relative viscosity models is useful in order to determine the limitation of each model. Moreover, this comparison helps to identify knowledge gaps in hydrate slurry viscosity studies.
In this work, data collected from 20 different studies consisting of 110 data points were collected and compared [10,12,14–16,19,20,23,28–36]. These data were collected either from published journal articles or conference proceedings.The collected data were analyzed and presented in terms of relative viscosity, as defined earlier in Eq.(3). As can be seen in Eq.(3), the viscosity of the hydrate slurry was normalized with the viscosity of the suspending fluid under similar conditions. This allows comparisons to be made across different hydrate volume fractions for all experimental conditions (temperature, pressure, and viscosity of suspending fluid) . It should be noted that the data collected are at various experimen-tal shear rates. In this work,the effect of shear rate was indirectly evaluated. Specifically,the shear rate of the system was used in the Camargo–Palermo model to determine the hydrate aggregate particle size.
Results of the comparison of the relative viscosity of a gas hydrate slurry at various gas hydrate volume fractions are presented in Fig.2[10] for gas hydrate systems and in Fig.3[10] for model hydrate systems. The results from Fig.2 are from gas hydrate slurry investigations. These studies were conducted using gas hydrate formers such as methane, methane/ ethane mixtures,and carbon dioxide. On the other hand,the results from Fig.3 are from investigations using model hydrates such as cyclopentane, tetra-butylammonium bromide (TBAB), and tetra-butylammonium fluo-ride(TBAF), which are stable at atmospheric pressure conditions. We separated these results because the model hydrates may behave differently than gas hydrates. In fact,TBAB is known as a semi-clathrate in which the hydrate former, TBAB, can participate in the cage structure. In this comparison, the three different models of relative viscosity are also presented in Figs.2 and 3. for the Krieger–Dougherty and Mills models, two different maximum packing fractions were chosen (0.64 and 0.74), while for the Majid–Wu–Koh model, the maximum packing fraction was set at 0.74.
《Fig.2》

Fig.2.Comparison of relative viscosity of gas hydrate slurries as a function of hydrate volume fraction for different studies with three different models[10]. Hydrate structure for each study is labeled in the legend. sI and sII represent gas hydrate structure I and structure II,respectively.
《Fig.3》

Fig.3.Comparison of relative viscosity of model hydrate slurries as a function of hydrate volume fraction for different studies with three different models[10]. Hydrate former is labeled in the legend. TBPB:tetra-butylphosphonium bromide.
As mentioned earlier, the data collected in this work consist of several studies that were conducted under various conditions,including experiments conducted using different gas hydrate formers (different gas composition). As such, different gas hydrate structures will form,which will depend on the gas composition . Fig. 2 shows results for two types of gas hydrate structure: structure I (sI) and structure II(sII). sI gas hydrates consist of two 512 water cages and six 51262 water cages per unit cell, with 46 water molecules for each unit cell. The sI hydrates shown in Fig. 2 were formed from pure methane, ethane, or xenon.sII gas hydrates consist of sixteen 512 water cages and eight 51264 water cages per unit cell,with 136 water molecules for each unit cell. The sII gas hydrate shown in Fig. 2 was formed from a gas mixture of methane, ethane,and propane.
From Figs. 2 and 3 , it can be seen that the relative viscosity of a hydrate slurry can reach as high as 3400.In analyzing the data collected here, it can be seen in Fig.2 that the data obtained from Webb et al.[12] showed a higher relative viscosity compared with all other experimental results. These higher relative viscosity values are believed to be due to the model emulsion system that was used in the study. In the work, a model system consisting of dodecane, Aerosol OT, and water was used. This mixture was observed to form a micro-emulsion, for which dynamic light scattering (DLS) analysis showed that the sizes of the water droplets were within the range of 20–50 nm. Such small droplets and subsequent gas hydrate particles may lead to higher relative viscosities of the slurry.
From Fig.3, it can be observed that the data obtained from Zylyftari et al.[4] consist of different relative viscosity values at a constant hydrate volume fraction. In that work, the authors performed investigations of cyclopentane hydrate at a constant hydrate volume fraction with different salt concentrations (0–15 wt%) and shear rates(1–100 s-1). The results of this current investigation showed that there is an optimum shear rate for the Majid–Wu–Koh model.
In conducting this comparison between experimental data and model predictions, it was observed that the relative viscosity of a hydrate slurry increases rapidly with an increase in hydrate volume fraction. Comparing the three models discussed in this paper, the Krieger–Dougherty and Mills models behave relatively similarly, with the increase in relative viscosity with increasing solid concentration being relatively small up to hydrate volume fractions of 40% or 50%. On the other hand, for the Majid–Wu–Koh model, the relative viscosity is more sensitive toward changes in the particle concentration in the same range. Specifically, there is a rapid increase in the relative viscosity with an increase in solid concentration.
3.1.2.Relative viscosity of an ice slurry
The rheology of an ice slurry has been studied, especially in refrigeration systems, in order to understand the flow properties of the slurry to optimize the system. Initial work on understanding the viscosities of gas hydrate slurries focused on understanding the behavior of ice slurries; thus,it is of interest to compare the relative viscosity of an ice slurry to the relative viscosity of a gas hydrate slurry. The results of the ice slurry experiment were conducted by Rensing et al.[37] in 2011. In that work,crude oil emulsions with water volume fractions of 0.1–0.7 were investigated. The results of the work conducted in terms of relative viscosity of an ice slurry as a function of water content/ particle concentration are presented in Fig.4[37].
Fig.4 shows that at low concentrations of ice particles (less thanor equal to 10 vol% water), there is only a small increase in the relative viscosity with the presence of solid ice particles. However,as the volume fraction of ice particles increases (above 25 vol% of water), there is a significant increase in the relative viscosity of the ice slurry. In fact,Rensing et al.[37] reported that this in line with yield stress measurement data, as shown in Fig. 5. Yield stress is defined as the stress above which the material no longer behaves elastically. In Rensing’s work, the yield stress measurement conducted at 10°C after two hours of annealing time shows that there is negligible increase in the yield stress observed for system with less than or equal to 25 vol% of initial water[37]. Thus, it was concluded that below 25 vol% water content,the system can be considered as a dilute regime in which the ice particles do not aggregate. However, above (or at) 25 vol% water content, the ice particles aggregate and may occlude oil. This then increases the effective volume fraction, and thus increases the overall relative viscosity of the slurry.
《Fig.4》

Fig.4.Comparison of the relative viscosity of an ice slurry as a function of ice volume fraction with three different models[37].
《Fig.5》
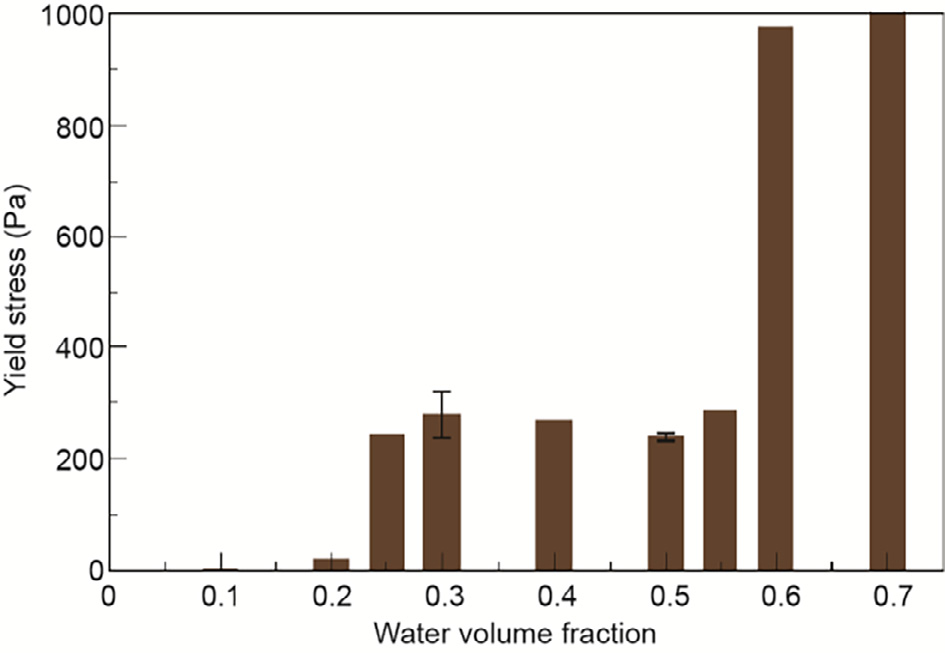
Fig.5.Yield stress of an ice slurry as a function of water volume fraction. (Edited from Ref.[37])
Similar to the relative viscosity of a gas hydrate slurry, the relative viscosity of the ice slurry from experimental data was compared with predictions from the three different models considered earlier. The results of the comparisons are presented in Fig.4. From this figure, it can be seen that with the exception of the Majid–Wu–Koh model (using parameters fit for gas hydrates), all other models were able to predict the relative viscosity of an ice slurry at 10 vol% water content. However,at higher water content (above 25 vol% water content), all models were unable to predict the relative viscosity of an ice slurry well.In addition, it was observed that the Majid–Wu–Koh model for hydrate systems over-predicts the relative viscosity of an ice slurry,whereas the Krieger–Dougherty and Mills models under-predict the relative viscosity of an ice slurry. The Majid–Wu–Koh model (using parameters fit for ice) is also given in Fig.4, with the fit being reasonable above or at 25 vol% water content.
Comparisons between the yield stress of gas hydrate and ice slurries were also conducted[12,37] . Results of the yield stress measurements for methane hydrates are presented in Fig. 6[12]. When comparing the yield stress for a gas hydrate slurry with that for an ice slurry, it can be seen that for a gas hydrate slurry, there is an increase in the yield stress at a water volume fraction of about 0.25. An increase in the yield stress was also observed for an ice slurry, but at a higher water volume fraction of about 0.6. The yield stress results are consistent with the relative viscosity results, which show that there is a higher increase in the relative viscosity of a gas hydrate slurry compared with that of an ice slurry at similar particle concentrations. This finding suggests there can be higher degrees of particle agglomeration for a gas hydrate slurry compared to an ice slurry[6–8].
《Fig.6》
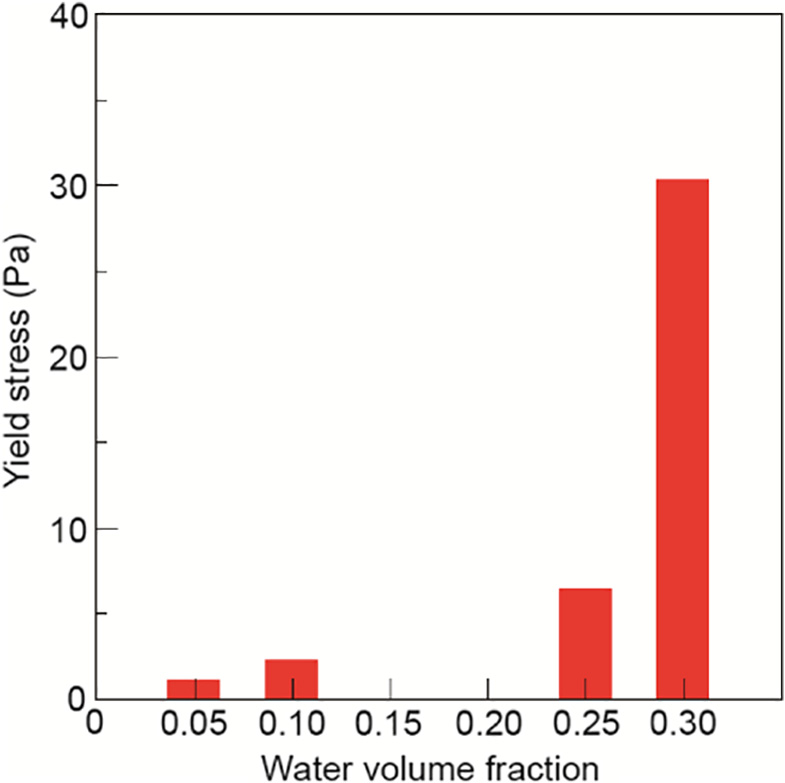
Fig.6.Yield stress of a gas hydrate slurry as a function of water volume fraction.
《3.2.Error analysis》
3.2.Error analysis
An error analysis was conducted to compare the quantitative performance of each model for both hydrate and ice slurries. Error analysis was conducted by comparing the relative viscosity from experimental data with the relative viscosity predicted using the particular model.Information such as the shear rate,droplet size, and viscosity of the oil was obtained from the literature. The first step in determining the relative viscosity using the particular model is to determine the mean size of the particle(hydrate/ice) aggregates ,dA. The Camargo–Palermo model,as shown in Eq.(1), was used to determine the aggregate size.In this analysis,the fractal dimension, f, was set to a value of 2.5 and the cohesive force, Fa, was set to 10 mN·m-1; these are the default parameter values in the Camargo–Palermo model. Next, the effective volume fraction of the slurry was calculated using Eq.(2). Finally, the relative viscosity of the slurry was calculated using the three models discussed earlier: ①Krieger–Dougherty model, ②Mills model, and③Majid–Wu–Koh model.
Once the predicted relative viscosity was calculated,the absolute error of each data point was calculated using Eq.(7). In this equation, Xi;data is the relative viscosity obtained from experimental data and Xi;model is the relative viscosity calculated from the model. The subscript i in Eq.(7) denotes the ith data point in the data set. Next, the percentage of data points with less than 30% error was calculated using Eq.(8). In this equation, n is the number of data points with less than 30% error and N is the total number of data points. Using this method, the performance of each model can be evaluated: The higher the percentage of well-fit data points, the better the performance of the model.

In addition, an error analysis in terms of the arithmetic average of absolute error between experimental data and model predictions was conducted. The equation for this error analysis is presented in Eq.(9). This error analysis indicates the deviation of the predicted values from the experimental values of the relative viscosity of the slurry.
It should be stated that in the error analysis of relative viscosity of a gas hydrate slurry, the data from model hydrates, which include data from investigations using cyclopentane, TBAB, and TBAF, were not included in the analysis. This decision was made for the following reasons: Firstly, TBAB hydrate is a semi-clathrate, which means that the TBAB molecules participate in the formation of the hydrate water cages. As such, their behavior may be different than the behavior of a gas hydrate system. The second reason is related to the sub-cooling of the system: Model hydrates,such as TBAB, TBAF, and cyclopentane, have equilibrium temperatures ranging from about 4 to 7.7°C. In order to avoid ice formation, researchers conducted the experiments above the melting temperature of ice (above 0°C).This provides a relatively small sub-cooling of the system. Conversely, gas hydrate experiments were conducted with larger sub-coolings. The lower sub-cooling for model hydrate systems may enhance the agglomeration of hydrate particles. Therefore,the slurry might behave differently. Finally, for gas hydrate systems, there is an additional phenomenon to consider: the saturation of gas molecules in the oil phase,which would decrease the viscosity of the oil. In the development of the Majid–Wu–Koh model, the effect of saturation on the overall viscosity was taken into account. Therefore, it is expected that the model will work better in the gas hydrate systems. In addition, data from Webb et al.[12] were not included in the error analysis because the study from Webb et al. [12] in 2013 used a model micro-emulsion that forms much smaller hydrate particles(in the nanometer size range). This average error analysis was conducted to determine the limitations of our current Majid–Wu–Koh model. Further improvement of the model is ongoing.
3.2.1.Error analysis for hydrate slurry
Comparisons in terms of percentage of well-fit data points are presented in Fig.7(a). The analysis showed that the Majid–Wu–Koh model works better than the other two models. This is as expected, since the Majid–Wu–Koh model was developed using hydrate slurry viscosity data from Ref.[23] to fit the two parameters, B and r. It should be stated that although the Majid–Wu–Koh model was developed using data collected for one particular system(a methane hydrate slurry formed from a model emulsion system), it is able to predict the relative viscosities of other systems relatively well.
《Fig.7》
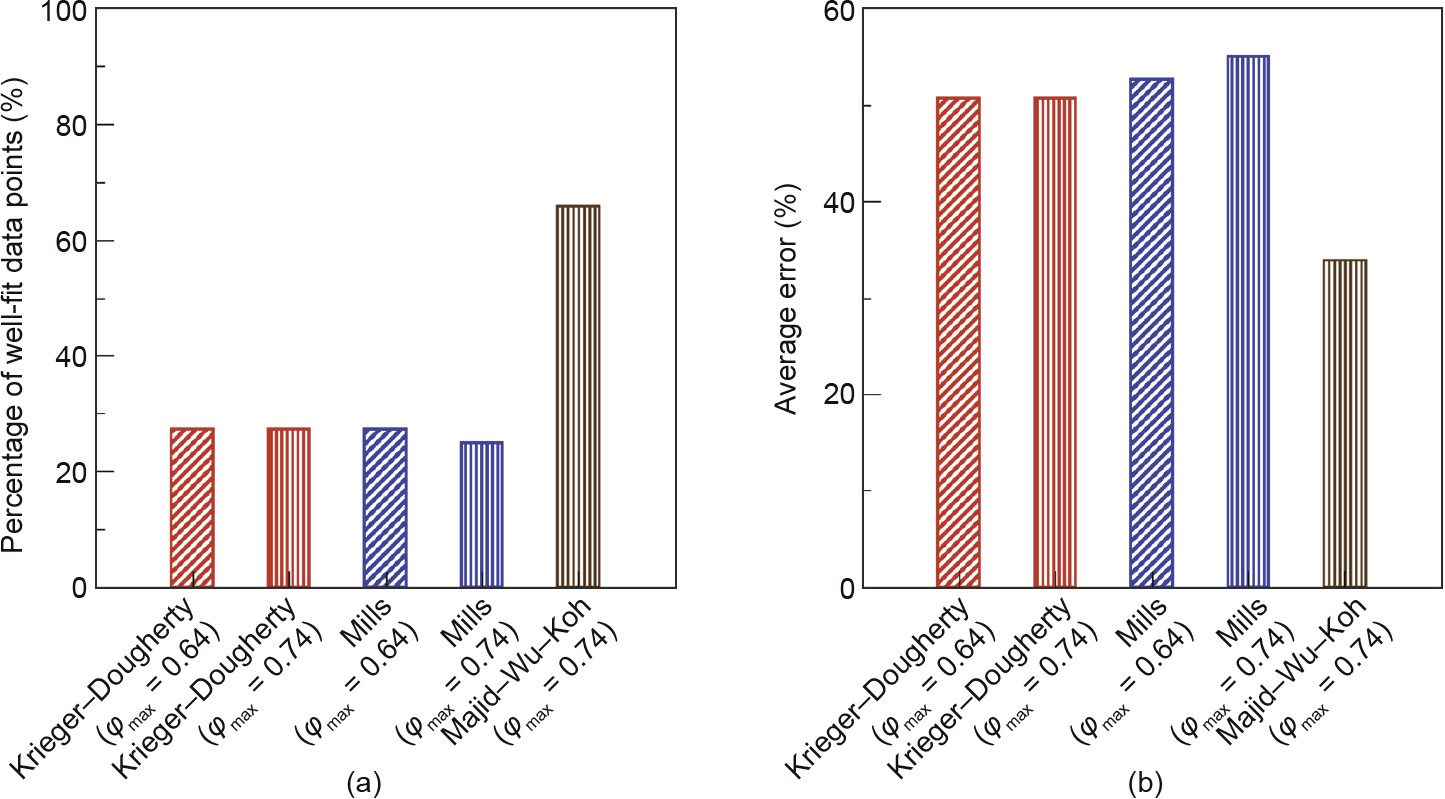
Fig.7.(a)Percentage of well-fit data points with a relative error for relative viscosity of a gas hydrate slurry of less than 30% for three different models and (b)average relative viscosity error for each model.
As mentioned earlier, the Majid–Wu–Koh model is able to predict relative viscosity of a gas hydrate slurry relatively well since its parameters were obtained and optimized using gas hydrate relative viscosity data. This indicates that gas hydrate slurries behave differently compared to other solid suspension systems. This finding is not surprising because several additional phenomena are occurring in the hydrate slurry system, such as the agglomeration and settling of hydrate particles. In addition, it is known that the formation of gas hydrates is rapid;thus, during gas hydrate formation, there might be unconverted water that is trapped /occluded between hydrate particles. The trapped/ occluded water can change the effective volume fraction and thus increase the relative viscosity of the slurry. In comparing the performance based on the error analysis, the Mills model surprisingly had the lowest performance, even though the Camargo–Palermo model uses this equation. The analysis showed that for a maximum packing fraction of 0.74,75% of the data obtained in this study has an error of more than 30% when the Mills model was used in the prediction of relative viscosity.
Fig.7(b) confirms our observation that the Majid–Wu–Koh model is better at predicting the increase in relative viscosity with increases in gas hydrate particle volume fraction. The average absolute error for the Majid–Wu–Koh model is 33%, whereas the average absolute errors for the other two models are about 50%.
The average absolute error for all models is relatively large (larger than 33%). It is thus necessary to understand the possible reasons behind this large error. We believe that this large error may be due to several reasons. The first reason is the shape factor. In all three models,hydrate particles are assumed to be spherical. This is likely not true for agglomerated particles such as gas hydrates. The second reason is that in all models, the maximum packing fraction is taken to be either 0.64 or 0.74. These values are for single-sized spherical particles in a close-packed configuration, but the shape of gas hydrate particles can be non-spherical. The third reason is that polydispersity can affect the predictions. In the models, the average hydrate agglomerate size was used to predict the relative viscosity. For a gas hydrate slurry system in which the gas hydrate particles agglomerate, there may be variations in hydrate aggregate sizes that can affect the viscosity of the slurry. Finally, in this work, there is also a limited size of data-set. The Majid–Wu–Koh model was developed using data that was obtained under certain experimental conditions (temperature, pressure, and shear rates).
3.2.2.Error analysis for ice slurry
An error analysis for ice slurries was only conducted in terms of average absolute error due to the small number of experimental data points available; this is presented in Fig. 8. From the analysis conducted, it can be seen that the performance of both the Krieger–Dougherty model and the Mills model is relatively similar. The average error for these two models is about 40%. On the other hand, the average error of the Majid–Wu–Koh model was reduced to 23%. This average error is lower than those of the Krieger–Dougherty and Mills models. The results of this analysis indicate that the Majid–Wu–Koh model is a flexible model that can be tuned to either ice or hydrate slurry systems.
《Fig.8》
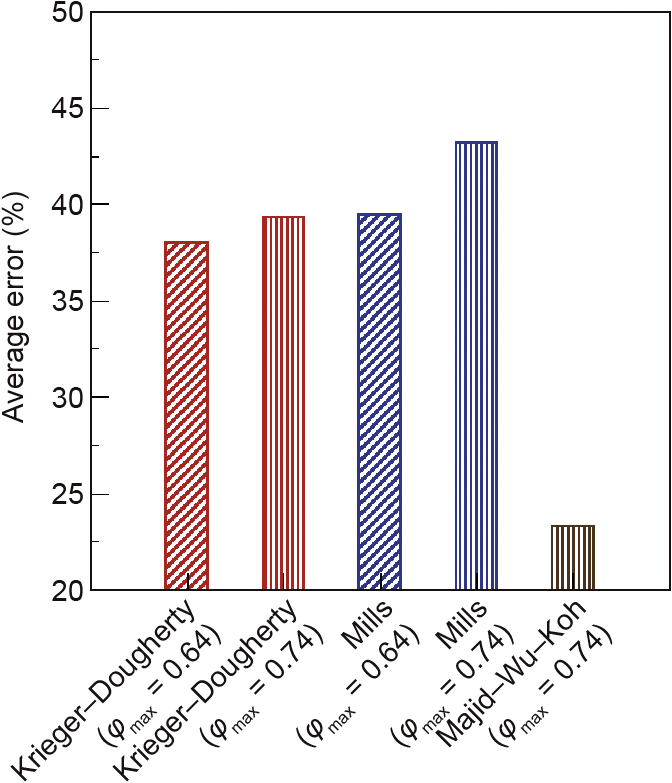
Fig.8.Average error between experimental data and model predictions for the relative viscosity of an ice slurry for three different models.
3.3.Improvement to relative viscosity models
Based on the relative viscosity data of gas hydrate slurries that was collated and presented in this paper, several variables were identified to be important in improving current relative viscosity prediction. The variables of greatest importance are the hydrate volume fraction/effective hydrate volume fraction and the shear rate of the system. As can be seen in Fig.2 and 3, in most studies, the relative viscosity of a hydrate slurry is sensitive to any increase in hydrate particle concentration. Specifically, it was observed that a small increase in the hydrate volume fraction would increase the relative viscosity significantly. This finding indicates that hydrate volume fraction is a crucial parameter. Therefore, in any experiment, it is important for the researcher to be able to determine the actual amount of hydrate that has formed in the system. At present, in most studies, the amount of hydrate formed is calculated based on tracking the gas consumption. This method has its own limitations; among others, an assumption needs to be made regarding the saturation of the oil continuous phase. Furthermore, it was hypothesized that during hydrate formation, as well as during agglomeration,some water might be trapped/ occluded between hydrate particles[2,38,39], which can increase the rela-tive viscosity of the slurry. As such, the effective volume fraction of gas hydrates is also a crucial variable (albeit challenging to obtain) in order to improve predictions of relative viscosity.
In addition to the variables discussed earlier, other improvements can be investigated in order to improve the relative viscosity model. At present,the maximum packing fraction used in the equation is set to either 0.64 or 0.74. However, studies have shown that this value can change significantly, and that it is dependent on the roughness of the particles. It is known that hydrate particles are not smooth, and that the gas hydrate morphology can change with the presence of surface active components such as AAs. Thus, studies should be conducted to determine the maximum packing fraction for a hydrate slurry system.
The next variable that needs improvement is the shape factor. Most of the relative viscosity models available in the literature are based on analyses for smooth, spherical,and solid particles. For a gas hydrate slurry system,this may be suitable for the limiting case in which the gas hydrate particles are relatively small and there is little or no agglomeration of gas hydrate particles. However, this is not the case for most conditions, and gas hydrate aggregates are non-spherical. Thus, in order to improve the relative viscosity model,the shape factor in relative viscosity models needs to be evaluated and studied.It should be noted that visualization of gas hydrate particles is a challenging process since gas hydrates form at high pressure,although recent particle-imaging probes have been able to capture the particle-formation process in situ[40].
《4.Conclusions》
4.Conclusions
A comparison between experimental data and predictions for the relative viscosity of a gas hydrate slurry from three different models was presented in this paper. The three models were the Krieger–Dougherty model (φmax=0.64 and 0.74), Mills model(φmax=0.64 and 0.74), and Majid–Wu–Koh model(φmax=0.74). Results from 20 different experimental sets containing 110 data points were used in this comparison. These data sets were obtained from experiments that were carried out under various conditions (temperature,pressure, shear rate,and gas hydrate former). From the data collected, it was observed that the increase in relative viscosity is significant with an increase in gas hydrate volume fraction up to 40% or 50%. The Krieger–Dougherty equation and the Mills equation do not predict the rapid increase in the relative viscosity with an increase in the gas hydrate volume fraction. On the other hand, the Majid–Wu–Koh model was able to capture the rapid increase in the relative viscosity. An error analysis conducted on all these data points indicates that the Majid–Wu–Koh model fora hydrate system better predicts the relative viscosity compared with the other two models (Krieger–Dougherty and Mills). A better prediction from the Majid–Wu–Koh model was expected, since the model was specifically developed using relative viscosity data for gas hydrate slurries. A comparison of the relative viscosity of an ice slurry with similar models was also conducted. The results show that at low concentrations of ice particles (dilute regime), there is only a small increase in the relative viscosity with an increase in ice particle concentration. However, for 25 vol% water content, there is a rapid increase in relative viscosity with ice particle concentration. Results also show that the Krieger–Dougherty and Mills models under-predict the relative viscosity of an ice slurry, while the Majid–Wu–Koh model for a hydrate system over-predicts the relative viscosity of an ice slurry. However, the Majid–Wu–Koh model with parameters fitted for an ice slurry system performed much better than the Krieger–Dougherty and Mills models. Several suggestions on the potential improvements needed for relative viscosity models were discussed in the paper. First, a better method is needed to calculate both the gas hydrate amount and the effective volume fraction of hydrate. Second, the experimental data show that at similar concentrations of gas hydrate, the relative viscosity of a gas hydrate slurry is dependent on the shear rate of the system. Next,the maximum packing fraction should be considered because it can be greatly affected by particle roughness.As such, the maximum packing fraction for a gas hydrate slurry system should also be studied and improved. Finally, the particle shape factor for gas hydrate slurries should also be investigated and improved.
This paper has provided comparisons of the relative viscosity of gas hydrate slurries with predictions using three different models. The comparisons conducted serve as a guideline to determine the performance of each model, and help to identify the knowledge gaps in gas hydrate rheological studies.
《Acknowledgements》
Acknowledgements
The authors acknowledge past and current members of Center for Hydrate Research Consortium consisting of BP, Chevron, ConocoPhillips, Petrobras, ENI, ExxonMobil, Halliburton, IMP, Multi-Chem, Nalco Champion, Shell, SPT Group, OneSubsea, Schlumberger, Statoil, and Total for supporting this work. Carolyn A.Koh, William K.Coors Distinguished Chair in Chemical Engineering,acknowledges the Adolph Coors Foundation. Finally, Ahmad A.A.Majid acknowledges Universiti Malaysia Pahang (UMP) under the Ministry of Education (MoE), Malaysia, for sponsoring his studies.
《Compliance with ethics guidelines》
Compliance with ethics guidelines
Ahmad A.A.Majid,David T.Wu,and Carolyn A.Koh declare that they have no conflict of interest or financial conflicts to disclose.


 京公网安备 11010502051620号


