

《1.Introduction》
1.Introduction
《1.1.Motivation》
1.1.Motivation
The World Economic Forum listed water scarcity as one of the three global systemic risks of highest concern when surveying risk perception from business, academia, civil society, government, and international organizations [1]. Water, often viewed by industry as a low-cost, infinite resource, is largely used in an inefficient manner [2]. However, rising freshwater and treatment costs have caused a shift in focus toward water conservation. Therefore, this analysis focuses on optimization of the steel industry water network as a case study, with the aim of incorporating biological actors to fulfill the decomposer role in steel manufacturing.
Apart from iron and energy, water is the most important commodity in steel manufacturing [3]. Mostly due to evaporation losses, efficient steel making today requires approximately 4.12 m3 of freshwater per tonne of crude steel; this water is used primarily for cooling. Therefore, reducing the amount of cooling water requiring traditional treatment and decreasing the amount of effluent generated from cooling could have major impacts on the overall amount of energy and water consumed by the steel manufacturing process. The major contaminants from cooling processes that require removal prior to water recycling are chloride compounds and suspended solids. Without such removal, the water is not suitable for processes that demand high water quality, as it could corrode mechanical equipment [4].
《1.2.Approach to optimize the steel water network》
1.2.Approach to optimize the steel water network
Within every natural ecosystem, there are multiple key functional roles that together result in a robust cyclic system. Primary producers, consumers, decomposers, and the physical environment are all necessary for an ecological community to harvest, transfer, and cycle materials and energy [5]. In particular, the amount of internal cycling in natural ecosystems is strongly influenced by the presence of decomposers, actors that are often called detritivores in ecology. These organisms break down waste or unconsumed biomass produced by higher level species and return it back into the system [6]. Over half of the material flows in natural food webs move through the detritivore component. However, this functional role is often poorly represented or missing entirely within industrial systems [7]. Some scientists and engineers argue that even limited connections to an actor that functions as a detritivore would greatly enhance the efficiency of industrial networks [8].
To improve the current steel manufacturing water network, this study investigates the use of constructed wetlands for phytoreme-diation to reduce the total amount of freshwater, operating costs, and environmental impact in the steel industry. The constructed wetlands mimic the decomposer role by reintroducing the cooling water which would otherwise be treated by the onsite wastewater treatment plant and discarded as effluent back into the steel industry water network. Phytoremediation is the ability of plants to concentrate elements and compounds from their environment and to metabolize various molecules in their tissues. Phytoremediation is one of the most economical ways to treat wastewater, with some studies finding it to cost 10–1000 times less than conventional civil engineering technologies [9]. After removing the con-taminants from the wastewater, crop disposal scenarios include pyrolysis, composting, compaction, incineration, ashing, and liquid extraction [10]. Some scientists have identified potential to use the plants as a feedstock for biofuel production, which could then be used to further decrease energy consumption in steel making [11]. Also,when using pyrolysis as an end-use,the resulting bio char could be reintroduced as a feedstock into the steel manufacturing process. This approach should be investigated further, as this process is another way to further mimic the decomposer role in steel manufacturing.
《2.Materials and methods》
2.Materials and methods
《2.1.Optimization model construction》
2.1.Optimization model construction
The steel industry water network involves several typical water systems located in different plants that have various water requirements,wastewater types, and wastewater characteristics. In addition, the water networks in these plants are interconnected through utilities that is, through a centralized wastewater treatment system (CT) and/or a desalination system (DS). Together,these aggregated interconnected water networks within steel manufacturing form a steel park water network. The total water network of the steel park is complex and involves multiscale water systems and networks ,such as unit scale-water systems and plant-and park-scale water networks. To model the water network optimization of a large steel park, three multiscale efforts are performed on the model and on superstructure improvements: ① identifying all types of unit-scale typical water systems in the park, and then developing simplified unit models for them, which work as the basic elements for superstructure construction; ② establishing intra-and inter-plant superstructures to describe a potential configuration for the water network at the plant-scale and park-scale ; and ③ based on these developed models and superstructures, developing a mixed-integer nonlinear programming (MINLP) problem using total annual cost as the objective in order to investigate the potential for water network optimization in the steel park.
2.1.1.Simplified models for a typical unit-scale water system
The typical unit-scale water systems in a steel park include indirect closed circulating cooling water systems (ICs), indirect open circulating cooling water systems(IOs),direct open circulating cooling water systems (DOs), DSs, once-through process systems (OPs), wastewater treatment systems(WTs) ,water source systems (WSs), and water demand systems (WDs). The first three types of water systems contribute to more than 97% of total water use. The IO model is presented in Fig. 1 as an example. Note that the system has two outlets: One is backwash wastewater,and the other is outlet water that is ready for recirculation or discharge. The IC and DO models are similar to the IO model; the main difference between the three systems is the water quality requirement.
《Fig.1》

Fig. 1. Model of the IO. F:water flowrate; c:concentration; io:an IO system; j:contaminant j; in:inlet stream; out:outlet stream; v:evaporation; b:backwash wastewater.
Another key water system is the DS, which is used to produce the soft and desalinated water required by water-use systems. Two types of DS are commonly found throughout the steel industry: One uses freshwater, while the other uses reclaimed water from a CT as raw water. A model of such a system is shown in Fig. 2. It can be observed that this model has four outlets to include backwash wastewater, concentrate from reverse osmosis (RO), soft water, and desalination water.
《Fig.2》

Fig.2.Model of the DS.ds: a DS system; out_1: backwash wastewater in outlet stream; out_2: concentrate in outlet stream; out_3: soft water in outlet stream; out_4: desalination water in outlet stream.
These two types of water system have not been previously investigated in detail,and the corresponding models are always simplified as one-input one-output systems. However,in this study,one-input multi-output models are utilized to describe these water-use systems, which will help identify more potential for wastewater reuse in a plant. Other unit-level water systems are general,and their models have already been deeply discussed in the literature [12–14]; therefore, those systems are neglected in this study.
2.1.2.Superstructure for a plant-scale water network
A plant-scale water system denotes the water network of a sin-gle plant. A plant-scale superstructure is always established based on the typical superstructure design principles for a single water network [15,16], in which all feasible connections are considered in order to explore any potential improvements to ensure the optimal water network. To reduce the size of the superstructure in our study,realistic connection tolerances and limitations are considered as logical constraints. For example, forbidden connections include the streams from DO to IO, and freshwater sources to WT. This modified superstructure for the plant-scale water net-work is presented in Fig.3.
《Fig.3》

Fig.3.Superstructure of the plant-scale water network.
2.1.3.Superstructure for a park-scale water network
A park-scale water network concentrates on the integration schemes between plants. Two schemes are mentioned in the literature within the context of eco-industrial parks (EIPs)[17–22]: One uses direct integration, and the other uses indirect integration. The latter scheme only considers the CT as a utility, without considering that the DS also works as a utility. In addition,t he multi-outlet features of the DS are not considered by previous superstructures. However, in the steel industry, inter-plant integration is commonly adopted.Hence, we only consider the indirect integration between plants in this study. The modified superstructure may be observed in Fig.4.
As shown in Fig.4, the superstructure involves several plant-scale water systems, including one CT, two DSs, and one freshwater source. The limitations of the connections in the superstructure are as follows: ① Freshwater can be directly used in plants or in the first DS (DS1); ② the outlets from DS1 can be directly used in plants, whereas the backwash wastewater from it can only be discharged to the CT; and ③ each plant can discharge wastewater to the CT and the reclaimed water can be reused by all plants as well as being used in the second DS (DS2) to produce high-quality water as an alternative to DS1. In this study, the CT and DS both perform as utilities, making the water network more efficient than one centralized system. At the same time, the incorporation of a multi-outlet DS yields more potential for reducing the water consumption and total annual cost.
《Fig.4》
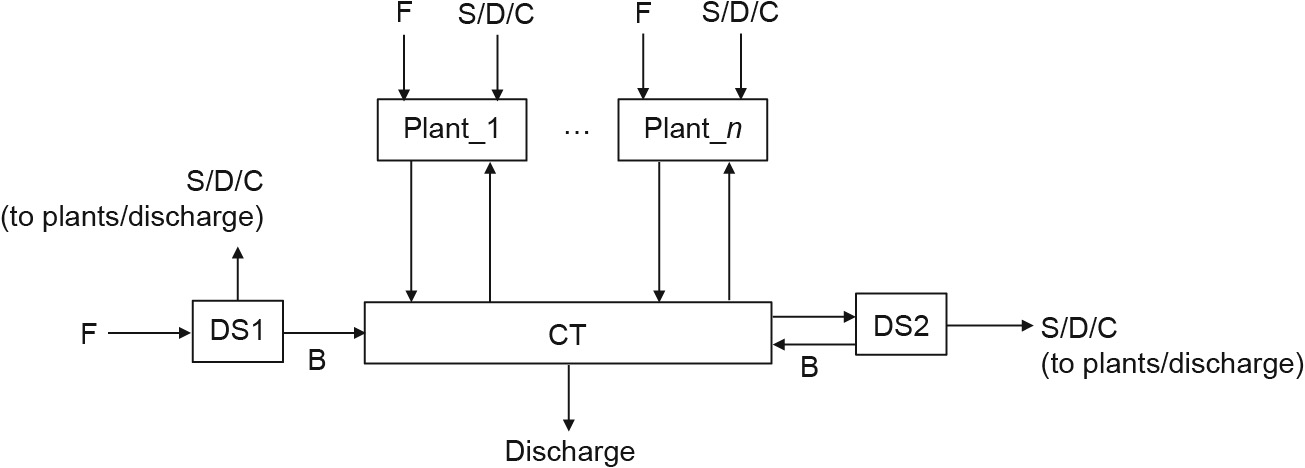
Fig.4.Superstructure of the park-scale water network.F denotes fresh water;B denotes backwash wastewater from the DS system;S denotes soft water;D denotes desalination water;C denotes concentrate.
2.1.4.Mathematical models
The mathematical models for the water network optimization in the steel park are derived from the unit-scale models and super-structures introduced above. Our mathematical models include the water flow and contaminant balances around every water system, the maximum inlet concentration limit on each water-use system, and the specific topological limitations for the water network formulation. To simplify the model, we fix the outlet concentrations of all outlet streams according to specific operation data from industry. The objective is to minimize the total annual cost, which includes the freshwater cost,water treatment cost, pumping cost, and discharge cost. Detailed information about the mathematical model is presented in Appendix A.1.
《2.2.Present and proposed system characterization》
2.2.Present and proposed system characterization
There are 11 major components of the steel industry water net work in our model.Water sources for steel manufacturing originate from either freshwater sources or the onsite desalination plant. Treated water originates from the onsite wastewater treatment facility, inter-process treatment units,or the constructed wetlands (CWs). The simplified interconnection of the processes and flows of water in the steel manufacturing process and the differences between the models may be observed in Fig.5.
The weight of the edges in Fig. 5 indicates flow magnitude. The hue of the node and edges indicates their flow variance from the original optimization model to the ecologically inspired optimization model. For example, the deeper hue of red in the wetlands and wastewater treatment nodes indicates a flow of greater deviation, compared with the original optimization model.
《Fig.5》

Fig.5.The steel industry water network.
《2.3.Phytoremediation intervention》
2.3.Phytoremediation intervention
In our implementation of the CWs, we aim to treat the brine water originally discarded from the RO process in the desalination system, as well as the backwash wastewater from the treatment units during iron and steel making by means of a batch process involving two wetlands with a varying substrate. This bioremediation process is illustrated in Fig.6, using a similar experimental apparatus as demonstrated by Farzi et al. [23] and Xu et al. [24].
The batch system can be seen in Fig.6, with the conductivity removal pictured to the left and the micro-contaminant stage to the right.Salicornia europaea (S.europaea) is a halophytic plant species that was chosen because of its unique ability to thrive in the saltladen RO concentrate from the DS; it can effectively uptake the chlorides and chlorine compounds found in backwash waste-water from our models’cooling water systems. Once the waste-water moves from the conductivity removal stage, as seen in Fig.6, the water then flows to secondary treatment by plant species such as Typha latifolia (T.latifolia) and Phragmites australis (P.australis), which further uptake contaminants such as zinc (Zn), magnesium (Mg),sodium(Na), potassium(K), copper(Cu), and calcium (Ca). After the flows are treated,the water is returned with a better quality than water from traditional treatment technologies,and is able to be reused in the processing and demand units of the steel manufacturing process.
《Fig.6》
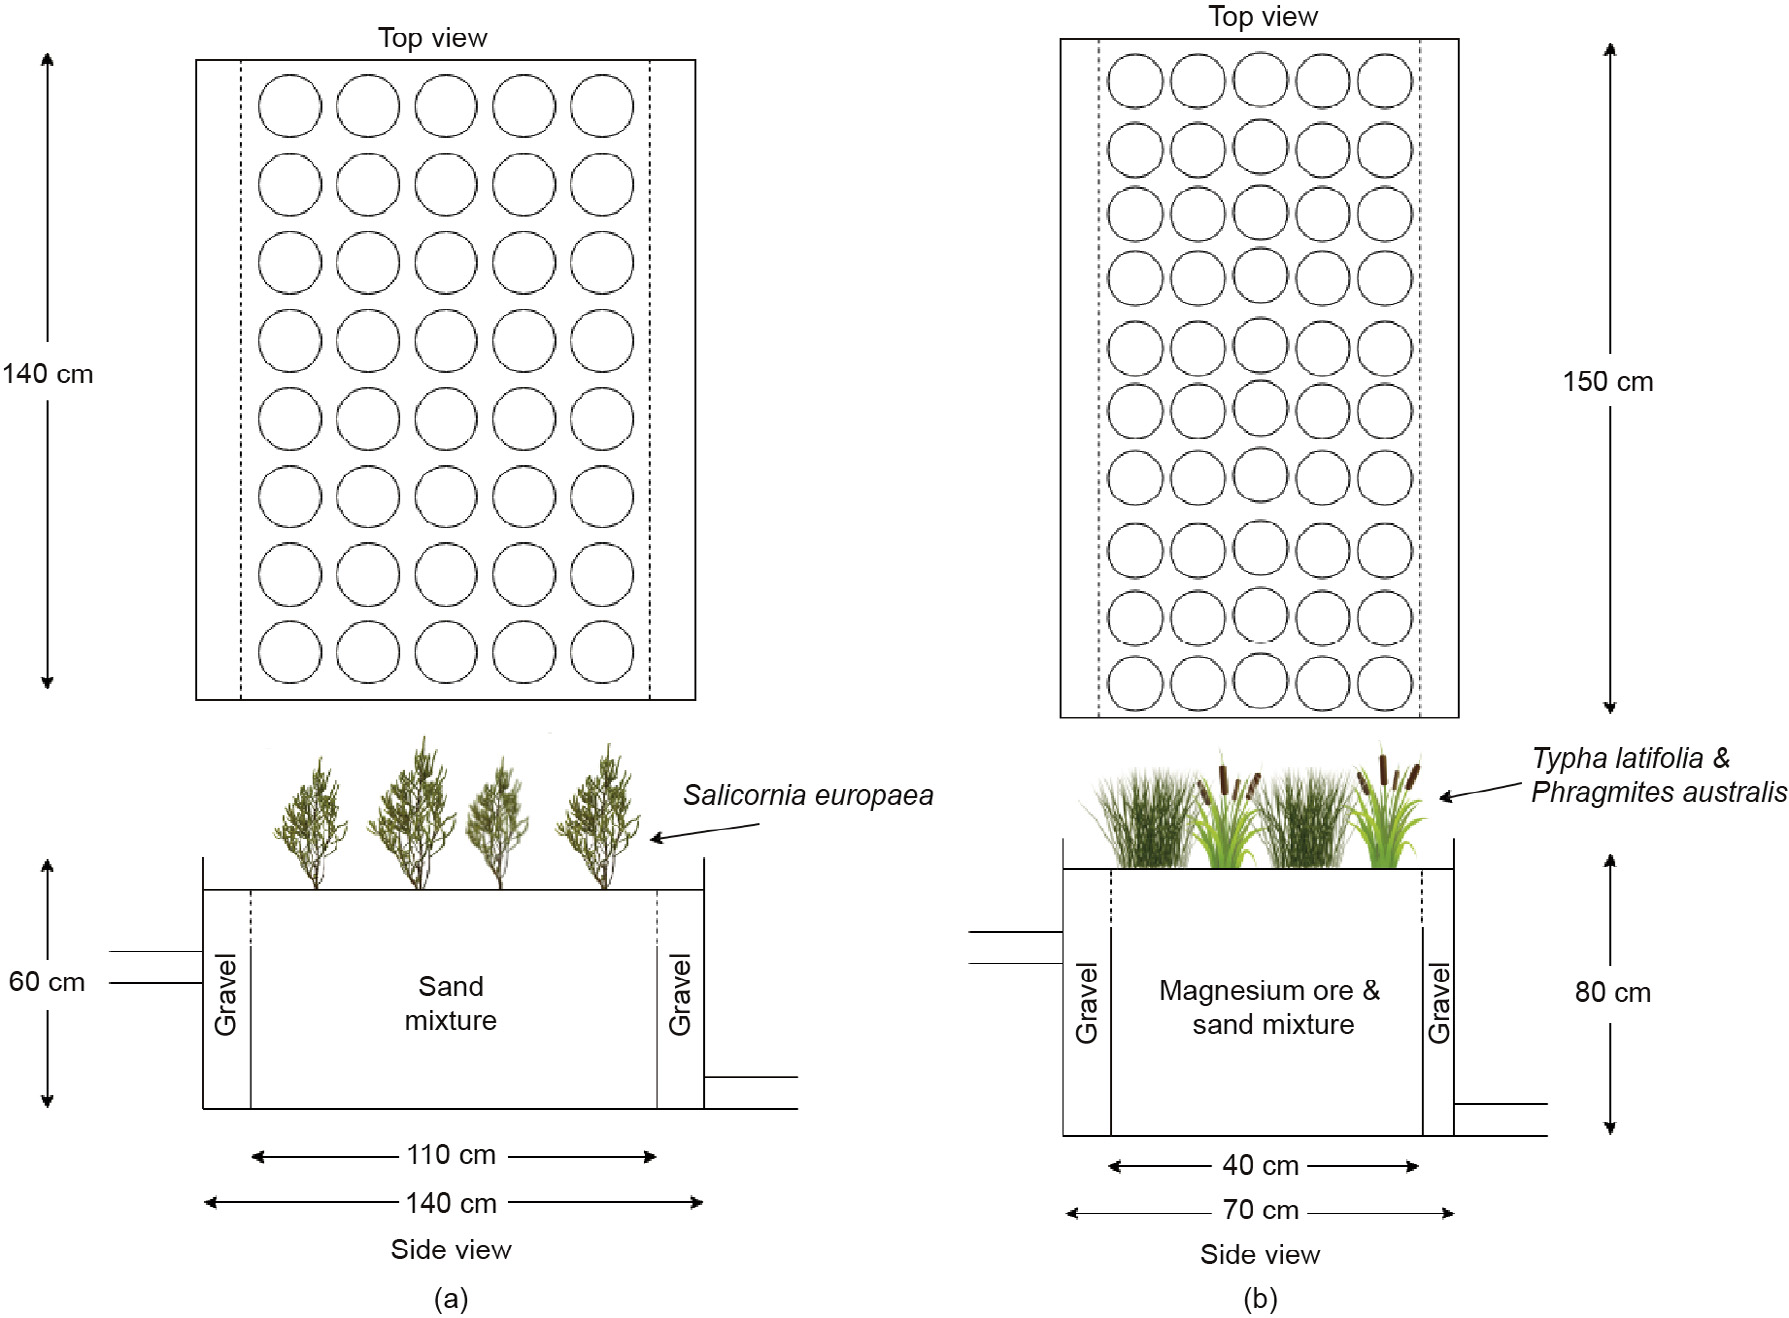
Fig.6.Constructed wetlands.(a)Conductivity removal stage;(b)micro-contaminant removal stage.
In this work, the combined flow from the RO process and the backwash wastewater from cooling to the CWs has a designed flow of 330 m3 h-1. The first phase of the batch system includes salt an chloride removal, while the next phase focuses on the other contaminants found in cooling wastewater, such as Zn, Mg ,Na, K, Cu,and Ca. A summary of the values used to calculate the chemical uptake kinetics is provided in Table 1[23–27]
《Table 1》
Table 1 Values used to calculate contaminant uptake in CW
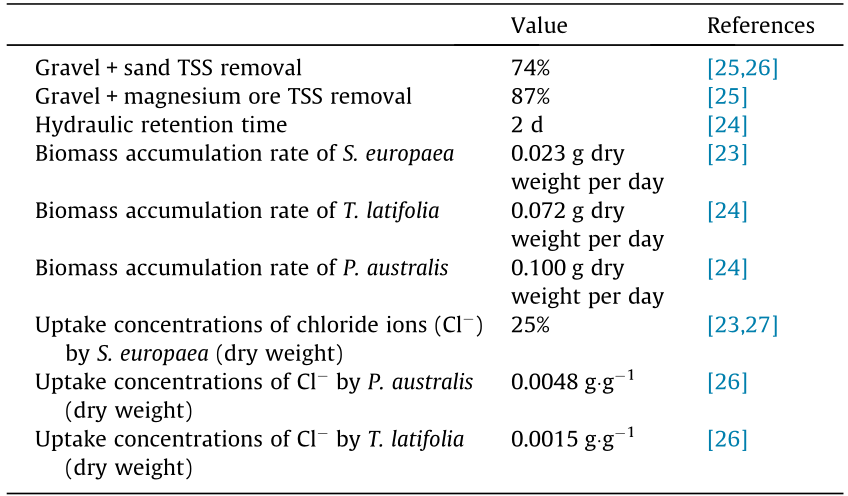
TSS: total suspended solids.
By using the influent concentration and flowrates in addition to the biomass accumulation rates and contaminant uptake amounts, it is possible to calculate the demand for the CW area, plant amounts, and contaminant removal efficacy. Table 2 demonstrates the area needed for the application of the wetlands and the approximate contaminant removal ratios, as determined by our model.
《Table 2》
Table 2 CW system contaminant uptake characteristics.
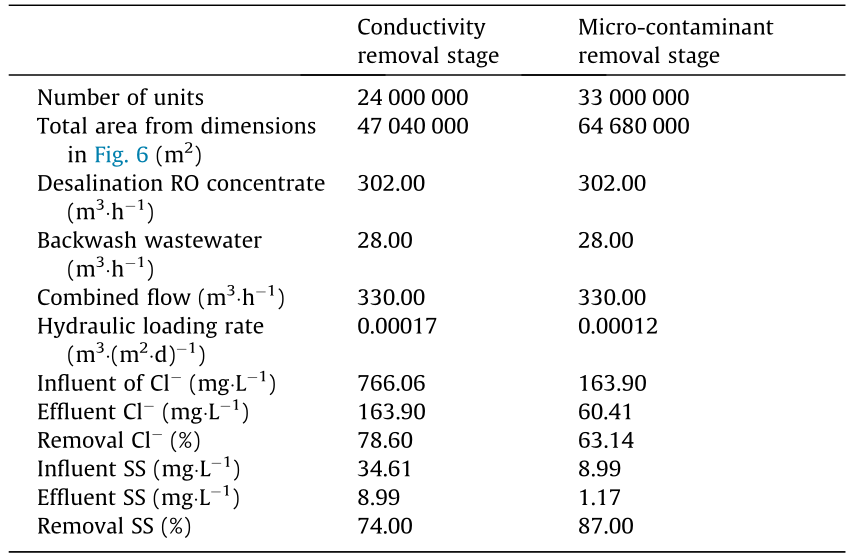
SS: suspended solids.
Full calculations of the contaminant uptake and wetland design can be found in Appendix A.2.
To study the effect of the CWs on the total water network,the CWs introduced herein are modeled as a wastewater treatment unit and are integrated into the existing model introduced previ-ously as demonstrated below:
In the conductivity removal stage (Stage 1), the mathematical models are shown below.
For chloride ions(Cl-),
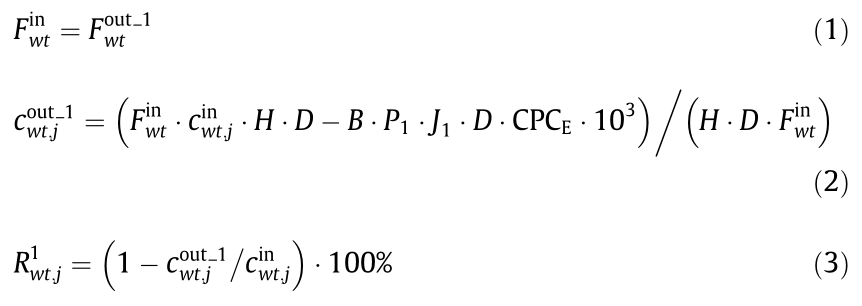
where  denotes the inlet water flowrate of a WT system,
  denotes the outlet water flowrate of backwash wastewater of a WT system,
  denotes the inlet concentration of contaminant j of a WT system,
 denotes the outlet concentration of contaminant j in backwash wastewater of a WT system in Stage 1, H denotes 24 h in one day, D denotes the hydraulic retention time in Table 1,B denotes the biomass accumulation rate of S.europaea, P1 denotes the plants per CW in Stage 1, J1 denotes the number of units in Stage 1, CPCE denotes 25% of the uptake concentrations of Cl- by S.euro-paea that can also be found in Table 1, and
  . ijdenotes the remova lratio of contaminant j of a WT system in Stage 1.
For the total suspended solids(TSS),
where SPC1 denotes the gravel+sand TSS removal ratio(74%) found in the literature, which is presented inTable 1.
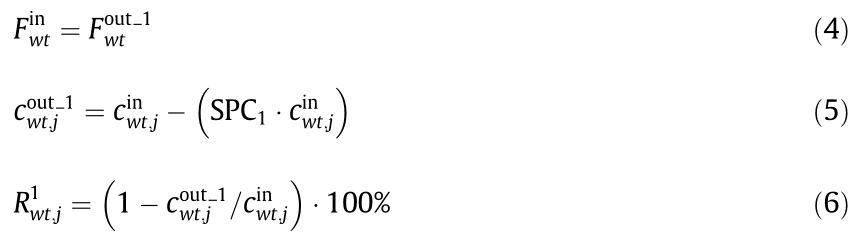
In the micro-contaminant removal stage (Stage 2), the mathematical models are as follows.
For Cl-,
where  denotes the outlet water flowrate of concentrate of a WT system,
  denotes the outlet concentration of contaminant j in concentrate of a WT system in Stage 2, CPCL denotes the plant uptake concentrations of T.latifolia, CPCA denotes the plant uptake concentrations of P.australis,P2 denotes the plants per CW in Stage 2, J2 denotes the number of units in Stage 2,GL denotes the dry weight (g) of T.latifolia per day and plant (50 plants·m-2 in study and over 90 d), GA denotes the dry weight (g) of P.australis per day and plant, and
  denotes the removal ratio of contaminant j of a WT system in Stage 2.
For the TSS,

where SPC2 denotes the gravel+ magnesium ore TSS removal ratio (87%) found in the literature, which is also presented in Table 1.
《3.Results and discussion》
3.Results and discussion
Multiple optimization case studies of the steel industry water network have been carried out with industry partners that have provided data as input. The details of these studies are provided in Appendix A.1.
《3.1.Traditional optimization》
3.1.Traditional optimization
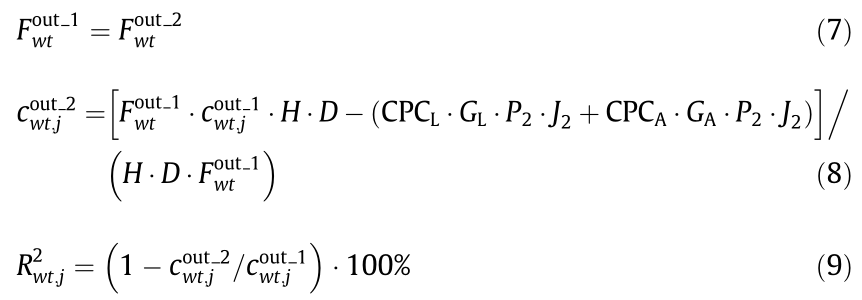
The optimal results of the optimization without considering the wetlands are shown in Table 3. The total freshwater consumption is about 2735 m3 ·h-1, which is mainly supplied to cooling systems and the DS. The effluent is the concentrate from two DSs, and the flowrate is about 585 m3·h-1. The total annual cost is about 9.98×10⁷ CNY · a-1, and the freshwater cost accounts for the biggest proportion. The results indicate a 23%, 29%, and 20% decline in freshwater consumption, wastewater discharge,and total annual cost, respectively.
《Table 3》
Table 3 Results of traditional optimization techniques compared with ecologically inspired optimization.
《3.2.Ecologically inspired optimization》
3.2.Ecologically inspired optimization
Major improvements in freshwater consumption,effluent generation,and cost resulted from utilizing wetlands to treat the wastewater that is otherwise discarded as effluent from the steel manufacturing process. This successful application of functional roles found throughout nature but often missing within industry led to a further reduction of freshwater demand and cost by 21% demand and 25%, respectively, beyond what was achieved by traditional optimization techniques (Table 3). The total effluent after the treatment by CW is reused. Thus, the total reductions that are achieved by combining traditional optimization with the use of wetlands are 39%, 100%, and 40% for freshwater demand, effluent, and cost, respectively.
These results corroborate Layton et al.’s claims of improved industrial system efficiencies through the inclusion of actors that act analogously to decomposers by returning previously unusable materials or energy back into the system [8]. Furthermore,this case study serves as an example of how the decomposer deficit that is found within industrial systems may be fulfilled through biological systems found in nature. This study provides evidence that the pairing of natural systems with a manufacturing network may be an effective and innovative method to achieve significant process improvements over traditional optimizations.
Despite the impressive gains listed in Table 3, it is notable that the combined steel water network and CWs model does not achieve the same degree of cycling that is commonly found in natural systems,where over 50% of material waste is consumed and recycled through the decomposer role.However, through the use of these CWs, a massive amount of plant biomass is required to treat the effluent. This biomass could act as a source to further increase the cycled amount of material flow in the system. To successfully mimic the decomposer role found in natural ecosystems within the steel manufacturing network, the reintroduction of this plant matter back into the system must not be neglected
As mentioned previously,one potential end-use of these wet-land plants after their life cycle is to pyrolyze the biomass and reintroduce the resulting biochar as a feedstock into the steel manufacturing process. However, pyrolysis processes are rarely perfectly anoxic, which would result in the combustion of plant matter containing Cl-. This combustion possibility could negatively result in hydrochloric acid and dioxin emissions [28]. Another potential detritivore that has been suggested for use in industrial systems is Salicornia, which can also be used as an agricultural component [8]. Salicornia has been demonstrated to have great potential for supplementing large-scale feed production for livestock, as it is high in oil,minerals, and protein [29]. These potential scenarios and the possible challenges associated with them have yet to be investigated. However, by using natural systems as a guide,these adaptations could drive this hypothesized water network further in adopting the performance of natural systems while leading to even greater decreases in operational costs than those provided by a traditional manufacturing network.
《4.Conclusion》
4.Conclusion
This study investigated the application of the decomposer role within industrial network design by adding a biological system to the wastewater network of a steel manufacturing facility. The traditional and ecologically inspired processes were optimized to analyze potential benefits for the water network in steel manufacturing. The results of this analysis indicate that expanding traditional manufacturing networks to include biologically inspired and natural systems can lead to higher efficiency and profitability of industrial systems. Applying a systems-level ecological perspective also allows modeling and optimizing complex interactions to be done more accurately. In this case, the role of decomposer was deemed to be missing from the steel manufacturing water network,and was added in form of a CW. This successful application of functional roles that are found throughout nature, but are often missing in industry, and the subsequent ecological optimization led to increased reductions in freshwater demand, effluent, and cost of 21%, 100%, and 25%, respectively, compared with traditional process optimization.
《Acknowledgements》
Acknowledgements
We are very grateful to the National Science Foundation (CBET-0967536) and the National Natural Science Foundation of China (2156112001), which have contributed significantly to the completion of this research.
《Compliance with ethics guidelines》
Compliance with ethics guidelines
Kaili Zhang,Stephen M. Malone, Bert Bras, Marc Weissburg,Yuehong Zhao, and Hongbin Cao declare that they have no conflict of interest or financial conflicts to disclose.
《Appendix A.Supplementary data》
Appendix A.Supplementary data
Supplementary data associated with this article can be found,in the online version, at https:// doi.org/ 10.1016/ j.eng.2018.07.007.


 京公网安备 11010502051620号


