

《1. Introduction》
1. Introduction
Many daily activities in contemporary society require a steady level of attention and performance; examples include driving a long distance on the highway or studying for hours—or even overnight—for a school exam; both of which often lead to a high level of mental fatigue. Borrowing the idea from physical fatigue, conventional wisdom believes that mental fatigue is associated with excessive demands on neural and cognitive systems [1]. Mental fatigue can lead to suboptimal functioning of the cognitive systems that involve attention, planning, and adaptively changing strategies in the face of negative outcomes [2,3]. From a behavioral standpoint, mental fatigue manifests itself as deteriorated performance, which is typically seen in target-detection failure, escalating reaction times, and the subjective experience of fatigue [4]. These objective declines are known as the effects of time-on-task (TOT) [1]. In the real-world workspace, TOT-related effects have been implicated in lower productivity and increased on-the-job lapses in situations where prolonged work hours were administrated without proper rest breaks [5]. For example, Ricci et al. [6] conducted a survey of the US workforce in 2007 and showed that 38% of workers reported being fatigued, with two-thirds of these reporting reduced productivity in the previous two weeks. In 2008, Boksem and Tops [7] reported in their review that half of the women and a third of the men in the working population of the Netherlands complained of fatigue. This ratio has increased by nearly a third in comparison with a similar report from 15 years ago (1993). In addition to lower productivity, mental fatigue can lead to serious consequences. In fact, it is generally accepted that many accidents involving night-shift truck drivers and night-call residents have been attributed at least in part to sleepiness, fatigue, and lapses in vigilant attention [8,9]. Because of these undesirable yet preventable consequences, continuous efforts have been made to try to understand the mechanisms of mental fatigue.
In 1917, the president of the American Psychological Association at that time, Raymond Dodge, wrote ‘‘I have no expectation that the laws of mental fatigue will be formulated in the immediate future” [10]. Remarkably, despite continuous efforts over a period of more than 100 years, a mature theory of the origins and neural mechanisms of mental fatigue has yet to be achieved [11]. Several different theories have been put forward to explain the performance decrements that are seen due to mental fatigue; these include underload theories [12,13], resource theories [14,15], and motivational control theories [16]. In brief, underload theories posit that the monotonous nature of the sustained-attention tasks in most fatigue studies makes performance prone to the intrusion of irrelevant thoughts [12]. Resource theories, on the other hand, associate the TOT effect in performance decline with excessive consumption of a limited pool of cognitive resources that cannot be replenished immediately [14,15]. Recently, Kurzban and colleagues [16] proposed the motivational control theories, which link task performance with the expected value of the outcomes; that is, a TOT-related behavioral decline would be expected if the performance becomes more costly than the expected value [7].
In this paper, we do not attempt to elaborate on the model of mental fatigue. Instead, we aim to provide a fresh perspective of the neurobiological basis of mental fatigue in healthy participants, by incorporating the advance of neuroimaging techniques and the new knowledge of human connectome [17]. The paper is organized to cover three general topics:
(1) We provide a brief review of pioneering neuroimaging studies of mental fatigue. The limitations of the univariate analysis framework are elucidated.
(2) We briefly introduce the brain connectome and graph theoretical analysis. An introduction to the fundamental concepts of the brain connectome and network metrics will assist in interpreting the observations from fatigue connectivity studies.
(3) We provide a literature review of the latest connectivity studies of mental fatigue. Findings on the neural mechanism of mental fatigue that have been revealed via the connectivity approach are discussed.
《2. Neuroimaging studies of mental fatigue》
2. Neuroimaging studies of mental fatigue
With the advance of neuroimaging techniques, convergent studies have employed multiple neuroimaging techniques to examine the neural correlates of TOT. This section briefly reviews neuroimaging studies of mental fatigue.
《2.1. Electroencephalography》
2.1. Electroencephalography
Historically, fatigue has been most commonly studied using electroencephalography (EEG), largely due to the feasibility of this method for long-term recording and lower constraint on participants’ behavioral performance. Because of the high temporal resolution, EEG studies of mental fatigue have mostly focused on changes associated with task-related activity. In general, it has been shown that increasing TOT leads to observable changes in both ongoing EEG activity and event-related potential (ERP) locked to task stimuli. For example, increases in lower alpha (i.e., 8–10 Hz) and theta (i.e., 4–7 Hz) band power were broadly reported with increasing levels of fatigue [18–20]. Given that event-related desynchronization in the low alpha band reflects alertness and expectancy in a task with high demands on attention [21], progressive increases in the 6–10 Hz band may specifically be associated with decreased arousal and alertness during periods when the attentional system is challenged [22,23]. Several studies also showed that lengthening TOT leads to a shift from lower to greater high-frequency energy (beta band: 13–30 Hz). Since EEG beta activity is strongly associated with cognitive processes [24], such an energy shift may reflect compensatory efforts in order to maintain performance levels as vigilance decrease [19,25]. In ERP, when a person enters a state of mental fatigue, the amplitude of the ERP components associated with error monitoring and inhibition is also significantly reduced [18,26]. Recently, Borghini et al. [27] presented a thorough review pertaining to the alterations of neurophysiological signals in aircraft pilots and car drivers during mental workload and mental fatigue, providing new insights that are relevant for real-world workers whose performance is particularly prone to TOT degradation. To be specific, convergent findings of increased EEG power in delta, theta, and alpha bands were revealed, which represent the transition between mental workload and mental fatigue.
《2.2. Functional magnetic resonance imaging》
2.2. Functional magnetic resonance imaging
Using arterial spin labeling (ASL) perfusion functional magnetic resonance imaging (fMRI) to examine time-related brain function changes during a 20 min psychomotor vigilance test, Lim et al. [28] found reduced cerebral blood flow (CBF) in the frontal, cingulate, and parietal regions after the task. Furthermore, CBF changes between pre-testing and post-testing in the frontoparietal network correlated with performance decline. Following these initial observations, Gui and colleagues [29] adopted a similar study design and investigated the amplitude of low-frequency fluctuation (ALFF) of the blood oxygen level-dependent (BOLD) time courses in a continuous 20 min psychomotor vigilance test. Compared with pre-test measurements (vigilant state), Gui et al. [29] found that the subjects exhibited reduced ALFF in the default mode network with increased ALFF in the thalamus after the test (fatigue state). More interestingly, pre-test resting ALFF in the posterior cingulate cortex and medial prefrontal cortex could be used to predict subjects’ subsequent performance decline; that is, the higher the initial ALFF in these two regions, the more stable the behavioral performance that could be expected throughout the 20 min test. Recently, Nakagawa and colleagues [30] utilized a series of visual and auditory dividedattention tasks with low and high attentional loads to investigate TOT effect modulated by load effect. Similar to previous fMRI studies, fatigue-induced deactivation was observed in wide areas within the cerebral cortex (including the frontal, temporal, occipital, and parietal cortices). The cerebellum and midbrain also exhibited significant fatigue-related hypo-activation. Moreover, a significant interaction effect was found in the midbrain (i.e., more deactivation in the high-load condition), which may reflect suppression of the negative feedback system that normally triggers recuperative rest to maintain homeostasis [30].
《2.3. Functional near-infrared spectroscopy》
2.3. Functional near-infrared spectroscopy
In a recent study, Jiao and colleagues [31] utilized functional near-infrared spectroscopy (fNIRS) to investigate the relationship between hemodynamic response in the prefrontal cortex and mental fatigue level during a 4 h n-back (i.e., n = 2) working memory task. They showed that the information entropy of hemodynamic responses was significantly related to task performance and subjective self-reported measures, suggesting the potential for using hemodynamic response as neural biomarkers for fatigue classification. Using fNIRS, De Joux et al. [32] reported increased right hemisphere oxygenation with TOT, together with significantly increased left hemisphere oxygenation in the local task with lengthening TOT, indicating increased utilization of bilateral cerebral resources with TOT in the local instead of the global discrimination vigil. Derosière et al. [33] investigated the neural adaptations of task-relevant motor structures to the TOT effect. In particular, motor-related activity changes were measured with the time course of corticospinal excitability using single-pulse transcranial magnetic stimulation; changes in the hemodynamic activity of motor-relevant brain areas were measured through fNIRS during a simple sustained-attention reaction-time task [33]. In line with findings in Ref. [32], significantly increased oxygenation was revealed in lateral prefrontal and right parietal areas after the emergence of the TOT effect. More importantly, significant increases in corticospinal excitability and primary motor activity were also reported, suggesting an adaptation to TOTrelated attentional lapses in the form of motor activity changes. More recently, Chuang and colleagues [34] combined EEG and fNIRS to investigate the hemodynamic signatures during driving fatigue. They found strengthening alpha suppression in the occipital cortex and increased oxygenation in the frontal, primary motor, parieto-occipital, and supplementary motor areas. These findings largely overlap with previous fNIRS observations [31,32,35].
《2.4. Positron emission tomography》
2.4. Positron emission tomography
Paus and colleagues utilized positron emission tomography (PET) to monitor regional CBF during continuous performance of a 60 min auditory vigilance task. Significantly decreased CBF was revealed in a large portion of the cortex, including the thalamus, frontal, parietal, and temporal areas in the right hemisphere, as a function of TOT [20]. Using a different experiment paradigm (i.e., non-selective vs. selective attention tasks), Coull et al. [36] examined the time-related brain function and measured CBF changes in the frontal and parietal cortices. In line with the observations in Ref. [20], they reported that significant performance decline was accompanied with reduced CBF in the right frontoparietal network in the non-selective task only; a statistic difference was not found in the selective task [36]. In searching for the source of the regional CBF alterations, Strum and colleagues [37] conducted a review of PET studies on alertness, and showed that a mostly right-hemispheric frontal, parietal, thalamic, and brainstem network seems to exist, which is co-activated by alerting and orienting attentional demands. It is therefore not surprising that CBF in those brain areas would be significantly reduced with reduced alertness due to lengthening TOT. Recently, Tajima et al. [38] used PET to further isolate the area of the medial orbitofrontal cortex that is associated with the sensation of fatigue.
《2.5. Univariate analysis versus multivariate connectivity analysis》
2.5. Univariate analysis versus multivariate connectivity analysis
It is noteworthy that the univariate analysis approach was generally employed in the studies summarized above; the question of whether the interconnectivity between brain regions and the integrity of the cortical network is altered under fatigue state is largely unknown [39]. According to the global neuronal workspace theory [40], an attentionally demanding or effortful cognitive process will be represented physiologically by the integrated activity of a large ensemble of workspace neurons, which are anatomically distributed across the brain. Although a wide range of brain areas are involved in mental fatigue, it is likely that the neural mechanisms underpinning fatigue may include changes on both the local and global scales [41]. Most recently, Ishii and colleagues [42] showed in their review that mental fatigue is not only caused by impaired activity in task-related brain regions, but also manipulated by mental facilitation and inhibition systems that modulate the activity of task-related brain regions to regulate cognitive task performance. These findings indicate that the brain connectome and network analysis are an ideal method for studying the neural mechanisms of mental fatigue.
《3. Brain network and graph theoretical analysis》
3. Brain network and graph theoretical analysis
With the advance of neuroimaging techniques and imageprocessing methods, convergent studies have shown that the human brain forms a large-scale network of interconnected regions within the human connectome [17]. In fact, a growing number of researchers believe that the human connectome serves as the anatomical substrate for neural communication, functional processing, and information integration in the brain. Network science, which is largely based upon graph theory, is a useful methodology for investigating the architecture of a complex network; it has already been widely employed for studying the brain network in various cognitive states and diseases [43].
In 1736, Swiss mathematician Leonhard Euler introduced the famous ‘‘Seven Bridges of Konigsberg” problem. This problem introduced graph theory to mathematics as a new branch that has been prosperous ever since. Heuristically, graph theory is a mathematic analysis framework for the quantitative assessment of the topological architecture of a network. In 1998, Watts and Strogatz [44] employed the graph theoretical approach to investigate the structure of the neural network of the worm Caenorhabditis elegans, and showed that the network was organized in a particular pattern to maintain a balance between local segregation and global integration. They defined this type of network architecture as "small-world.” This influential paper led to the renaissance of network science for studying the structure and functions of a wide variety of complex systems, including neuroscience, social science, physics, biology, and computer science. In fact, many complex systems show remarkably similar macroscopic behavior, despite profound differences in the microscopic details of the elements of each system or their mechanisms of interaction.
《3.1. Construction of brain networks》
3.1. Construction of brain networks
A network is defined as a set of nodes or vertices and the edges or links between them. Nodes in large-scale brain networks usually represent brain regions or sensors, such as regions of interest (ROIs) in fMRI, electrodes for EEG and/or magnetoencephalography (MEG), or anatomical parcellation schemes [45]. In fact, many research groups have proposed different parcellation schemes utilizing anatomical sulci/gyri/nuclei information [46–48], advanced connectivity-based parcellation framework [49], clustering of functional connectivity [50,51], and machine learning classifiers based on multimodal images [52]. Of note, in a recent study systematically comparing different parcellation methods for brain connectome studies, Arslan and colleagues [53] suggested that the most optimal parcellation method for brain connectome studies is not yet available. Given that the node definition employed by different parcellations might result in different properties of brain networks [54], assessment of the reproducibility of findings across different parcellation schemes is recommended for a comprehensive revelation of the neural mechanisms of mental fatigue.
In comparison with the relatively simple definition of a node, the nature of edges or links is more complex. For example, edges can be derived from different but relevant forms of connectivity: anatomical connectivity, functional connectivity, or effective connectivity [55,56]. Here, anatomical connectivity, also known as structural connectivity, typically corresponds to white matter tracts between pairs of brain regions, and is usually acquired by diffusion tensor imaging (DTI). Functional connectivity corresponds to temporal dependency between the activities of distributed and often spatially distant brain regions, and is usually estimated from fMRI data [45]. Depending on the measure, functional connectivity may reflect linear or nonlinear interactions, as well as interactions on different time scales [57]. Effective connectivity represents the direct or indirect causal influences of one region on another, and has been widely employed in EEG/MEG signal analyses [45]. A schematic diagram of network construction is shown in Fig. 1.
《Fig. 1》
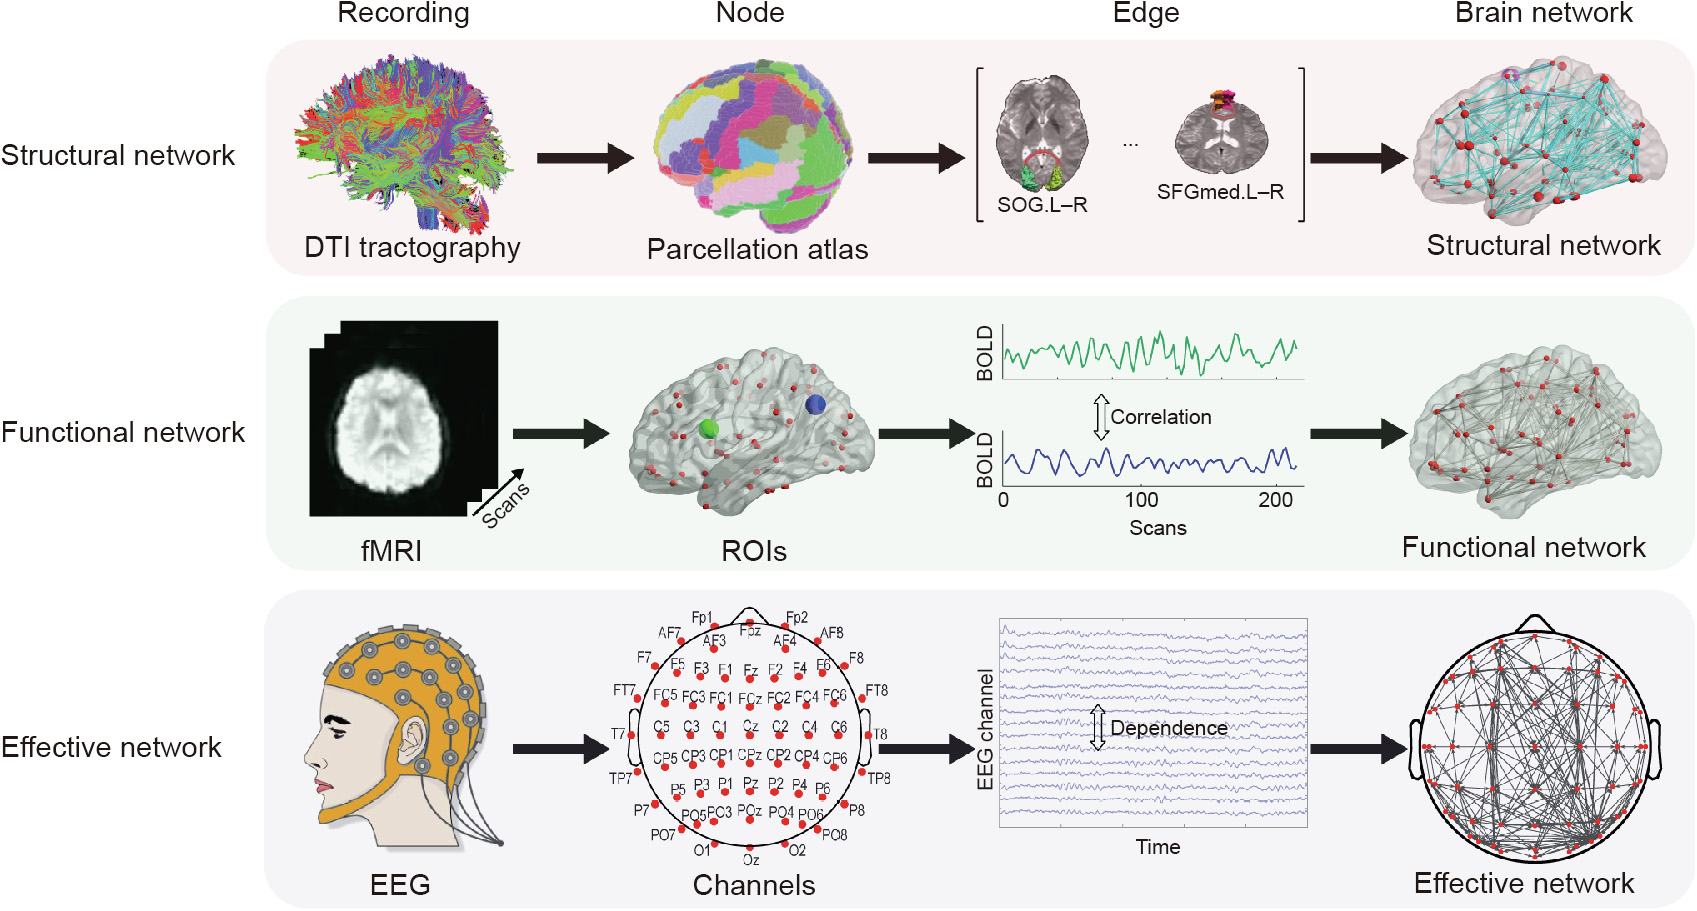
Fig. 1. Construction of brain networks from large-scale anatomical, functional, and effective connectivity datasets. SOG: superior occipital gyrus; SFGmed: superior frontal gyrus, medial part; L and R represent left and right respectively.
In addition to the type of connectivity, edges or links can be categorized based on their weight (i.e., weighted vs. binary) and directionality (i.e., directed vs. non-directed) [56]. Edge weight in a structural network may represent size, density, or coherence of anatomical tracts, whereas weight in a functional and effective network may represent magnitudes of interdependence. Binary networks contain edges indicating the presence or absence of connections (0 or 1), which can be estimated by applying various thresholding approaches on weighted networks [58–60]. Links may also be differentiated by the presence or absence of directionality information [61]. Although structural connections may be represented biologically with directed links, current neuroimaging methods are unable to directly detect causal directionality in structural connections [56]. Effective networks based upon high temporal-resolution EEG/MEG recordings, on the other hand, are more achievable through various causality measures such as Granger causality [62].
Once a network is constructed, it can be represented by its connectivity matrix (or adjacency matrix), where rows and columns denote nodes and matrix entries denote edges. This connectivity matrix served as the input for the following quantitative graph theoretical analysis.
《3.2. Graph theoretical analysis》
3.2. Graph theoretical analysis
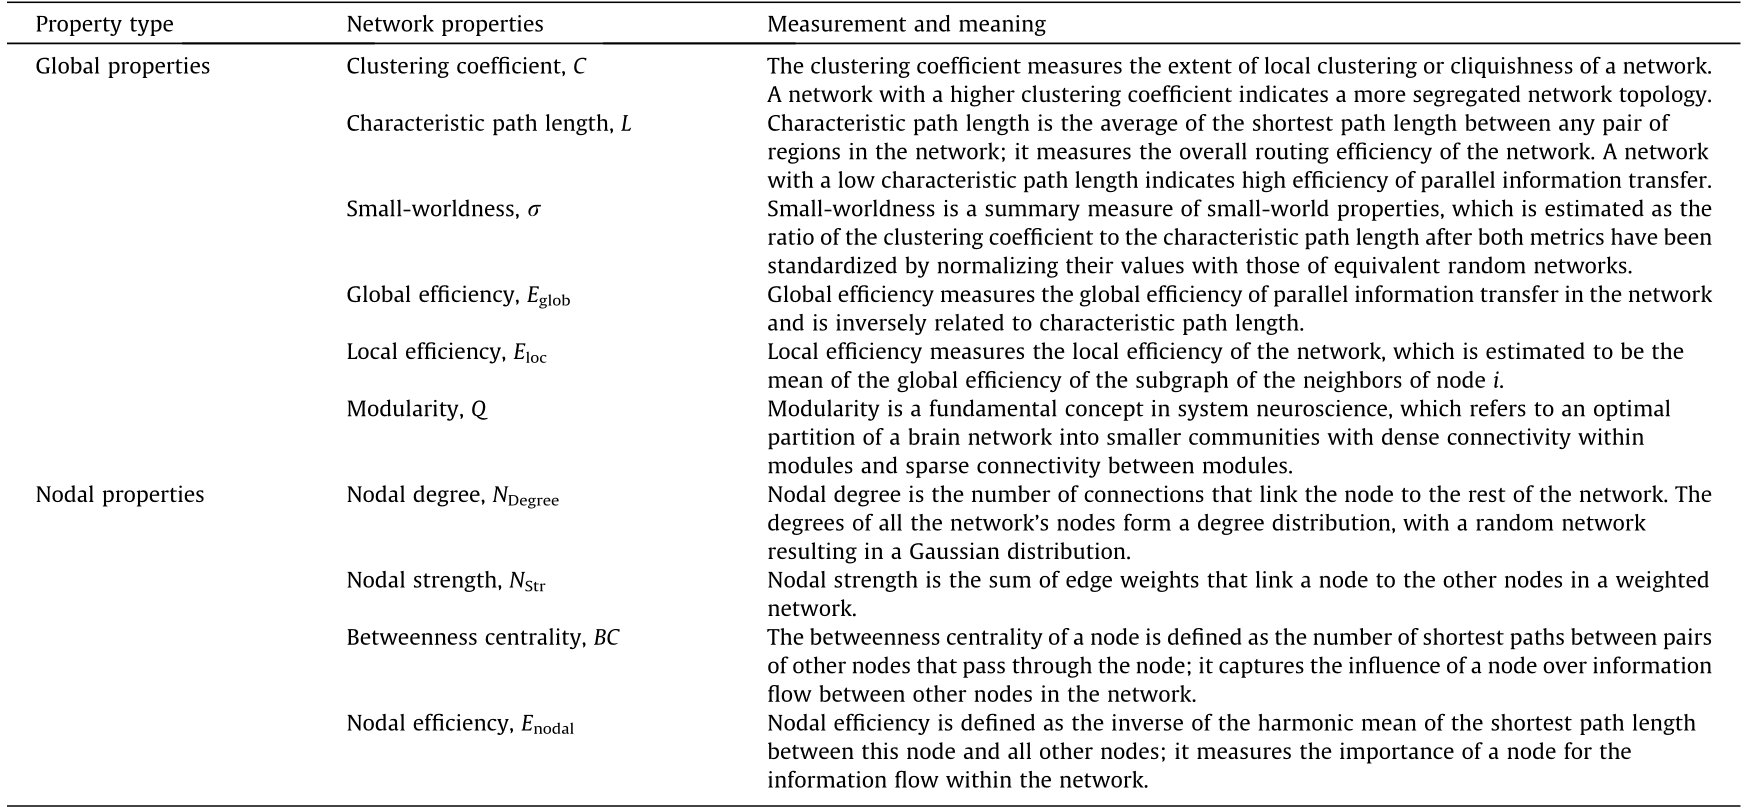
Graph theoretical analysis is aimed at providing a wide variety of quantitative measurements for assessing the topological architecture of a network (i.e., the spatial organization of the nodes/vertices and edges). Here, we provide a brief introduction of some network metrics that have been employed in fatigue connectivity studies (Table 1). More detailed descriptions of the graph theoretical parameters and their mathematic formulations can be found in reviews of this topic [55,56,61]. In addition, open software toolboxes are available for those who are interested in practice [56,63–66]. It should be mentioned that the estimation of these network measurements should take the network characteristics (i.e., weighted/binary, directed/non-directed) into consideration. Different mathematical formulations are employed based on the network characteristics.
《Table 1》
Table 1 Description of topological measures in graph theoretical analysis.
《4. Connectivity studies of mental fatigue》
4. Connectivity studies of mental fatigue
In April 2018, using the keywords "mental fatigue/TOT and connectivity,” we found 99 relevant studies in the Web-of-Science database↑ . Although it is generally accepted that chronic fatigue syndrome alters brain structure and anatomical connections [67,68], it is still largely unknown whether the transient cognitive processes of mental fatigue induced by TOT lead to anatomical alterations. We therefore limited our primary focus to fatigue-related alterations of functional connectivity. By further excluding studies with patients and experimentation of sleep deprivation as a fatigue-inducing paradigm, we finally obtained 29 studies [27,29,39,41,69–93]. The main part of this section is based on these studies. In Table 2, we present a summary of several recent representative connectivity studies on mental fatigue.
↑ http://webofknowledge.com/WOS.
《Table 2》
Table 2 Summary of main findings in functional connectivity studies of TOT.


AAL: automated anatomical labeling atlas [46]; HOA: Harvard–Oxford atlas [47,48]; Craddock: Craddock’s functional atlas [50]. PVT: psychomotor vigilance test; PDC: partial directed coherence; GPDC: generalized PDC; PCC: posterior cingulate cortex; MePFC: medial prefrontal cortex. a Abbreviations of network metrics: FC: functional connectivity; D: physical distance; Str: connectivity strength; γ: normalized clustering coefficient; λ: normalized characteristic path length. The superscript arrow indicates the development trend of the network metric due to mental fatigue, while, N.S. indicates non-significant.
《4.1. Findings of EEG connectivity studies》
4.1. Findings of EEG connectivity studies
Based upon high-density EEG recording, Ten Caat et al. [91] introduced a data-driven functional units (FUs) approach to better represent spatially connected sets of EEG electrodes that record pairwise significantly coherent signals. Using a visual-vigilance experiment design (i.e., a prolonged switching task), they applied the FUs approach in a mental fatigue study and found that the fatigue effect mainly influenced the lowest frequency band (1–3 Hz). In particular, the largest FUs were found to be located both anteriorly and posteriorly for the non-fatigued group, but only posteriorly for the fatigued group. However, in their subsequent study [94], a widespread effect of mental fatigue on EEG power and coherence across multiple frequency bands was revealed, as demonstrated by significantly increased power and coherence. This discrepancy may stem from large inter-subject variance and the small number of subjects (five subjects) in Ref. [91] in comparison with a larger sample (26 subjects) in Ref. [94]. Recently, Clayton et al. [76] presented a thorough review pertaining to cortical oscillations in sustained attention, which highlighted theta, alpha, and gamma bands in sustained attention. Recent network studies have shown the importance of long-range cortical connectivity in preserving optimal levels of performance with lengthening TOT. For example, we replicated the experiment design in Ref. [28] (i.e., a 20 min psychomotor vigilance test) and employed cortical connectivity to assess the TOT-related alterations [39]. A statistically significant increase of characteristic path length in the low-alpha brain network was revealed, which was associated with the extent of performance decline. More interestingly, and in line with previous neuroimaging observations [20,36], we reported an asymmetrical alteration of cortical connectivity in the frontoparietal regions (Fig. 2); that is, significant decreases in left frontoparietal connectivity were associated with sustained attention. Similar disintegrated network topology was reported in fatigue studies that used separate visual attentional tasks [74] and simulated driving paradigms [78,95].
《Fig. 2》

Fig. 2. An example of directed EEG functional connectivity patterns between (a) vigilant and (b) fatigued states in the first and last 5 min quartiles of a 20 min PVT. Reproduced from Ref. [39] with permission of Elsevier Inc., ![]() 2017.
2017.
However, in comparison with the cognitive task paradigm, in which subjects were typically required to perform the prolonged execution of various cognitive tasks (including vigilance or sustained-attention tasks [39,81], visual attention tasks [41,96], and working memory tasks [97,98]), prolonged driving reduced the perception capability and mental alertness through underload boredom. To investigate the complex neural mechanisms of mental fatigue, we systematically compared the effects of mental fatigue induced by a psychomotor vigilance task (PVT) paradigm and by simulated driving [71]. Behaviorally, we found a significant mental fatigue effect in both fatigue-inducing conditions. Furthermore, distinct network reorganizations were revealed between PVT and simulated driving: increased path length and clustering were found in simulated driving, in comparison with solely increased path length in PVT. These findings may therefore augment our understanding of the complex nature of fatigue-related neural mechanisms and point to the key factor of mental workload in the modulation of mental fatigue. As a corollary to the resource theory, mental workload has been defined as the level of an individual’s limited mental capacity that is actually required by task demands [99]. Findings from cognitive psychology studies have shown an ‘‘inverted U-shape” between mental workload and task performance [100,101] that aligns with the underload theories [12,13] and resource theories [14,15] of mental fatigue. According to a recent review by Borghini et al. [27], there is an apparent association between mental workload and mental fatigue that is detectable as a coherent sequence of changes in physiological signals; this is important because classification of mental workload during cognitive tasks is highly important in real-world applications. More interestingly, several recent studies have shown that the workload effect is associated with mental fatigue in prolonged cognitive group-cooperation tasks [102–104]. In light of the EEG connectivity studies on mental workload, we previously introduced an analysis framework that utilized cross-frequency phase interactions for cognitive workload assessment [105,106]. More recently, we have demonstrated the feasibility of identifying a subset of salient EEG connectivity features for cross-task workload classification [107], thus moving a step closer to complex mental workload assessment in real-world applications.
《4.2. Findings of fMRI connectivity studies》
4.2. Findings of fMRI connectivity studies
Using a simple Go/No-Go experiment design demanding sustained attention, Giessing et al. [108] investigated human brain functional reorganization associated with enhanced and impaired attentional task performance modulated by nicotine. A significant TOT effect was revealed in impaired behavioral performance and disintegrated architecture of functional brain network. They also reported a positive effect of nicotine in task performance and the optimal organization of the functional brain network, with greater behavior benefits correlating with a more integrated network topology in more frequent smokers. These findings provided new insights into utilizing brain network analysis as theoretically principled pharmacodynamics biomarkers of pro-cognitive drug effects in humans. In 2013, a group composed of some of the same researchers performed an exploratory study to investigate individual differences in cognitive resilience to mental fatigue and the prolonged effect of a period of sustained attention on post-task resting-state brain networks [95]. As expected, substantial between-subject differences in behavioral performance were revealed. These results are consistent with the theory that individuals possess a trait-like predisposition to TOT vulnerability with an accompanying biological substrate [109]. In comparison with the resting state, the functional brain network became more integrated during task performance, but linearly decreased with ongoing TOT. While searching for the particular origins of the network alterations, Gui and colleagues [29] utilized the ALFF to identify brain regions that were vulnerable to mental fatigue; they found significantly reduced ALFF in the default mode network and increased ALFF in the thalamus. Subsequent connectivity analysis revealed a significantly reduced anti-correlation between the posterior cingulate cortex and the right middle prefrontal cortex after the test, suggesting the theory of task-positive and task-negative networks in mediating TOT effects. In our most recent study [72], we developed inter- and intra-module network metrics to quantify the topological characteristics of subnetworks during TOT. We found significant predictive power of the modular network metrics in the frontoparietal network, which further resembles the observations in Ref. [29].
《4.3. Findings of fNIRS connectivity studies》
4.3. Findings of fNIRS connectivity studies
Xu et al. [70] recently utilized fNIRS to detect brain activities when subjects performed long-term driving in a semi-immersive virtual reality environment. Wavelet coherence and wavelet phase coherence within six frequency bands were estimated in order to reveal the strength and synchronization of cerebral connectivity. At the end of the 60 min simulated driving task, wavelet coherence was significantly reduced in frequency intervals of 0.6–2 Hz and 0.052–0.145 Hz in the prefrontal cortex and 0.021–0.052 Hz in the motor cortex. In addition, significantly lower wavelet phase coherence was revealed in 0.6–2 Hz and 0.052–0.145 Hz in the prefrontal cortex and 0.021–0.052 Hz in the motor cortex. The significantly altered functional connectivity thus suggested an adverse effect of mental fatigue on the cognitive function, with particular influence in the prefrontal cortex and on the cooperative mechanisms between prefrontal cortex and motor cortex.
《4.4. Connectivity findings of fatigue classification》
4.4. Connectivity findings of fatigue classification
In addition to the abovementioned graph theoretical studies of mental fatigue, attempts to utilize functional connections as discriminative features for fatigue classification have achieved satisfactory detection accuracy. We previously introduced an analysis framework [81] for the automatic classification of mental fatigue by combining multivariate pattern analysis (MVPA) of functional connectivity with a support vector machine (SVM). In brief, a 20 min PVT experiment was divided into four quartiles, with the first 5 min representing a vigilant state while the last 5 min represented a fatigued state. Satisfactory fatigue classification accuracy was achieved (i.e., an overall accuracy of 81.5%, a sensitivity of 77.8%, and a specificity of 85.2%). Moreover, we found that most of the functional connections with high discriminative power were significantly reduced in the fatigued state, which further corroborated the convergent findings of disintegrated network architecture in previous EEG connectivity studies. An improved connectivitybased classification analysis framework was more recently proposed [71]. With the sequential floating forward selection method, we obtained the most discriminative feature subset, which was further subjected to an SVM classifier with a radial basis function (RBF) kernel and the sequential minimal optimization learning method. We have assessed the performance of the framework in two different fatigue conditions (i.e., 30 min PVT and 60 min simulated driving) and achieved high accuracy in both conditions (> 90%). More interestingly, apparently different discriminative functional connectivity features were revealed, suggesting potentially different fatigue-related neural mechanisms underlying these two conditions (Fig. 3). Using the maximum eigenvalue of the EEG connectivity matrix, Li et al. [75] also introduced a simple method for fatigue detection with several EEG channels. In brief, the adjacency matrix was constructed by estimating mutual information among nine EEG channels mainly residing in the central line of the frontal, central, and parietal areas. The maximum eigenvalue was found to increase with increasing levels of mental fatigue; this could be used for fatigue monitoring, with prior setting of the threshold value. Most recently, Arico et al. [110] presented a thorough review on brain states (mental workload/fatigue) monitoring in operational environments, which covers a wide range of topics from electrophysiological measures for the mental state evaluation to machine learning techniques for mental state classification. We believe that this study represents the most updated overview of the utilization of EEG for mental state monitoring.
《Fig. 3》

Fig. 3. An example of an EEG functional connectivity pattern for fatigue classification in 1 h of simulated (a) driving and (b) 30 min of PVT. Distinct discriminative connections were determined in driving and PVT, suggesting potentially different neural mechanisms. GPDC: general partial directed coherence. Reproduced from Ref. [71] with permission of IEEE, ![]() 2018.
2018.
《4.5. Connectivity findings of fatigue recovery》
4.5. Connectivity findings of fatigue recovery
Daily experience indicates that taking a break may be an effective means of fatigue recovery and may boost cognitive performance [5,111,112]. However, in comparison with the relatively comprehensive picture we now have of mental fatigue, the underlying neural mechanism of fatigue recovery is only beginning to be revealed [113]. In a recent study [41], we applied graph theoretical analysis on functional brain connectivity in a two-session experiment, with one session including a mid-task break, in order to investigate the effects of receiving a rest break on the topological properties of brain networks (Fig. 4). In line with previous functional connectivity fatigue studies, the brain network became less efficient in the post-task resting state in the session (referred to as the ‘‘no-rest session” hereafter) when a mid-task break opportunity was not administered [41]. To be specific, subcortical brain areas exhibited more vulnerability to mental fatigue. Counterintuitively, in the session with a mid-task break (referred to as the ‘‘rest session” hereafter), we did not observe significant improvement in task performance as compared with the no-rest session. We previously interpreted this finding partially in the context of the break manipulation [41]. That is, moderators such as break length [113], the nature of the break [111], and the administering time [114] may all play roles in the amount of recovery a break affords to performance. In fact, Lim and Kwok [115] performed an interesting investigation on the effects of varying break length on TOT, and revealed a significant association between the length of the rest break and behavioral performance improvements. Moreover, Ross et al. [114] manipulated the administering time of a 1 min rest break and showed that the restorative effect of TOT was only effective when the break was administered early in the task. Although insignificant behavioral improvement was revealed in the rest session, a significant block-by-session interaction was revealed in the local efficiency of the brain network, which was mainly attributable to a significant post-task decline of local efficiency in the no-rest session, with a preserved local efficiency in the rest session [39,96,108]. In particular, improved nodal efficiency was observed in the left frontal gyrus and right parietal areas. These observations were comparable with the results in Ref. [113], where greater recovery of performance following long breaks was associated with greater activity in the putamen and left middle frontal gyrus. Given the paucity of studies on the neural mechanisms of fatigue recovery, further investigations with careful experiment design considering various break manipulation factors are recommended in order to confirm our findings.
《Fig. 4》
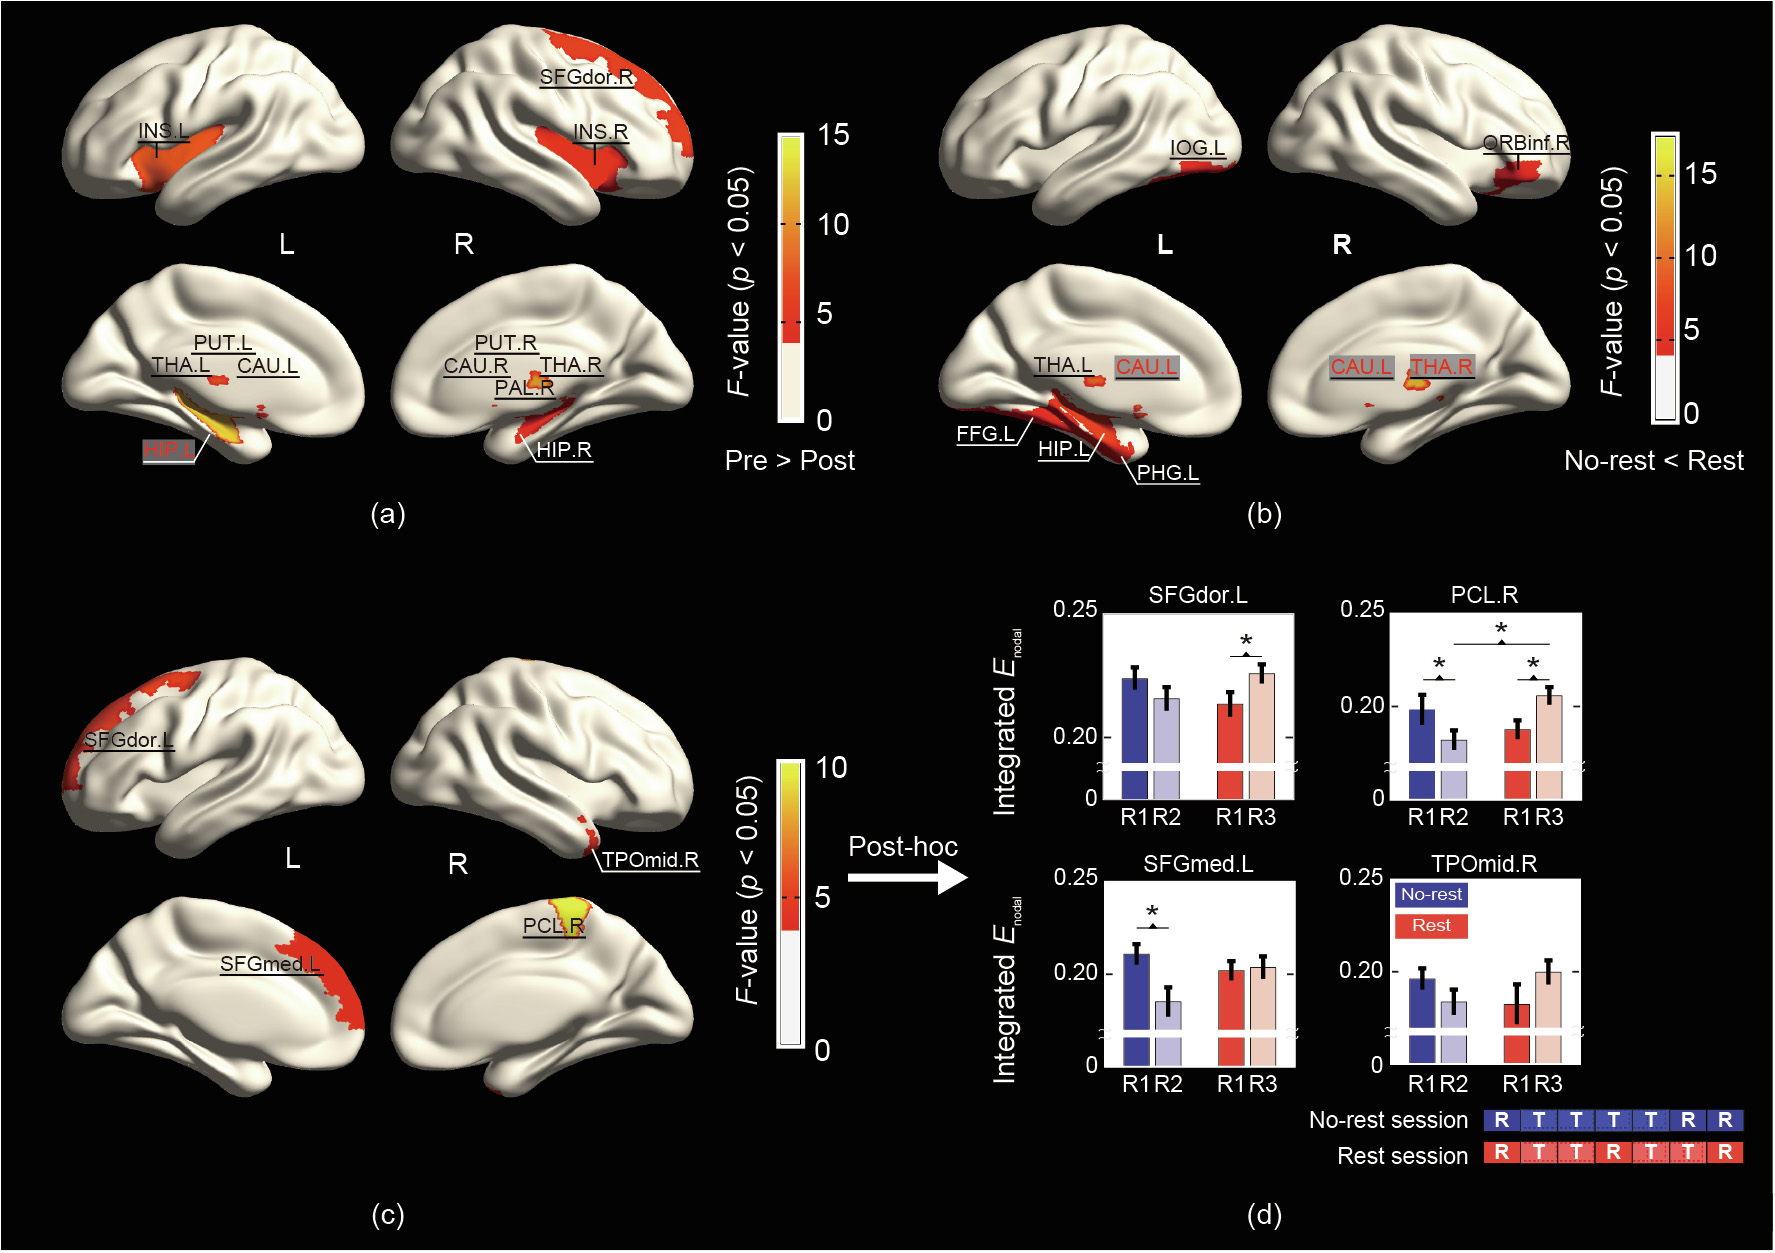
Fig. 4. An example of regional characteristics in a functional brain network showing (a) significant block effect, (b) session effect, (c) session-by-block interaction effect. Posthoc analysis of regions with significant interaction effect is shown in (d). INS: insula; SFGdor: superior frontal gyrus, dorsal part; PUT: putamen; THA: thalamus; CAU: caudate nucleus; HIP: hippocampus; PAL: pallidum; IOG: inferior occipital gyrus; ORBinf: inferior frontal gyrus, orbital part; FFG: fusiform gyrus; PHG: parahippocampal gyrus; SFGmed: superior frontal gyrus, medial part; PCL: parietal central lobe; TPOmid: temporal pole, middle part. Reproduced from Ref. [41] with permission of Elsevier Inc., ![]() 2018.
2018.
《5. A brief discussion and future directions》
5. A brief discussion and future directions
Connectivity studies have generally found evidence of reduced global integration (higher path length and/or lower global efficiency [39,41,71,74,95,96,108], although see Ref. [88] for an exception) and increased local segregation (clustering coefficient and/or local efficiency [41,71,74,88,95,108]) in the fatigue state (Table 2). According to the global neuronal workspace theory [40], a globally integrated network topology is needed to support high task demands. Borrowing ideas from the resource theories, participants’ ability to maintain focused sustained attention on a vigilance task is a function of the amount of mental resources available [14,15]. The repeated use and depletion of finite cognitive resources may in turn lead to the observed disintegrated and more segregated network architecture. Further evidence supporting the resource theories comes from our recent fatigue-recovery studies [41,74], in which a restorative effect was observed on brain network reorganization when a mid-task break opportunity was administered in a continuous vigilant task. It is possible that rest breaks might release the demands on cognitive and neural resources, and thus reverse the neural effects observed over periods of fatigue.
Several lines of evidence suggest that the default mode network, salience network, and thalamocortical loop are related to mental fatigue. According to Ref. [116], thoughts are constrained automatically by the default mode network and deliberately by the frontoparietal attention network, while the salience network is responsible for modulation. Due to the dominant role of the default mode network in the resting state, it is typically considered to be a task-negative network. Consequently, reduced deactivation in the default mode network is thought to be associated with the reduced direction of attention to the external environment—the so-called ‘‘mind-wandering” state [113]. In line with this finding, Gui and colleagues [29] have reported that people with higher resting-state activation in the default mode network may have greater flexibility and more brain resources to reallocate from task-negative to task-positive networks when a highly demanding task is required, and may therefore be more resistant to TOT effects. According to the resource-control model of sustained attention [117], increasing TOT leads to depletion in executive resources in the salience network [118] that are needed to inhibit the activation of the default mode network and effectively perform the primary task [119]. In fact, TOT effects affect not only the intranetwork activations, but also the inter-network association; to be specific, a higher anti-correlation between the default mode network and the attention network was found [29]. In our recent study [41], TOT-related regional disruptions were mainly observed in the subcortical regions. This finding provides further evidence to support the notion that the striato-thalamo-cortical loop may be a possible cause of central fatigue in more strenuous circumstance (e.g., sleep deprivation) [120] and multiple pathologies (e.g., chronic fatigue syndrome, multiple sclerosis) [121].
It is noteworthy that most graph theoretical metrics are dependent on the number of network nodes and edges. Therefore, it is only meaningful to compare graphs if they are matched for the number of nodes and connection numbers. Table 2 shows that various methods were employed for node definition, ranging from EEG channels to parcellation atlas in fMRI studies. On the one hand, the most optimal parcellation method for brain connectome studies is not yet available [53]. On the other hand, convergent evidence suggests that different node-definition methods may lead to different properties of brain networks [54]. New advances in brain network construction using multiple neuroimaging techniques and node definitions are therefore needed to provide more comprehensive information. Alternative efforts may also be made to explore new methods (e.g., meta-connectome analysis [122,123]), which may lead to reliable summary results across studies. We can expect important advances in our understanding of the neural mechanisms of mental fatigue with the continuously increasing number of fatigue-related neuroimage studies in the near future.
《6. Conclusion》
6. Conclusion
This invited review briefly introduced the nascent technique of the brain connectome and demonstrated its great potential for revealing the neural mechanisms of mental fatigue. We hope that this paper will help those who are interested in applying brain connectome techniques in fatigue studies. While obstacles remain to the full unmasking of the mechanisms of mental fatigue, the allure of preventing fatigue-related undesirable consequences is strong. In this rapidly expanding field of neuroergonomics, the development of methods to better reveal the neural mechanisms of mental fatigue is continuously growing and evolving to embrace new technologies. We believe that the brain connectome can be a useful approach not only for the elucidation of underlying neural mechanisms, but also for the automatic detection and classification of mental fatigue.
《Acknowledgements》
Acknowledgements
This work was supported by the ‘‘Hundred Talents Program” of Zhejiang University (awarded to Yu Sun), by the Fundamental Research Funds for the Central Universities (2018QNA5017, awarded to Yu Sun), and by the National Natural Science Foundation of China (81801785, awarded to Yu Sun). The authors would also like to thank the National University of Singapore for supporting the Cognitive Engineering Group at the Singapore Institute for Neurotechnology (R-719-001-102-232, awarded to Nitish Thakor). This work was supported in part by the Ministry of Education of Singapore (MOE2014-T2-1-115, awarded to Anastasios Bezerianos) and the Shanghai Sailing Program (17YF1420400, awarded to Peng Qi).
《Compliance with ethics guidelines》
Compliance with ethics guidelines
Peng Qi, Hua Ru, Lingyun Gao, Xiaobing Zhang, Tianshu Zhou, Yu Tian, Nitish Thakor, Anastasios Bezerianos, Jinsong Li, and Yu Sun declare that they have no conflict of interest or financial conflicts to disclose.


 京公网安备 11010502051620号


