

《1. Introduction》
1. Introduction
After opening up the country and lifting more than two centuries of rigorous trade restrictions under the Tokugawa Shogunate, modern technologies for the construction of infrastructure were introduced in Japan in 1868 during the Meiji Restoration. During this period, people began to use metal as a structural material. New bridges built around the 1870s began to be made using cast and/or wrought iron with riveting techniques; Kurogane Bridge in Nagasaki (with a span of 27 m) is known as the first modern cast iron bridge in Japan. Starting in 1895, steel quickly replaced wrought iron as the favored material for metal bridges. However, the Great Kanto Earthquake disaster in 1923 revealed the many drawbacks of wrought iron, and high-tensile steels were later adopted for bridges. Kiyosu Bridge—an eyebar-chain selfanchored suspension bridge spanning 183 m over the Sumida River in Tokyo—is a representative example of riveted bridges from this era [1].
In the 1900s, the use of reinforced concrete for infrastructure became more common, and pre-stressing technology was widely used for numerous types of simple structural elements in the 1950s. The availability of advanced steel and reinforced concrete technologies provided an impetus for the construction of longerspan bridges and taller buildings [2].
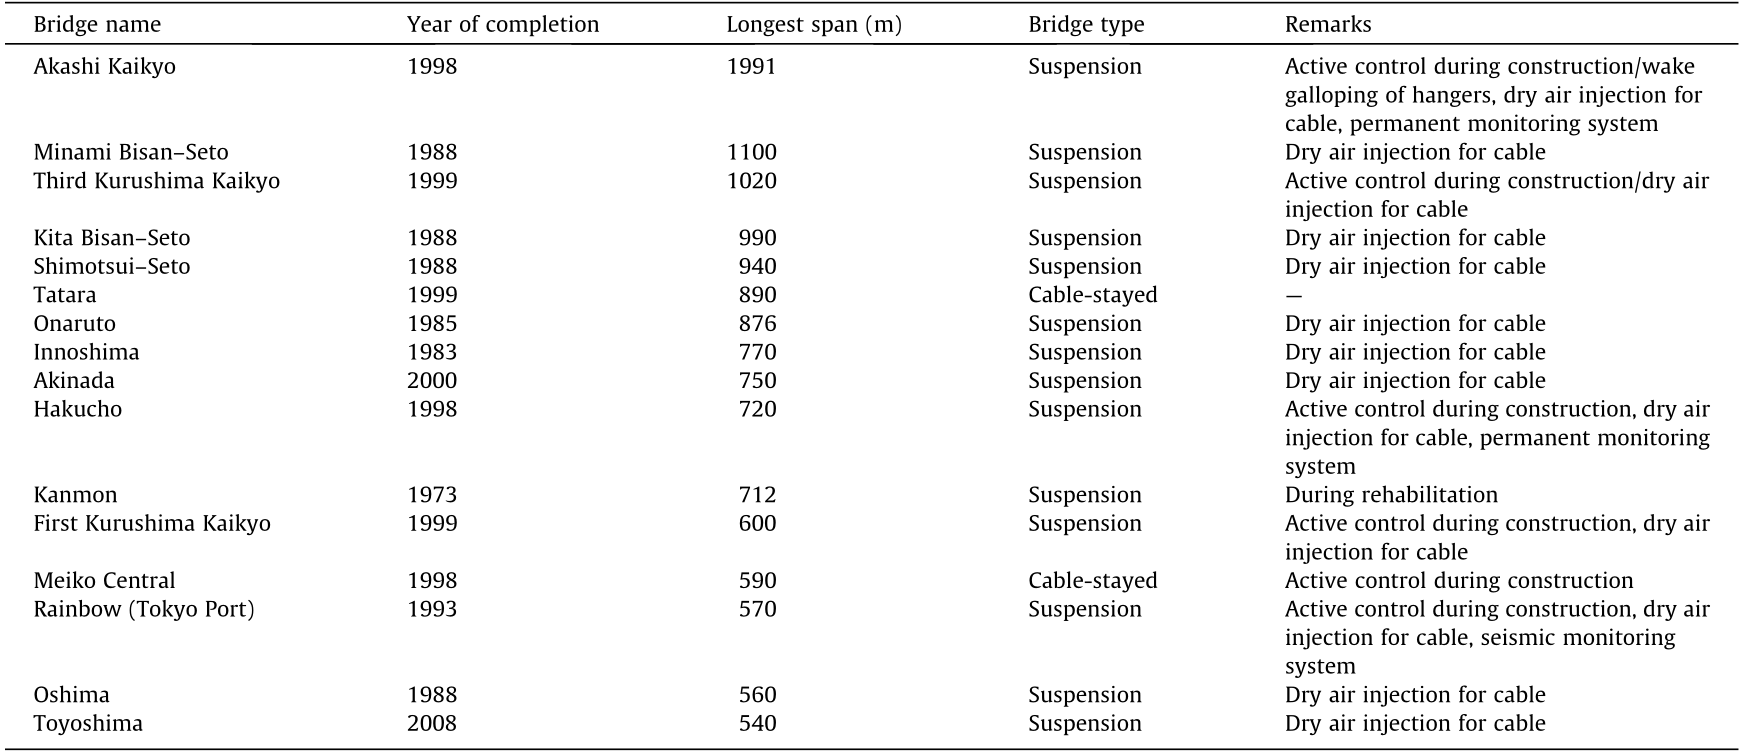
In an archipelago country such as Japan, long-span bridges are an essential element of transportation links to connect islands and circumvent bays. Long-span bridge construction commenced after the end of World War II, when Saikai Bridge, a 243.7 m steel arch bridge in Nagasaki, was completed in 1955. The construction of long-span bridges intensified rapidly afterward, and peaked during the Honshu–Shikoku Bridge Project (HSBP) [3,4]. The HSBP is a national project that was carried out between 1975 and 1999 to link the Honshu and Shikoku Islands. The links comprise major long-span bridges, with the Akashi Kaikyo Bridge as the longest suspension bridge and the Tatara Bridge as the longest cablestayed bridge [5]. At present, there are 15 suspension bridges, three cable-stayed bridges, and one truss bridge in Japan with spans greater than 500 m. A part of these bridges are listed in Table 1 [6].
《Table 1》
Table 1 Bridges in Japan with a longest span over 500 m and special control or maintenance features.
In 1964, Tokyo was selected to host the Summer Olympics, which marked the start of a construction boom in Japan. This event transformed major cities with new infrastructure development after their successful emergence from the postwar period of basic reconstruction. Technological developments in structural engineering were remarkable in the 1970s–1990s, especially in the area of seismic/wind design and construction. Until the 1960s, regulations regarding earthquake resistance were prohibitive for the construction of high-rise buildings. It was not until 1968 that the first high-rise office tower was constructed. The 147 m, 36-story Kasumigaseki Building was completed in 1968 as a modern office high-rise building in Tokyo, remarkably ending the perception that tall buildings were unfitting for Japan and other earthquake-prone regions. Since then, many more tall buildings have been constructed in urban areas, and the number of buildings with heights exceeding 200 m has now reached more than 40.
For many years, the highest building in Japan was the Yokohama Landmark Tower, an office and shopping complex with a height of 296 m that was built in 1993. In 2014, a new building complex of offices and a shopping center named Abeno Harukas was completed with an overall height of 300 m [7]. This is currently the tallest occupied building in Japan. Meanwhile, the tallest structure in Japan is now the Tokyo Sky Tree (a broadcasting, restaurant, and observation tower), which was built in 2012 with a height of 634 m.
Civil structures have an important characteristic that differentiates them from other industrial products. Each structure is unique from others. They are designed according to different local geographical and geological conditions and are built from different construction materials using different construction technologies. None of the civil structures are exactly the same; they are very different from mass-produced goods. Another important characteristic is that civil structures are built as assets of society, and are expected to function for a long time. The lifetime of structures is generally long, and can be on the order of hundreds of years for some. Therefore, it is essential to ensure that the built infrastructure satisfies the design requirements and design assumptions. It is also important to examine the condition of the actual structure in order to ensure high durability and a long service life. From another perspective, developments in the design and construction of long-span bridges and tall buildings have always involved sophisticated models, analysis, and advanced technologies. The uncertainties associated with these new models, analysis, and technologies must be quantified and monitored to ensure the correctness and efficacy of their application. For these purposes, longterm or short-term campaign-type structural monitoring has been conducted in large and important structures, and very valuable information has been obtained [8].
Structural monitoring in general covers many aspects and methodologies. In this paper, however, we emphasize the application of structural monitoring to bridges, buildings, and roadway pavement using vibration techniques. Vibration is used as a measure in structural monitoring because the vibration response represents both the global and local performance of a structure. Vibration-based monitoring is an important work in the advancement of research on earthquake- and wind-resistant structures. In relation to seismic monitoring, the Japan Meteorological Agency (JMA) has conducted seismic motion observation, mainly with displacement seismographs. However, acceleration records are more convenient than displacement records for research on earthquake-resistant structures, because accelerations become direct input motions to a structure in its equation of motion. In addition, conventional seismographs might record vibrations with saturated amplitudes during large earthquakes.
The development of strong-motion instruments in Japan began after the 1948 Fukui Earthquake (see Table 2 for detailed information on the earthquakes discussed in this paper), which was a large and damaging inland earthquake. In 1953, the Strong-Motion Accelerometer Committee (SMAC) developed the SMAC accelerometer (named after the committee) [9]. The SMAC accelerometer is an analog device that can record triaxial accelerations up to 1 g (g = 9.8 m·s-2 ). A total of 25 SMAC accelerometers were installed in buildings in 1956, marking the start of earthquake-induced response monitoring of structures in Japan. By 1975, about a thousand SMAC accelerometers had been installed in Japan [10]. The installations acquired valuable earthquake measurements during events such as the 1964 Niigata Earthquake, the 1968 Tokachi-oki Earthquake, and the 1978 Miyagi-oki Earthquake. Some lessons learned from these measurements have been utilized for the design of tall buildings in Japan.
《Table 2》
Table 2 List of the earthquakes mentioned in this paper.

Mw : moment magnitude.
Since the late 1980s, the SMAC seismograph system has been considered outdated. New types of accelerometers were developed with the advancement of information technology and digital recording. Modern accelerometers are now often of the small micro-electromechanical systems (MEMSs) type. More recently, wireless sensor networks have been under very active research and development. Applications for the practical use of wireless sensor networks for structural monitoring in Japan have been demonstrated in several studies [11,12]. There are two issues in the application of wireless sensor networks: the robustness of wireless communication and the reduction of power consumption. More development in these aspects is expected in future.
During their development, the data accumulated from vibration-based structural monitoring systems has been used in many ways, including monitoring structure behavior during extreme events and providing feedback for the redevelopment of design and new construction. As longer bridges and taller buildings were increasingly built in the 1990s, structural monitoring systems were supplemented into the construction process and vibration control became more common for large structures. As structures become more advanced and more monitoring systems are implemented, data accumulates on structures’ behavior under various environmental and loading conditions. This data can be used to evaluate structural condition, indicate possible damage, and facilitate decision-making on repair and/or retrofit. Monitoring data can also be used to support the maintenance and management of structures.
In this paper, we provide a review on the structural monitoring strategies and practices of civil structures with an emphasis on research works and implementations in Japan and on the authors’ experiences. Some new and unexpected findings from the vibration monitoring data of real bridges and buildings are reported in order to emphasize the importance of monitoring. This paper consists of two main sections that address the monitoring of bridge structures and building structures, respectively; the monitoring cases in each section are divided based on the type, strategy, and purpose.
《2. Monitoring of bridge structures》
2. Monitoring of bridge structures
《2.1. Monitoring for the design verification of long-span bridges》
2.1. Monitoring for the design verification of long-span bridges
Dynamic performance is an important consideration in the design of long-span bridges. Because of their flexibility and low damping, various types of vibration may occur during the lifetime of a long-span bridge. Aerodynamic stability and seismic response are the main concerns in design; hence, dynamic tests during the design phase and after the completion of construction are common in the early stages of the development of long-span bridges in Japan. In some cases, monitoring systems are installed during construction and remained in place for several years after construction completion. The data from this type of monitoring has been utilized to confirm design assumptions regarding seismic and wind loads. In the following section, we describe several research works related to monitoring for the design verification of loading and structural response against wind and earthquakes.
2.1.1. Monitoring for wind-induced design verification
During the initial development of long-span bridges in Japan, issues associated with the quantification of forces—especially wind loading—were significant in the design process. Limited past experiences and large uncertainties within design assumptions made verification in scaled experimental testing an important design step. From 1973 to 1975, a one-tenth sectional bridge girder model was constructed for the HSBP, which includes the Akashi Kaikyo Bridge, in order to verify the wind-resistant design method. The truss-stiffening girder with a length of approximately 8 m was tested in natural wind (Fig. 1). The measured drag coefficients were in agreement with the estimation based upon wind tunnel testing [13].
《Fig. 1》
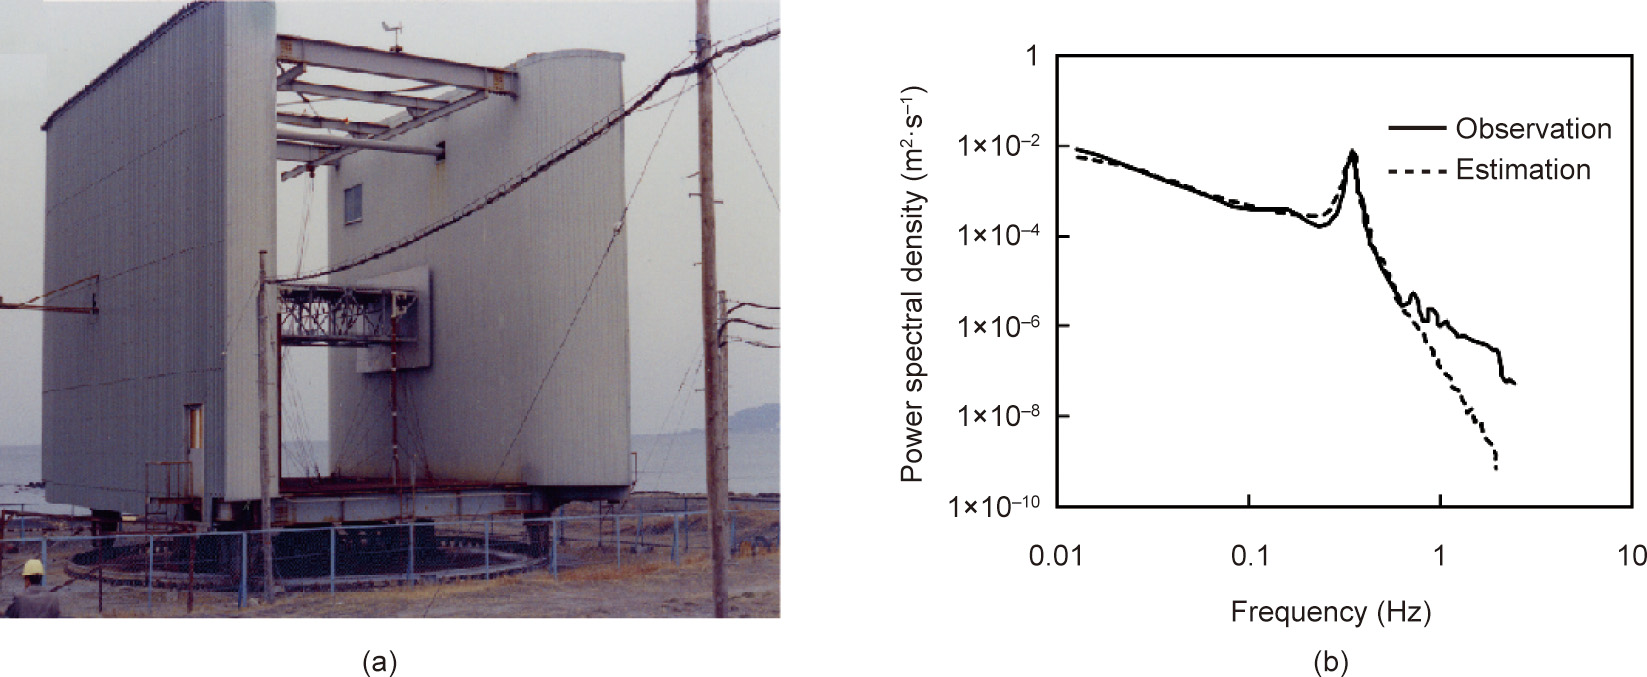
Fig. 1. (a) Large-scale bridge model (courtesy of the Honshu–Shikoku Bridge Authority); (b) comparison between in situ model response (observation) and estimation based on wind tunnel experiment (average wind speed 12.6 m·s-1 , elevation 0°).
This attempt during an earlier stage of bridge design eventually developed into the use of permanent measurement installation for monitoring during the service life of a bridge, with advances in sensor technology and information systems. For example, Fig. 2 [14,15] shows the instrumentation at the Akashi Kaikyo Bridge at the time of completion [16]. This figure shows an example of the relationship between average wind speed and lateral displacement, as measured by global positioning system (GPS). Displacement of the bridge can be measured with reasonable accuracy by GPS due to the prominent length of the bridge span. The observed values are close to the design average values and the maximum values are conservative, with a reasonable margin [17]. In addition, the measured data of the power spectrum, turbulence intensity, and spatial correlation of natural wind at various long-span bridges in the HSBP has been studied and verified against the design assumptions and has been found to be within reasonable conservative margins [14,15].
《Fig. 2》
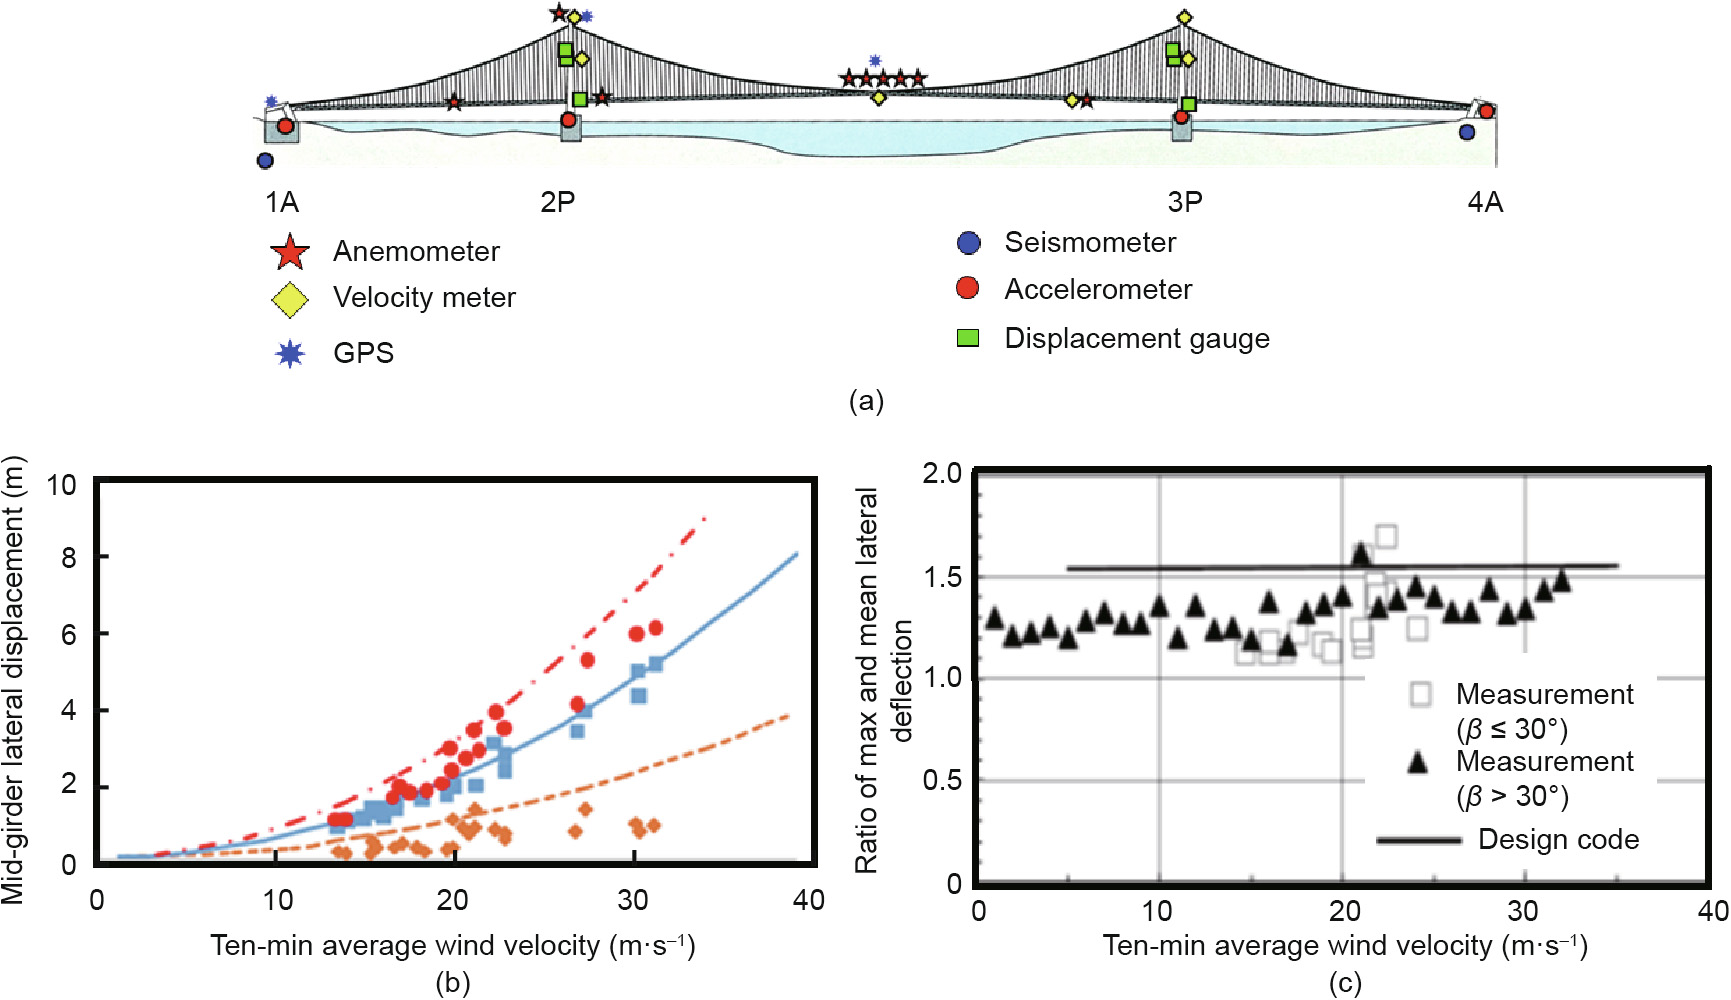
Fig. 2. (a) Akashi Kaikyo Bridge monitoring system; (b) relationship between ten-min average wind velocity and mid-girder lateral displacement at the Akashi Kaikyo Bridge; (c) comparison between measurement and design code (courtesy of the Honshu–Shikoku Bridge Authority). 1A and 4A refer to anchorages; 2P and 3P refer to main pylons; β is wind skew angle (i.e. angle between oncoming wind with respect to the normal of the bridge axis. Reproduced from Ref. [14] with permission of J-STAGE, © 2010 and from Ref. [15] with permission of J-STAGE, © 2006.
Wind tunnel experiments are commonly performed using a sectional model in order to determine the aerodynamic stiffness and damping. The variations of factors with respect to wind velocity are known from the wind tunnel test, but are rarely confirmed from full-scale testing of completed long-span bridges. In an effort to understand and confirm the aerodynamic stiffness and damping, structural monitoring using wind-induced responses was carried out at the Hakucho Bridge—a three-span suspension bridge with a total length of 1380 m (330 m + 720 m + 330 m) (Fig. 3). After the construction was completed, and before being opened to traffic in 1998, the bridge was densely instrumented, with accelerometers placed every 30–55 m. The wind-induced structural responses were recorded for several weeks for a wide range of wind velocities.
《Fig. 3》

Fig. 3. (a) Hakucho Bridge and (b) campaign-type sensors layout for ambient vibration measurement (Z1–Z19 denote the locations of sensors). Identified change in: (c) aerodynamic damping and stiffness with respect to wind velocity; (d) damping and stiffness due to friction force with respect to wind velocity. Reproduced from Ref. [18] with permission of American Society of Civil Engineers, © 2005 and from Ref. [19] with permission of Elsevier Ltd., © 2007.
Structural performance during ambient vibration and strong wind was evaluated using inverse analysis [18,19]. The results showed that in general, the natural frequencies decrease as the wind velocities increase, while the damping ratios increase as the wind velocities increase. The contributions of aerodynamic and friction forces with respect to wind velocity were quantified. The results suggested that the contribution of aerodynamic force was much smaller than the effect of friction force at the bearing. The aerodynamic force’s contribution was about one percent of the friction force, and its behavior agreed with that of the aerodynamic forces obtained from wind tunnel results (Fig. 3(c)). These findings, to authors’ knowledge is the first attempt to clarify and compare the aerodynamic forces obtained from a wind tunnel with the results of full-scale monitoring of a long-span bridge in the world.
In addition, the locality effect of the phase difference concentrated mainly at the edge of the girders was observed. This finding can be used to determine the contribution of additional damping and stiffness caused by friction force at the bearings (Fig. 3(d)). The damping and stiffness due to friction force at the bearings display clear trends; namely, low damping and high stiffness during small vibration. When the wind speed increases, the damping also increases, which is when the bearings become unstuck, whereas the stiffness decreases due to the increasing flexibility of the structure. Detailed explanation on the effect of wind speed on stiffness and damping are given in Ref. [18]. The influence of additional stiffness and damping due to the friction force at the bearings was also observed from long-term seismic monitoring of the bridge, as reported in Ref. [20].
2.1.2. Monitoring for seismic design verification
Seismic responses obtained from structural monitoring have been used to verify seismic design. One example of such a case is the Tatara Bridge (Fig. 4), the longest cable-stayed bridge in Japan, which was strongly excited by the 2001 Geiyo (near Hiroshima) Earthquake (moment magnitude Mw = 6.7). The maximum ground acceleration at the bridge site was 144 cm·s-2 . Observation of the seismic responses revealed that the actual seismic load in terms of the response spectra calculated from the recorded ground motion was below the design specification. The seismic behavior of the bridge was studied by means of simulation analysis in order to verify the structural model and assumptions. The simulation results were found to be in good agreement with the observed responses [21].
《Fig. 4》

Fig. 4. (a) Tatara Bridge; (b) comparison between design spectra and observed response spectra in the 2001 Geiyo (near Hiroshima) Earthquake; (c) Tatara Bridge monitoring system (unit: m) (courtesy of the Honshu–Shikoku Bridge Authority). EW: east–west; NS: north–south; V: vertical. P1, P2, P3, and P4 are the piers.
An important engineering problem in the seismic analysis of long-span bridges is the spatial variation of seismic ground motions. This variation is a result of the time lag of seismic wave propagation, since the foundations of long-span bridges are separated by the long span. One such analysis was performed on Onaruto Bridge using observed responses during the 1995 Great Hanshin (Kobe area) Earthquake (Mw = 6.9). The study revealed that the spatial variation of the ground motions increased the vertical response of the girder [22]. A similar tendency of the increase of the vertical girder response was observed at other long-span bridges, including the Akinada Bridge during the 2001 Geiyo (near Hiroshima) Earthquake [23].
Also observed during the 2001 Geiyo (near Hiroshima) Earthquake was the failure of the First Kurushima Kaikyo Bridge [24]. The observed seismic ground motion was applied to a dynamic three-dimensional finite element analysis, and it was verified that the failed center stay rods performed as they had been designed. Reanalysis of observed data from extreme events can provide valuable information for verifying and updating the design.
Another important case of design verification is the estimation of the appropriate damping values and mechanisms. Estimation of damping values and mechanisms is quite difficult due to the complexity of the mechanisms involved and the sensitivity of the estimated values to excitation conditions. Nevertheless, some studies have used the seismic records of instrumented long-span bridges to clarify damping mechanisms and estimate the values. For example, Kawashima et al. [25,26] utilized seismic records from over 33 earthquakes on the Suigo Bridge—a 290.45 m long steel box-girder two-span continuous cable-stayed bridge—to clarify the damping characteristics of the tower and deck. It was found that the damping ratio correlated with the measured accelerations, depending on the structural components and the direction of the excitations.
At the Tsurumi Tsubasa Bridge, strong motion observation was performed starting from the opening of the bridge, and several records of significant earthquakes have been obtained. During the 23 October 2004 Chuetsu-Niigata (Niigata Prefecture) Earthquake, the records show that vibration continued for a long time, indicating that the damping in the response displacement amplitude was small [27]. Based on seismic records from ten earthquakes on the Yokohama Bay Bridge, it was found that the damping ratios for lower modes in both the vertical and lateral direction have an increasing trend with an increase in earthquake magnitude [28]. For a small earthquake magnitude, the average damping ratios are found to be 2%; these increase significantly, up to 4%–5%, as the earthquake magnitude increases, resulting in a larger value than the previously suggested 2%.
《2.2. Bridge monitoring for the verification of seismic isolation system performance》
2.2. Bridge monitoring for the verification of seismic isolation system performance
Seismic protective technology using isolation has been implemented on bridges in Japan for over 30 years. The first seismically isolated bridge in Japan was the Miyagawa Bridge. The bridge girder is a three-span continuous non-composite steel girder with a length of 105.8 m. Located in Haruno-cho, Shizuoka Prefecture, the bridge was opened in March 1991 and was one of eight bridges selected from across the country for the pilot construction project of a base-isolation system. Lead rubber bearings (LRBs) were adopted as a seismic isolation device. To examine the earthquake response characteristics of the seismic isolation bridge, strongmotion accelerometers were installed on the Miyagawa Bridge at the pier cap, girder, and free-field. On April 25, 1992, an earthquake with a magnitude of 4.9 on the JMA scale was recorded, with the earthquake epicenter in Shizuoka. These were the first seismic records from the monitoring system of a seismically isolated bridge in Japan. Analysis of the records helped to confirm some important aspects that had been adopted in the design of the base-isolated bridge [29].
The following section describes several case studies of the monitoring of seismically isolated bridges with short-medium spans and long spans. Just before the large 1995 Great Hanshin (Kobe area) Earthquake, base-isolation systems had been implemented on a few bridges in Japan, some of which were instrumented with seismic monitoring systems. The 1995 Great Hanshin (Kobe area) Earthquake was the first time that such base-isolation technologies experienced strong shaking. Structural monitoring systems for seismically isolated bridges were installed with the original objective of confirming the performance of the isolation system under seismic excitation. Since the isolation technique was considered to be new and advanced, it was necessary to verify the accuracy of the design procedure and models for such bridges with recorded responses obtained from actual events.
A detailed investigation on the performance of base-isolated bridges during a large earthquake was conducted on the Matsunohama Viaduct (Fig. 5) [30], an elevated bridge located on the Hanshin Expressway Bayshore Route in the Kansai area in the west of Japan. The bridge was opened in 1994 and was the first application of base-isolated bridges within the Hanshin Expressway. The viaduct is a four-span continuous steel box-girder bridge with a bridge length of 211.5 m and a curvilinear radius of 560 m. It is located about 35 km east–southeast from the epicenter of the 1995 Great Hanshin (Kobe area) Earthquake. The Matsunohama Viaduct has two base-isolated bridges: Bridge A and Bridge B. In a study by Chaudhary et al. [30], the performance of the isolation system during the 1995 Great Hanshin (Kobe area) Earthquake was investigated by means of a system identification method. The study showed that it was possible to capture the overall behavior of the base-isolated Matsunohama Viaduct bridges with simple equivalent linear, two degrees-of-freedom (2-DOF) lumped mass models. The study demonstrated that the base-isolation system performed satisfactorily because it effectively decoupled the superstructure from the substructure, such that the spectra of the girder contained only the dominant superstructure frequency and filtered out other frequencies.
《Fig. 5》
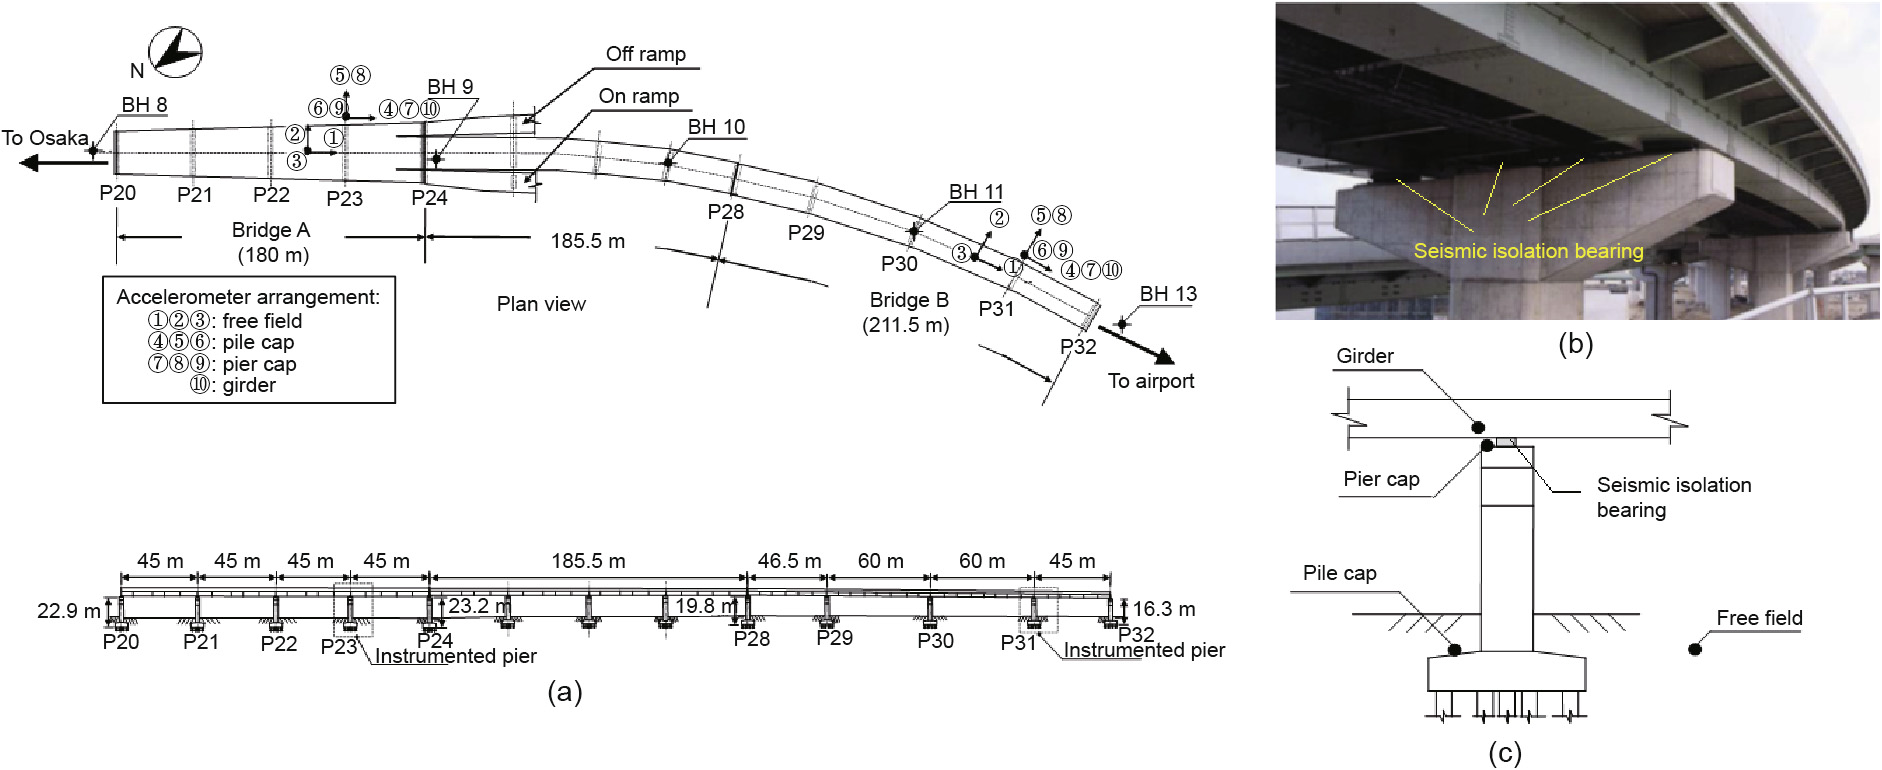
Fig. 5. Seismically isolated Matsunohama Viaduct. (a) General layout and strong-motion instrumentation; (b) photo of the bridge pier caps and seismic bearing; (c) location of sensors of the pier cap and girder. BH: bore hole. P20–P32 denote the location of piers. Reproduced from Ref. [30] with permission of American Society of Civil Engineers, © 2000.
Fig. 6 shows the results of observation from 1995 Great Hanshin (Kobe area) Earthquake main shock and aftershocks. It was observed that the natural frequencies decreased with increasing earthquake intensity for both bridges. The decrease in the first modal frequency was related to the reduction of the bearing stiffness as the seismic isolation functioned. The reduction in the second modal frequency was due to the reduction in stiffness of the substructure. The damping ratio of the first mode, which is associated with the isolator, was larger in Bridge B than in Bridge A. This difference was due to the properties of the isolation system that was employed in both bridges. A similar seismic monitoring system and response analysis was established and carried out for Yama-age Bridge, which was seismically isolated using highdamping rubber (HDR) bearings, and which was affected by the 1995 Great Hanshin (Kobe area) Earthquake. The performance of the isolation bearings identified from the actual earthquake reasonably agreed with the predicted performance based on loading testing conducted prior to installation within the possible range of modeling uncertainties—that is, the effect of friction [31].
《Fig. 6》
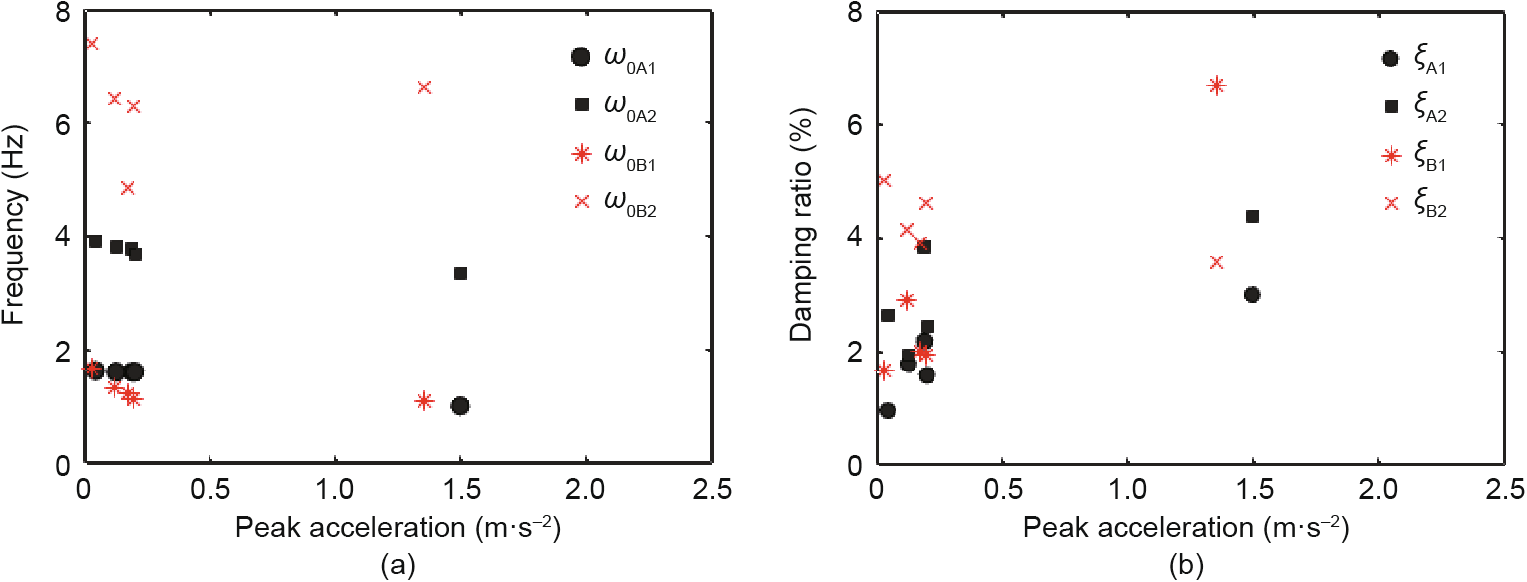
Fig. 6. Variation of modal parameters with earthquake intensity. (a) natural frequency ( ); (b) damping ratio (
 ). Subscripts A and B denote the Bridges A and B, respectively; while subscripts 1 and 2 denote the 1st and 2nd modes, respectively.
In both of the cases mentioned above, the performance of the isolation bearings was evaluated further by comparing the identified stiffness and damping coefficient with the equivalent linearized experimental values. Friction force caused by minor structural elements can affect the dynamic behavior of the superstructure and increase the modeling uncertainty considerably, which may degrade the effects of the base isolation. The influence of minor structural elements, as observed from this study, was utilized as feedback to improve the design of the seismic isolation system and its implementation on highway viaducts [32].
Based on the observations of the seismic responses of isolated bridges during the 1995 Great Hanshin (Kobe area) Earthquake, the seismic isolation system was considered to be more advantageous than the lateral force distribution structure using rubber bearings, because the damping performance reduced the response displacement to a greater extent. As a result, the use of seismic isolation systems increased significantly after the 1995 Great Hanshin (Kobe area) Earthquake. On the national highways administrated by the Japan’s Ministry of Land, Infrastructure and Transport and Tourism (MLIT), the seismic isolation design was adopted for about 120 bridges and 200 sections of newly constructed bridges. In addition, seismic isolation was applied to retrofit existing bridges [32].
Long-span bridges are more flexible than short- and mediumspan bridges. The seismic load of a long-span bridge is usually considered to be lower than the wind load. However, the inertia load caused by the superstructure of a long-span bridge can be significant due to the heavy weight of a long-span girder. Therefore, reducing the seismic load by further lengthening the natural periods is commonly explored by employing the isolation technique. This can be achieved by isolating a girder from the tower using a specially designed tower–girder connection system. However, while isolation minimizes the seismic load, unexpected excessive displacement due to flexibility may result. Therefore, treatment of excessive motion should be carefully considered for long-span bridge isolation.
Strategies for lengthening the natural period of a long-span bridge using a tower–girder connection have been used in some of the long-span cable-stayed bridges in Japan. For example, the Meiko Triton cable-stayed bridge in Nagoya utilizes an elastic cable connecting the main tower with the girders in the longitudinal direction in order to elongate the natural period to about 2–3 s. The Tsurumi Tsubasa Bridge in Yokohama adopts an elastic restriction cable system between the tower and girders, and uses a vanetype oil damper to control the motion. Another example is the Higashi-Kobe Bridge, in which a concept involving all-free movable supports in the longitudinal direction at all bearing supports at the towers and pier caps was adopted to lengthen the natural period. To improve the safety and increase damping, a vane-type oil damper was installed at the girder end [32].
Dense-array permanent seismic monitoring systems have been installed in several long-span bridges in Japan, including those that use a seismic isolation system. An example of such a monitoring system was deployed at the Yokohama Bay Bridge (Fig. 7). The bridge was constructed on soft soil, which is one example of a situation in which a special seismic isolation system may be needed. The bridge is located near an active fault and is close to the epicenter of the 1923 Great Kanto Earthquake. These conditions have made seismic performance a major concern. Therefore, to confirm the seismic design and to monitor the bridge performance during earthquakes, a comprehensive dense-array monitoring system was installed. The objectives of the monitoring system are to evaluate seismic performance, perform verification and comparison with the seismic design, and observe for possible damage. The analysis of the seismic records focused on the local component link–bearing connection (LBC), which is a seismic isolation device.
《Fig. 7》

Fig. 7. (a) Yokohama Bay Bridge and the layout of the permanent seismic monitoring system; (b) location of the link–bearing connections (LBCs) of Yokohama Bay Bridge; (c) typical LBC at the tower (left) and at the end pier caps (right). Two of the three typical first modes of the Yokohama Bay Bridge identified from earthquakes: (d) hinged–hinged mode; (e) fixed–fixed mode. S: sensor of girder; T: sensor on tower; K: sensor on foundation; B: sensor on end piers; G: sensor on ground; φ: relative modal displacement ratio (non-dimensional); R: right; L: left. Reproduced from Ref. [28] with permission of John Wiley & Sons, Inc., © 2005.
As part of its dynamic monitoring system, the bridge is equipped with 85 channels of accelerometers at 36 locations (Fig. 7). Seismic records with varying amplitudes obtained from six major earthquakes between 1990 and 1997 were analyzed to evaluate the global and local performance of the bridge [28,33]. System identification of a long-span bridge under seismic excitation requires the consideration of non-unique ground-excitation records measured along the bridge and excitation in multiple directions. An investigation of the performance of the bridge’s LBCs was primarily carried out by observing the first longitudinal mode, analyzing the response between the pier caps and girder, and conducting an analysis using a finite element model. Based on these analyses, the following findings were obtained (Fig. 7): ① System identification resulted in three typical first longitudinal modes that were different on the relative modal displacement between the end pier caps and girder. These modes are the hinged–hinged mode, the mixed hinged–fixed mode, and the fixed–fixed mode. The latter two modes are variations on what was the strongly expected mechanism (i.e., the hinged–hinged mode). The response analysis of the relative displacement between the end pier caps and girder confirmed these findings. ② The LBC has yet to function as a full-hinged connection during small earthquakes. Therefore, higher natural frequencies due to the stiffer connection were observed. The mixed hinged–fixed mode was observed during a moderate earthquake. Full-hinged connections at both of the end pier caps were mostly observed during large earthquakes.
《2.3. Bridge monitoring for the verification of a structural retrofit》
2.3. Bridge monitoring for the verification of a structural retrofit
After the 1995 Great Hanshin (Kobe area) Earthquake, a recommendation to reconstruct and repair the highway bridges that suffered damage from the earthquake was issued by the Ministry of Construction on 27 February 1995. The three-year retrofit program was completed in 1997. Other important bridges that were designed prior to the 1995 Great Hanshin (Kobe area) Earthquake were also retrofitted in subsequent years to meet the standards and specifications determined after the 1995 Great Hanshin (Kobe area) Earthquake. These included the three large cable-supported bridges of the Metropolitan Expressways: the Yokohama Bay Bridge, Rainbow Bridge, and Tsurumi Tsubasa Bridge [34].
Structural monitoring can provide insights into the retrofit process and can verify the efficiency of retrofit action. This has been the case for the Yokohama Bay Bridge, a cable-stayed bridge with a central span of 460 m that has been continuously monitored by a densely distributed sensor system since 1990. In 2005, a seismic retrofit program was implemented on the bridge for Level 2 earthquake safety assurance according to Japan’s bridge seismic code. The retrofit program considered two types of maximum credible earthquakes: magnitude 8 far-field or moderately far-field large earthquakes taking place in the subduction zone of the Pacific Plate and near-field inland earthquakes occurring beneath the site or close to the site.
The retrofit program utilized the previous monitoring results and simulations of identified potential damage for both types of ground motion, and concluded that significant damage would occur on the towers and bearings under such excitations. Furthermore, the far-field ground motion would create more damage and induce 1.5 m longitudinal displacement of the girder. Accordingly, five retrofit strategies and a fail-safe design concept were introduced [34].
As explained in the previous section, it was realized from the seismic monitoring of the Yokohama Bay Bridge that there is a possibility that the LBCs may not function properly during a large earthquake. In such a case, an excessive moment at the bottom of the end pier cap may result, and the LBCs may fail and create uplift deformation at the girder. To prevent such conditions, a seismic retrofit of the bridge was conducted and a fail-safe scenario was provided. The seismic retrofit of the bridge, which was performed in 2005, employed a fail-safe design in which the girder ends are connected to the footing using pre-stressed cables to prevent uplift of the girder end, as shown schematically in Fig. 8 [35].
《Fig. 8》

Fig. 8. (a) Photos and (b) schematic figure of a fail-safe design system using pre-stressed cables that connect the girder end and the ground to prevent uplift at the Yokohama Bay Bridge [35].
《2.4. Bridge monitoring for the verification of structural control systems》
2.4. Bridge monitoring for the verification of structural control systems
Vibration control is commonly applied to long-span bridges in order to suppress wind-induced vibration. Conventional methods are passive vibration control (e.g., oil dampers for girder motion) and tuned mass dampers for tower oscillation. As structures become larger and more flexible, greater capacity is required for control devices, and active control—which introduces an artificial external force to suppress vibration—becomes an attractive option. Because active control naturally requires measurement in order to modulate the control force, monitoring forms the basis of this new technology.
From a practical standpoint, active control is considered to be superior to passive devices when: ① multiple vibration modes are present; ② natural frequencies change, as is typically observed during construction; and ③ installation space is limited, so compact devices are preferred. These three conditions apply to flexible long-span bridges, especially during the construction stage. Hakucho Bridge is one of the bridges that was actively controlled during construction. A pendulum-type control device, shown in Fig. 9(a), was installed near the top of the tower, as illustrated in Fig. 9(b) [36]. This system is a so-called “hybrid” system, which incorporates both passive control effects provided by the pendulum motion and an active control force provided by a rack and pinion with electric motors.
《Fig. 9》

Fig. 9. Vibration control system of Hakucho Bridge tower. (a) Pendulum-type control device; (b) location of installation at Hakucho Bridge tower (unit: mm). T.P: height.
Monitoring is also important to ensure that the control systems deployed on long-span bridges function as intended, and to provide feedback on the efficacy of the control system performance. Table 1 lists a few long-span bridges for which active control was applied during construction.
《2.5. Bridge monitoring during extreme events》
2.5. Bridge monitoring during extreme events
Compared with other developed regions in the world, such as Europe and North America, Japan is widely known as a country that is prone to natural disasters. The high intensity of seismic activity and the frequent occurrence of seasonal strong winds and typhoons have made evaluation against such extreme events the focus of structural monitoring in Japan. After verifying assumptions related to the initial design, retrofit, and structural control performance, a bridge monitoring system is implemented to monitor the structural performance during extreme events and to determine their effects on the structures. Monitoring of structural performance during extreme events has two main purposes: ① to test the appropriateness or limitations of the design assumptions during extreme loading conditions, and ② to observe the possibility of new structural behaviors that were not considered in the design. Both purposes are very useful as feedback for the improvement of future structural designs. The following sections describe cases involving two main extreme events: strong winds or typhoons, and large earthquakes.
2.5.1. Bridge monitoring during strong winds and typhoons
The number of typhoons that hit Japan varies per year; however, on average, about 11 typhoons make landfall in Japan every year. The typhoon season typically starts in summer—in August— and can bring heavy rainfall and strong devastating winds. Several strong typhoons have caused heavy casualties and damaged civil infrastructures. The monitoring of infrastructure such as longspan bridges during strong wind and typhoon events is important, not only to provide assurance of bridge performance, but also to give insight into actual structural behavior and unexpected phenomena that may require special treatment, as feedback for future design. Some important case studies are explained below.
At the Akashi Kaikyo Bridge, two strong typhoons passed through about two and a half years after its opening. The bridge’s structural monitoring system recorded the wind and bridge response during Typhoon Vicky (7th typhoon of 1998) and Typhoon Bart (18th typhoon of 1999). (See Table 3 for detailed information on the typhoons mentioned in this paper.) Miyata et al. [15] conducted an analysis of the full-scale recorded data with a focus on the power spectral density (PSD), spatial correlation of the wind-speed fluctuation, and response of the deck. This was the first opportunity to evaluate the response of such a long-span bridge under actual strong wind conditions, and the study notes that actual static lateral deflections of the deck in the middle of the center span agreed well with the analytical value (Fig. 10).
《Table 3》
Table 3 List of typhoons mentioned in this paper.

《Fig. 10》

Fig. 10. Lateral displacement measured at the middle of a girder of the Akashi Kaikyo Bridge during Typhoon Vicky (7th typhoon of 1998) and Typhoon Bart (18th typhoon of 1999). Girder lateral displacement with respect to (a) time and (b) wind velocity during Typhoon Vicky (7th typhoon of 1998), and to (c) time and (d) wind velocity during Typhoon Bart (18th typhoon of 1999).
In estimating the wind-induced responses of a very long span bridge, estimation of the spatial correlation (coherence) of windspeed fluctuations is essential. The spatial correlation (coherence) of wind-speed fluctuations with respect to reduced wind velocity is conventionally expressed by an exponential function known as Davenport’s equation:  ; where k is the decay factor, f is the frequency,
  is the distance of two points, and U is the mean wind speed. The wind-resistant design code of the Akashi Kaikyo Bridge specifies Davenport’s equation with k = 8 as the design standard. Analysis of the typhoon-induced data revealed that the measured coherence values were smaller than what suggested by the exponential function especially in a low-frequency region. An alternative formula using the Gamma and Bessel Functions was later proposed to describe the coherence [15].
Along with deck and tower vibration monitoring, the parallel hanger ropes of the Akashi Kaikyo Bridge were also monitored. Parallel hanger ropes are essential part of the suspension system that connect the girder to the main cables. Wake-induced vibrations were frequently observed on the leeward hanger ropes, and particularly excessive vibration was recorded during Typhoons Vicki and Bart, which damaged the HDR dampers that had been installed to suppress the vortex-induced vibration of these ropes. Visual inspection by means of video and wind monitoring data was utilized to investigate the occurrences of wake-induced vibration, and countermeasures by means of helical wires attachment were implemented in order to modify the aerodynamic properties of the hanger ropes [37].
Large-amplitude stay-cable vibrations were observed during the construction of the 405 m main-span Meiko West Bridge. Numerous observations by means of visual and vibration monitoring systems revealed that the phenomenon only occurs during the simultaneous occurrence of strong wind and rain [38]. During rain and within a certain range of wind velocity, large vibration occurs on the inclined stay cables with an amplitude that is up to ten times greater than the cable diameter and that involves not only the first but also higher modes. This vibration is considered to be a new type, since it has unique characteristics and a mechanism that cannot be explained by classical vibration mechanisms such as vortex-induced or wake-interference vibration. It is now widely known as the “rain-and-wind-induced vibration” (RWIV).
The excitation mechanism of RWIV has been the subject of many studies; however, understanding the actual mechanism is very challenging, considering that the phenomenon involves not only wind and cable characteristics, but also flowing liquid on a bluff body. Yamaguchi [39] was among the first to propose a model that explains this phenomenon, in which the vibration mechanism is explained in two steps. Initially, during rain, water rivulets form on the cable surface. These later alter the geometrical cross-section of the cable and the related aerodynamic forces. The rivulet tends to give a negative slope of the lift force for the small change in the angle of attack, and thus significantly reduces the drag force. These combined effects result in the Den Hartog type of galloping instability.
Observations from many long-span cable-stayed bridges confirm similar RWIV, including observations from Aratsu Bridge and Tempozan Bridge in Japan and from other bridges around the world (a complete list of these observations in provided in Ref. [40]). In the long-term, the vibration can cause a fatigue problem in the stay cable and damage to the cable anchorage. Numerous experimental and analytical studies have been conducted to identify countermeasures to this vibration, and it can now be effectively suppressed, either by mechanical control of cables or by surface treatment of cables.
To investigate the cause of failure associated with extreme wind loading, monitoring is of critical importance, since fluid–structure interaction may trigger rare phenomena that cannot easily be recreated at wind tunnels. For example, unexpected along-wind vibration of the Hakucho Bridge tower that was observed from monitoring data during four strong wind and typhoon events between 1999 and 2011 was studied with an emphasis on the tower’s single-frequency large vibration [41]. The bridge has a permanent wind and seismic monitoring system that consists of 27 channels of vibration sensors placed in 14 locations. The sensors include 22 uniaxial accelerometer channels, two uniaxial displacement sensors, and a triaxial free-field strong-motion accelerometer (Fig. 11(a)). To monitor the velocity and direction of the wind, two ultrasonic anemometers (DA-600; Kaijo Denki, Japan) have been installed in the middle of the center span and on the top of the north tower, respectively (F1 and F2 in Fig. 11(a)). All sensors measure the response simultaneously, and the data is recorded every ten min with a sampling frequency of 20 Hz.
《Fig. 11》
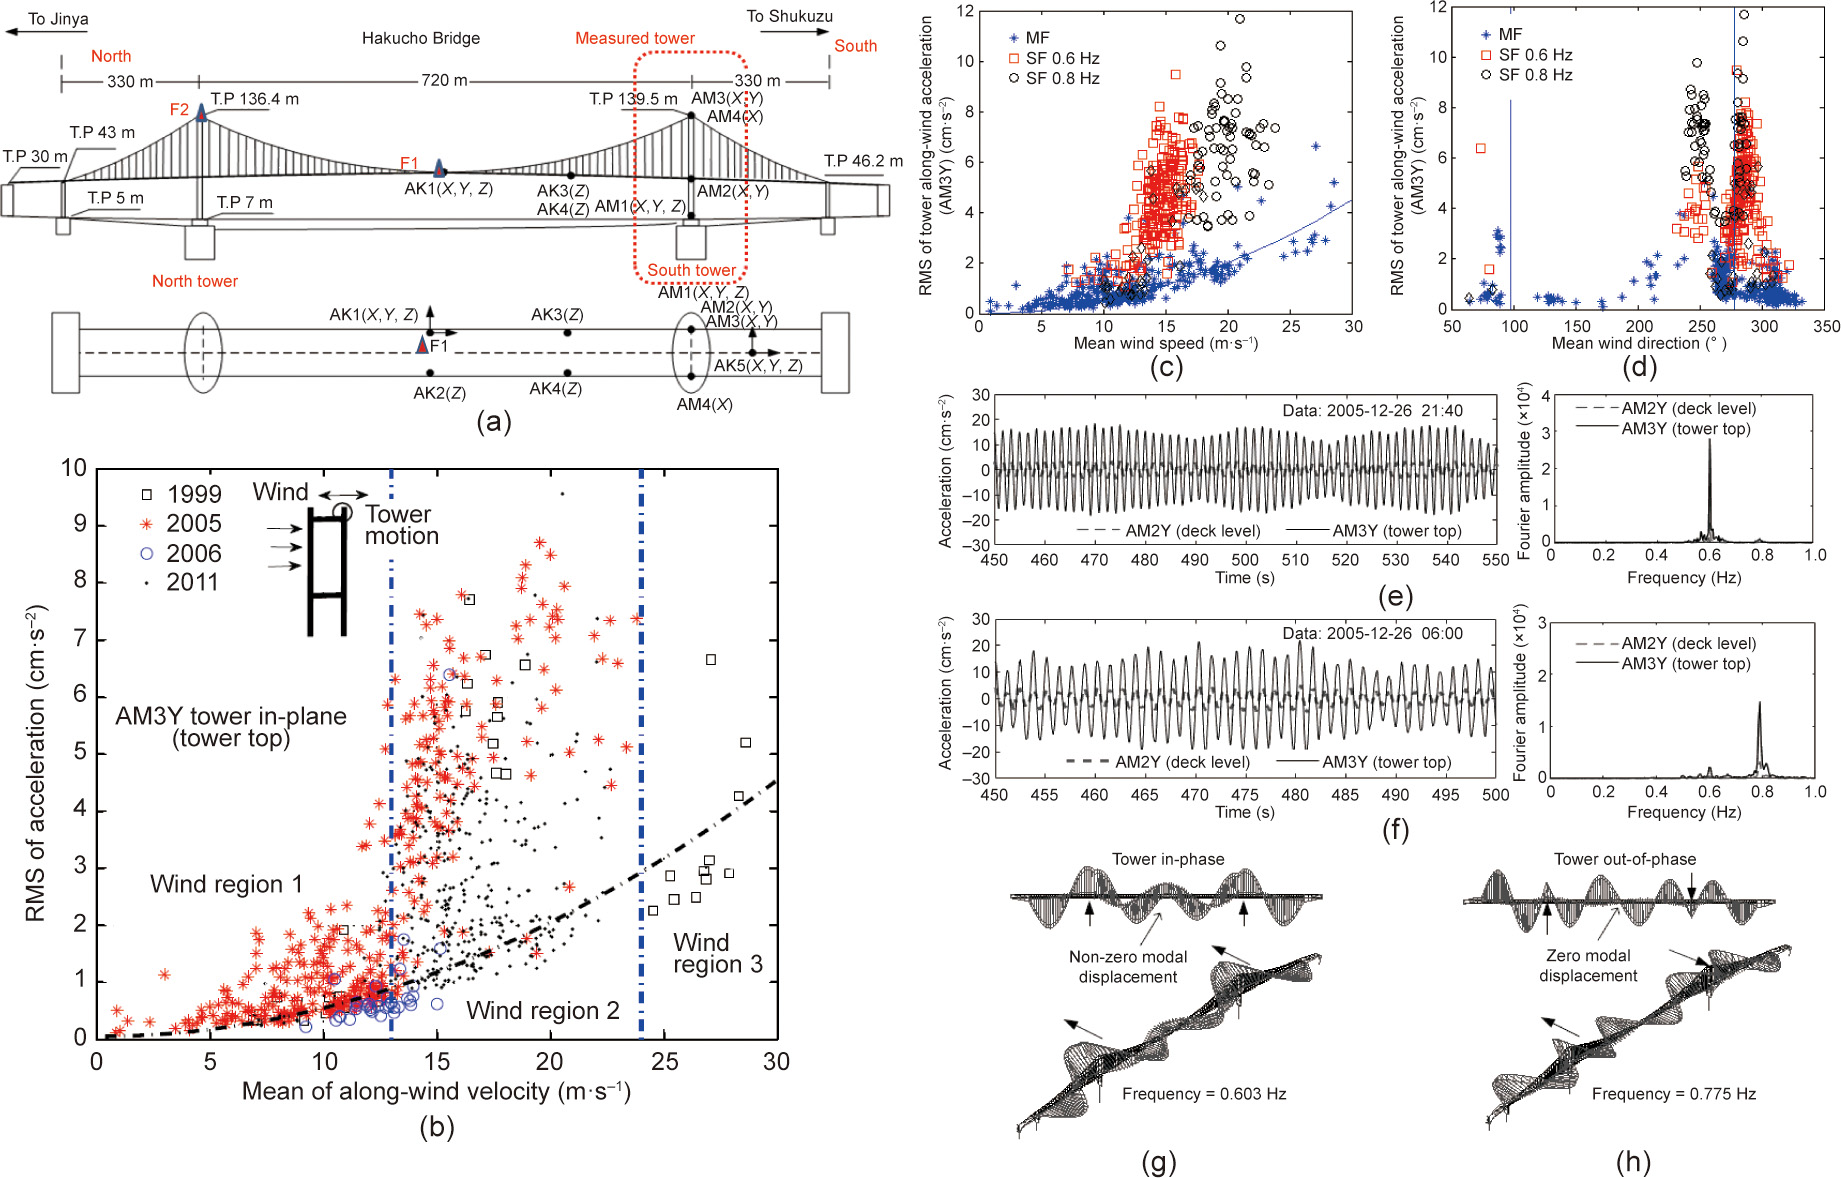
Fig. 11. Along-wind vortex-induced vibration on the Hakucho Bridge tower. (a) permanent monitoring system at Hakucho Bridge (AM and AK denote the location of accelerometers on the tower and girder, respectively; F denotes the location of anemometer); (b) relationship between the root mean square (RMS) of the tower in-plane acceleration with respect to the mean wind velocity measured at the tower top observed during four strong wind events; (c) relationship between the observed phenomenon and the wind speed; (d) relationship between the observed phenomenon and the wind direction (where MF denotes multiple frequency, SF = single frequency); (e) example of the tower in-plane vibration with a single frequency of 0.6 Hz recorded from a strong wind event on 26 December 2005 (left) and its frequency spectrum Fourier amplitude (right); (f) example of the tower in-plane vibration with a single frequency of 0.8 Hz recorded from a strong wind event on 26 December 2005 (right) and its frequency spectrum Fourier amplitude (left). Two tower local modes generated by finite element model analysis: (g) the tower in-phase mode at 0.603 Hz; (h) the tower out-of-phase mode at 0.775 Hz [41].
Long-term wind-induced vibration monitoring recorded significant tower vibration under strong wind events in four different years, namely: March 1999 (March 6 and 22), December 2005 (December 25–28), 2006 (June 29 and July 12), and November 2011 (November 20–22). During these events, single-frequency along-wind oscillation was observed on the leeward leg of the 132 m H-shaped steel tower of the bridge. The oscillation occurred at a wind velocity range of 13–24 m·s-1 , and only at a certain angle of attack (Figs. 11(c) and (d)). Two dominant single-frequency oscillations—namely, 0.6 Hz and 0.8 Hz—were observed, and these had characteristics resembling the vortex-induced vibration shown in Figs. 11(e) and (f). The single-frequency oscillations of 0.6 Hz and 0.8 Hz were related to the tower’s local in-phase and out-of-phase modes, respectively. Outside the wind velocity range of 13–24 m·s-1 , or when the wind direction was perpendicular to the tower, the tower responses were mainly characterized by random responses with a buffeting trend. The single-frequency tower oscillation substantially increased the girder lateral vibrations, due to the coupling of the tower and girder lateral vibrations.
To clarify the vibration mechanism, a detailed study using finite element analyses and wind tunnel experiments was conducted in addition to an analysis of the monitoring data [41,42]. The finite element analyses showed that the single-frequency oscillation at 0.6 Hz corresponded to the tower’s local in-plane in-phase mode (Fig. 11(g)), while the oscillation at 0.8 Hz corresponded to the tower’s local in-plane out-of-phase mode (Fig. 11(h)). These two modes are tower-dominant modes, with a small motion participation from the other components such as girder and cable.
A wind tunnel experiment using a 1:20 scale model was carried out to investigate the phenomenon under various wind velocities and angles of attack. The results show that the bluff body of the windward tower generated vortex shedding, as indicated by the presence of single-frequency dominant oscillation in front of the leeward tower. The vortex shedding created a periodic force toward the leeward leg. In the wind velocity range of 13–17 m·s-1 with an angle of attack of 291° and in the range of 17–24 m·s-1 with an angle of attack of 248°, the vortex shedding frequency coincided with the tower’s natural frequency of 0.6 and 0.8 Hz, respectively, causing the tower to resonate in the along-wind direction.
Vortex-induced vibration of a long-span bridge tower is not uncommon during the freestanding construction stage, but its occurrence on a tower of a completed bridge—especially on its strong axis—is very rare. Although the displacement amplitude of the tower’s vortex-induced vibration was relatively small and thus did not cause an immediate significant problem, the use of monitoring data has shown that this type of vibration still appears, despite the presence of a cross-sectional corner cut as a countermeasure. These findings can provide feedback to improve the design of a bridge tower shape against vortex-induced vibration.
2.5.2. Bridge monitoring during large earthquakes
Several large earthquakes in Japan have significantly influenced the bridge design code and practice. Among these are the 1995 Great Hanshin (Kobe area) Earthquake and the 2011 Great East Japan (Tohoku) Earthquake. The 1995 Great Hanshin (Kobe area) Earthquake affected several long-span bridges in the Kansai area. Some of these bridges were instrumented with a monitoring system, and important seismic records were obtained. Notable records were obtained from the Akashi Kaikyo Bridge, which was still under construction [43]; the Minami Bisan–Seto Bridge and Hitsuishi Bridge along the Kojima–Sakaide Route of the Honshu–Shikoku Bridge [44,45]; and the Higashi-Kobe Bridge [46]. The seismic performances of the bridges were investigated based on the recorded seismic response data. In general, the analyses were conducted by first comparing the recorded ground motions with the design ground motions. The bridges’ dynamic responses were later evaluated through detailed analysis involving numerical simulation using ground acceleration applied to all supports. The lessons learned from these earthquakes and the seismic responses obtained from the monitoring systems have contributed to the improvement of design codes and practices in Japan.
The Higashi-Kobe Bridge (Fig. 12) [46] presents a unique case because it is one of only a few instrumented long-span bridges that were damaged during the 1995 Great Hanshin (Kobe area) Earthquake. The bridge’s bearing–link systems connecting its end girders and pier caps failed (Fig. 12(b)) and lost their function as the uplift-prevention vertical support. Failure of the wind shoe due to excessive transverse motion of the girder end led to the failure of the bridge’s bearing link. Fortunately, the bridge was supported by intermediate piers at the side spans that provided additional redundancy, so total collapse was prevented.
《Fig. 12》
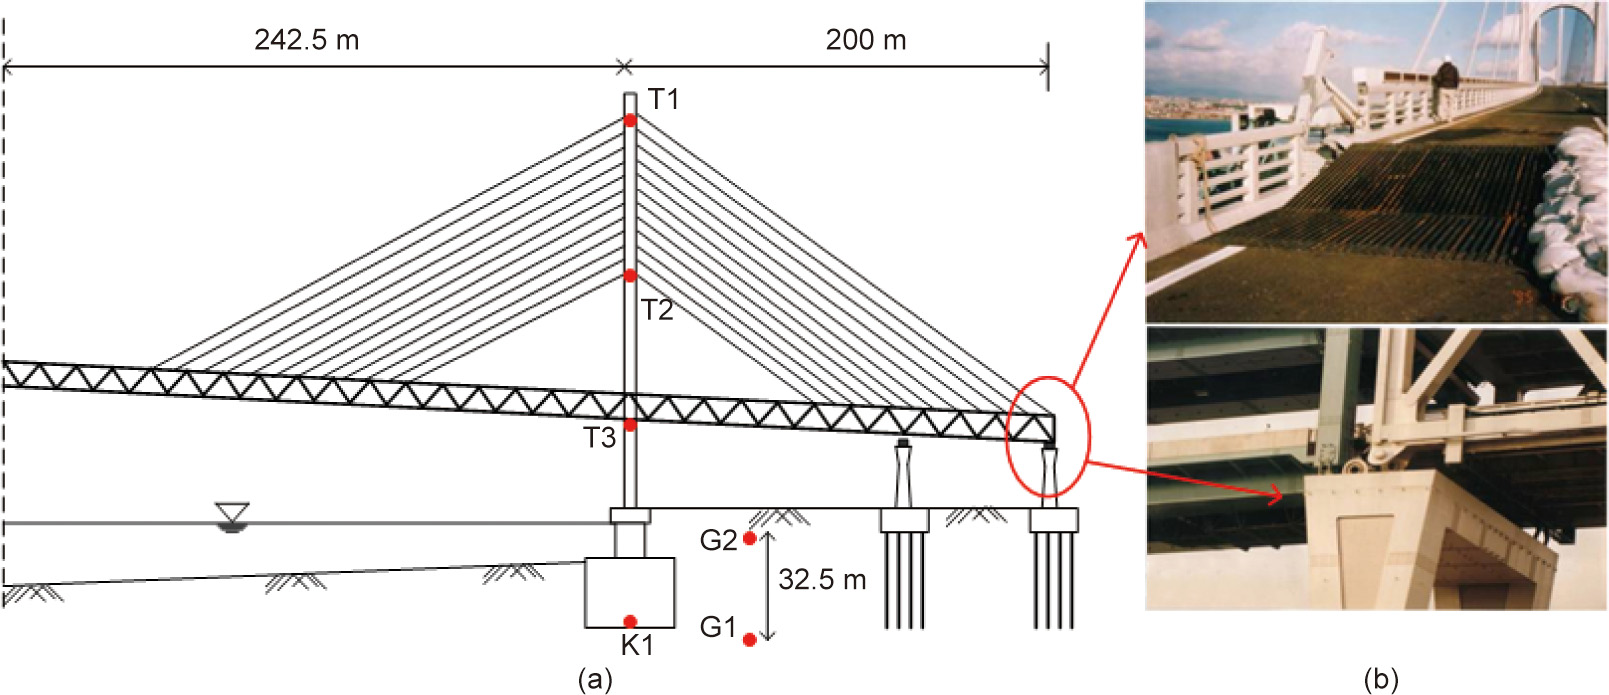
Fig. 12. The Higashi-Kobe Bridge and damage at the end bearing during the 1995 Great Hanshin (Kobe area) Earthquake. (a) Higashi-Kobe Bridge monitoring system; (b) damage at the end bearing. Reproduced from Ref. [46] with permission of John Wiley & Sons, Inc., © 1998.
The seismic monitoring system successfully recorded the bridge responses during the earthquake. Pounding between the girders and damage to the bearings and links were all reflected in the time-history records. From an analysis of the spike-like waveforms of the recorded seismic responses, it was concluded that pounding occurred between the pylon and the girder. The responses also revealed that the soil-structure system was strongly influenced by porewater pressure buildup in the saturated surface soil layers[46]. After the earthquake, uplift prevention cables connecting bridge’s pier caps and girders were implemented in order to add redundancy in case of link failure. In addition to the structural response, proof of liquefaction was observed in the ground motion record, since the bridge is built upon reclaimed land. Results from analyses of the recorded seismic responses were utilized to modify the current design code of highway bridges to evaluate seismic performance of bridges built on the softest ground condition.
Six years after the retrofit, the Yokohama Bay Bridge was shaken by the largest ground motion in the 2011 Great East Japan (Tohoku) Earthquake. The monitoring system recorded the bridge’s important response to the main shock and to several aftershocks. The seismic records show that the seismic isolation system (LBCs) functioned effectively. An important finding from the seismic records of this earthquake was the indication of tower–girder transverse pounding. The tower transverse accelerations were characterized by many periodic spikes resembling impulses that related to the girder’s first transverse mode at 0.32 Hz (Fig. 13) [47]. Visual inspection, which was performed afterwards, confirmed the occurrence of transverse pounding between the girder and tower at the tower–girder connections [47].
《Fig. 13》

Fig. 13. Photo of the LBC at the tower of the Yokohama Bay Bridge, and the monitoring system and observed seismic record from the 2011 Great East Japan (Tohoku) Earthquake. (a) Location of sensors on tower and girder, refer to Fig. 7(a) for the complete sensors layout; (b) photos of link bearing connection at the tower (left) and wind shoes at the tower (right); (c) accelerations of the tower at deck level during the main shock showing spikes indicating impulses; (d) time interval between successive lateral poundings. The data in (c) and (d) were obtained from T5(Y ) (sensor on tower P2 transverse direction mainshock). Reproduced from Ref. [47] with permission of American Society of Civil Engineers, © 2013.
Despite its occurrence, transverse pounding did not cause structural damage in the 2011 Great East Japan (Tohoku) Earthquake. The pounding process was studied using a simplified model of a two-sided contact problem between the nodes that correspond to the tower and girder at the wind shoe locations [48]. The simplified structural model reasonably simulated the pounding mechanism and its effect on the structure, such as the maximum impact force experienced by the tower and the wind shoes. Recently, a more detailed study using a multiscale finite element model was conducted by Takeda et al. [49] to investigate the effect of pounding on the tower and girder. To validate the finite element model, seismic records from various locations on the bridge were utilized; the validated model was then used to estimate the seismic performance of the tower, wind shoes, and LBCs in larger earthquakes.
《2.6. Monitoring for the maintenance and management of bridge assets》
2.6. Monitoring for the maintenance and management of bridge assets
2.6.1. Monitoring for the maintenance and management of long-span bridges
The application of structural monitoring for the maintenance and management of existing long-span bridges is now being implemented in Japan because of increasingly aging stock. One of the earlier examples is the implementation of structural monitoring during the rehabilitation and roadway expansion of Wakato Bridge [50]. Built in 1962, Wakato Bridge was the first modern long-span suspension bridge in Japan, and has a central span of 367 m. Fourlane widening construction was conducted in 1990 to accommodate the increase in traffic volume. While the widening work was being carried out, the bridge could not be closed to traffic, since doing so would have a severe impact on the Kitakyushu main road network and have social and economic effects on the nearby area. Therefore, it was decided to carry out the construction while ensuring normal traffic flow. This was an unprecedented construction work in Japan at that time. To ensure that the bridge was sound during and after the rehabilitation work, a semipermanent structural monitoring system was implemented. The monitoring system recorded the displacement of critical positions using displacement sensors and recorded bridge vibration using accelerometers.
The main objective of this monitoring was to observe possible changes in the bridge shape and in associated internal force balances due to the widening work. This was achieved by measuring deformation using a manometer displacement meter and by performing optical surveying on several critical locations including the top of the tower (δ1), middle of the tower (δ2), top of the pier (δ3), and end of the girder (δ4) (Fig. 14(b)) [50]. Because the original measurement data from the completion stage was also available, the structural conditions during the progression of each rehabilitation work stage could readily be compared with the original condition. Fig. 15 shows the displacement measurement points and corresponding measurements at various rehabilitation stages. It was found that the displacements of critical locations remained below the design values. In addition, a symmetric movement was observed between the Tobata and Wakamatsu sides, which implied that the balance among the internal forces was closely maintained during the rehabilitation work. From the vibration monitoring system, it was observed that the natural frequencies remained either unchanged or showed a slight stiffening after the girder-widening work. Hence, no major damage or softening that influenced the aerodynamic stability was expected.
《Fig. 14》

Fig. 14. (a) Wakato Bridge; (b) deformation measurement at the Wakato Bridge during girder widening work. Reproduced from Ref. [50] with permission of J-STAGE, © 1991.
《Fig. 15》

Fig. 15. Deformation measurement at the Wakato Bridge. (a) Tobata side; (b) Wakamatsu side. Stage 0 = design value; stage 1 = at completion; stage 2 = before rehabilitation; stage 3 = at the removal of half of central span; stage 4 = design value after rehabilitation; stage 5 = after rehabilitation.
The monitoring of long-span bridge deformation is important not only during rehabilitation work, but also under extreme loading conditions such as strong winds and typhoons. At the Akashi Kaikyo Bridge—the world’s longest span bridge—transverse displacement of the girder at various locations was measured by GPS sensors. Deformations during strong winds and typhoons are important for bridge performance evaluation and maintenance. An example of girder transverse displacement that was observed during the 2003 Typhoon Etau is shown in Fig. 16 [16]. Transverse displacements measured by GPS, accelerations, and wind speeds at the center of the girder are measured simultaneously.
《Fig. 16》

Fig. 16. Performance of the Akashi Kaikyo Bridge. (a) Measured lateral displacement at the center of the girder by GPS sensors and wind velocity with respect to time during the peak of 2003 Typhoon Etau; (b) displacement estimation calculated by accelerometer based on random vibration theory [16] with respect to displacement measured by GPS (the estimation results are consistent with the observation results). Reproduced from Ref. [16] with permission of J-STAGE, © 1996.
Because acceleration measurement can be applied to various structures with relatively arbitrary configuration and placement—compared with conventional displacement measurement, which requires a fixed point for reference—estimation of displacement is studied using data obtained from acceleration measurement. The maximum displacement under actual loading is an essential indicator for the performance evaluation of an existing structure. However, direct measurement of displacement requires a fixed reference point, and its implementation in actual civil structures is generally difficult and costly—while acceleration can readily be measured for a wide variety of situations. Hence, a fast evaluation method for the maximum displacement response from acceleration response based on random vibration theory is proposed in Ref. [16]. In this method, arithmetic equations to express the relationship between the response acceleration and the response displacement were first derived from response statistics in random vibration theory. Then, the accuracy of the method was evaluated through numerical simulations and actual measurement data at the Akashi Kaikyo Bridge, and its applicability was verified. The proposed method enhances the application of structure evaluation and monitoring by displacement, which is the major performance index.
Environmental measurement is becoming increasingly important for evaluation of the structural durability. For long-span suspension bridges, control of the air and monitoring of the moisture within the cables and box girders are very important to prevent corrosion and salt penetration. In modern long-span bridges, a dry air injection system (Fig. 17) was introduced to protect the main cables from corrosion [51]. Fig. 17(b) shows a comparison of the moisture between the outside air and the air inside the main suspension cable of the Akashi Kaikyo Bridge, demonstrating the advantage of the system.
《Fig. 17》

Fig. 17. (a) Dry air injection system for the Akashi Kaikyo Bridge; (b) moisture monitoring of the main cable. Courtesy of the Honshu–Shikoku Bridge Authority.
Another challenging problem in the environmental monitoring of long-span bridges is the evaluation of scour at the footings of the pylons. At the Akashi Kaikyo Bridge, for example, ultrasonic sounding by survey ship is employed every 2 years; so far, no severe scour has been observed [52]. However, it should be realized that natural disasters that would cause scour may occur between the intervals of ultrasonic survey, so that the development of continuous/permanent monitoring is desirable. Conventional monitoring systems designed for dynamic behavior during earthquakes and/or winds have proven to be useful, but further development to match the needs for maintenance and management are required for the rational management of long-span bridges.
Fatigue damage on steel members is another important issue for long-span bridges, especially for those that carry railway. This factor has been carefully examined ever since the design and fabrication stage of the bridges on the Kojima–Sakaide Route of the Honshu–Shikoku Bridge Link. High axle loadings were expected for the bridges during their service life along this route, since they support the railway lines. The bridges employ high-strength steel, which is sensitive to fatigue, in their primary members. The Honshu–Shikoku Bridge Expressway Authority has developed a welding methodology as well as a welding inspection system called the automated ultrasonic testing (AUT) system [53]. This system was effective in detecting welding defects in the factory. Several improvements were made to the system before it was deployed onsite for the inspection of existing welding lines. Two inspections were conducted by the year 2000, and no signs of crack progress were found on the bridges. This was attributed to the fact that the actual load of a train is smaller than the design assumption [54].
2.6.2. Monitoring for the maintenance and management of bridge pavement and slab monitoring from moving vehicles
The use of moving vehicles has been viewed as an alternative and attractive solution for effective monitoring because many bridges are distributed over vast road networks. The concept of indirect estimation is particularly attractive for the assessment of short-to-medium-span bridges and of road pavement conditions, for which permanent instrumentation and routine visual inspections can be too costly. In this concept, an inspection vehicle equipped with sensors is deployed and performs periodic measurement by recoding the vehicle vibration when passing along the road [55,56]. A fundamental property to be measured from a vehicle for the dynamic monitoring of bridges is the road pavement profile, which is a major source of bridge dynamic responses through vehicle–bridge interaction. Based on pavement estimation techniques, the bridge modal mass, bridge natural frequencies, and moving vehicle weight can be estimated. Another important property to be measured from a vehicle is the condition of the reinforced concrete slab. A vehicle equipped with a groundpenetrating radar (GPR) device drives over the concrete slab at a speed as high as 80 km·h-1 and evaluates the concrete slab conditions. These two types of monitoring from a moving vehicle are described in this section.
2.6.2.1. Pavement profile evaluation and its application to bridge dynamic property estimation. Pavement profile estimation algorithms using only the vehicle’s dynamic responses under normal driving conditions have been studied, and their performances have been experimentally assessed [57,58]. While the response-based profile estimations typically have difficulty compensating for differences in the vehicle dynamic characteristics and vehicle driving speed, a data assimilation-based profile estimation technique using a half-car (HC; see Fig. 18(a) [56]) model has been shown to provide accurate compensations for the vehicle characteristics and speeds. A Kalman filter and particle filter are typical data assimilation techniques; the profile is estimated as part of an augmented state vector. The acceleration and angular velocity responses of the vehicle body are selected as observation variables based on observability analyses [59]. When the observability condition is satisfied and when vehicle model parameters that accurately represent the vehicle responses are obtained, the estimated pavement profile has been shown to be accurate. Furthermore, response-based profile estimation implemented only with a smartphone has been applied to different types of vehicles and has been shown to estimate the profile with a similar degree of success to one obtained from a reference profiler vehicle equipped with a precise laser and an inertia sensor unit (Fig. 18(b)) [60].
《Fig. 18》
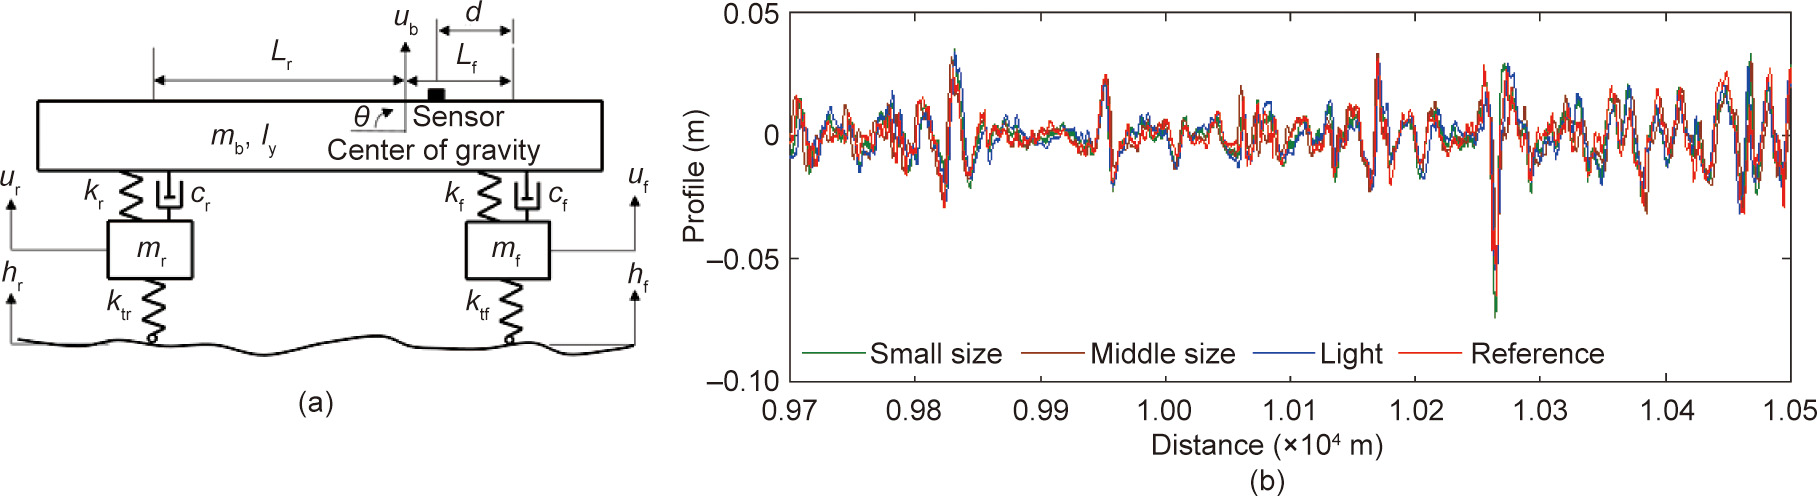
Fig. 18. (a) HC model; (b) profile comparison of three vehicles and a reference profiler. mb: vehicle body mass; Iy: moment of inertia; ub: vertical movement of the vehicle body; θ: vehicle body pitching motion. d is the distance between front axle and the location of sensor, mf and mr denote the tire mass; kf and kr denote the vehicle suspension stiffness; ktf and ktr denote the tire stiffness; cf and cr denote the suspension damping; uf, and ur, are the tire vertical displacements, hf and hr represent the road roughness; and Lf and Lr represent the distance from the vehicle’s center of gravity (COG) to the suspension systems. Subscripts f and r denote the front and rear part of the vehicle, respectively. Reproduced from Ref. [56] with permission of Elsevier Ltd., © 2018.
To estimate the profile from vehicle responses, it is first necessary to identify the parameters of the HC model. This can be done by analyzing the vehicle responses after its passage over a small hump of known size. This procedure has been proposed and validated experimentally [57,58]. Using this parameter identification, a variety of vehicle types can be utilized in the profile estimation. More than 100 vehicles in Japan equipped with smartphones were calibrated with this method and are used to record the vibration responses during daily drives. The identified road profiles are utilized in pavement condition assessment.
Furthermore, the profile estimation technique has been utilized in several bridge dynamics problems. First, the profile estimation algorithm can be easily converted to the tire contact force estimation algorithm [61]. The tire contact force estimated from the vehicle response measurements was compared with the tire force measured at the load cell on an axle (Fig. 19), which showed agreement in the dynamic frequency range (Fig. 20(a)) [60]. The input force to the bridge is thus efficiently estimated from a moving vehicle. Once the dynamic load exerted on the bridge is obtained, the bridge vibration responses that are synchronously obtained with the vehicle response are utilized in an optimization approach to estimate the bridge modal masses (Fig. 20(b)) [61], which is one of the fundamental bridge properties. The use of the modal mass includes the estimation of the vehicle force on the bridge using the bridge’s dynamic responses [61].
《Fig. 19》

Fig. 19. Experimental setup on tire force estimation. (a) Equipped test vehicle; (b) wheel-load transducer [60].
《Fig. 20》

Fig. 20. (a) Estimated and referenced tire force in the time domain; (b) estimation of the first bridge modal mass; (c) bridge natural frequency estimation from a moving vehicle [60]. GA: genetic algorithm. 1 ton = 1.01605 t.
Second, bridge natural frequencies can be identified from moving vehicles by utilizing the profile estimation technique [61,62]. Because the vertical displacements of the tire contact points are the summation of the bridge vertical motion and profile, by subtracting the front tire vertical displacement from the rear tire displacement, the common components of the profile cancel out; only the bridge vertical motion components are obtained. In this manner, the bridge natural frequency is estimated using only the vehicle dynamic response. The natural frequency estimation capability has been experimentally shown for a steel box-girder bridge (Fig. 20(c)) [62]. Because of the motion of the vehicle, the vehicle–bridge interaction, and the limited accuracy of the tire displacement estimation, the peak of the PSD does not exactly match the bridge natural frequency; however, the dominant peak clearly shows correspondence to the fundamental frequency of the bridge.
2.6.2.2. Concrete slab condition assessment using a vehicle equipped with GPR. Bridge deck slabs are important parts of the bridge structure. The primary function of a bridge deck is to support the vehicular vertical loads and distribute these loads to the girders. The deck is typically continuous along the span of the bridge and continuous across the width of the span. In most applications, the bridge deck slab is made from reinforced concrete or composite. A concrete bridge deck slab must survive for decades under repeated loading from traffic and environmental stress. Damage, such as cracking and delamination, inevitably occurs; and in a location with severe winter weather, the use of deicing salts can accelerate corrosion.
Damage on a concrete deck slab is often hidden inside and does not appear on the surface until it is at an advanced stage. In order to maintain a concrete bridge deck slab effectively, effective and precise assessment of the condition of the bridge is critical. In practice, the evaluation of concrete deck slab conditions has been conducted using various non-destructive techniques such as impact echo, chain dragging, and ultrasonic pulse velocity. The limitations of these techniques are that they require significant manpower and are time consuming. Therefore, there is a need for more efficient and reliable assessment of reinforced concrete slabs.
A new system is currently being developed for the efficient and robust non-destructive evaluation of a bridge deck concrete slab. The system consists of a GPR mounted on a vehicle (Fig. 21(a)). This monitoring system can perform fast scanning of the slab in a noncontact manner at normal driving speeds on a highway (80 km·h-1 ) [63]. In general, in the GPR-based monitoring system, radar signals are reflected from the slab and captured; these are later visually examined by inspectors to assess the slab condition. However, the signal is normally insensitive to damage because the wavelength of the existing GPR system is much larger than the damage scale. Therefore, direct detection of the slab condition is often inaccurate, and the level of accuracy depends on the experience or prior knowledge of the inspectors.
《Fig. 21》
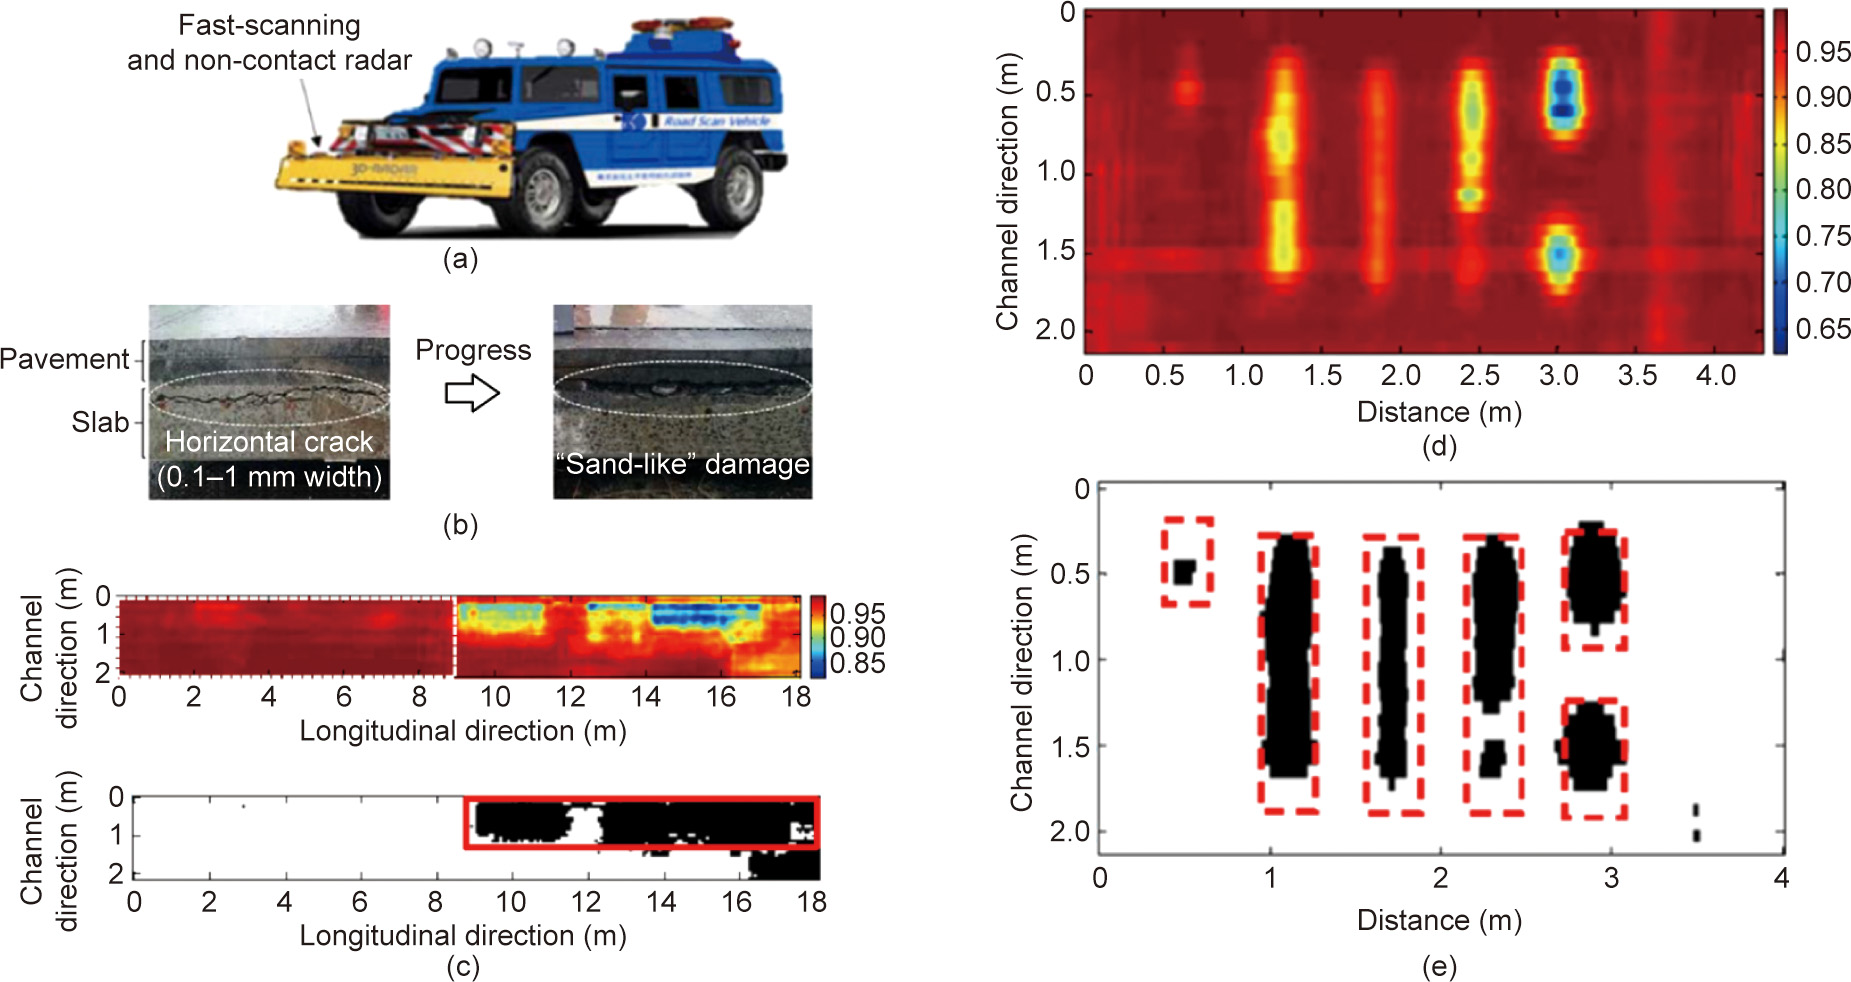
Fig. 21. Concrete slab condition assessment using a vehicle equipped with GPR. (a) GPR measurement vehicle; (b) horizontal crack and “sand-like” damage (segregation) inside the reinforced concrete bridge slab; (c) comparison between results from the maximum cross-correlation function of GPR signals (upper) and the results from abnormal sound by hammer test (lower) (the white dash box denotes the whole slab; the red solid box denotes the location of damaged slab detected by hammer test); (d) color map of the maximum cross-correlation function of GPR test on a reinforced concrete slab specimen with artificial concrete damage for wet condition; (e) results of GPR test on a reinforced concrete slab specimen with artificial concrete damage for wet condition after applying the threshold (black area: lower than threshold value; white area: higher than threshold value; red dashed box: locations of artificial damage). Reproduced from Ref. [63] with permission of J-STAGE, ©2017.
Manual image checking by inspectors is a labor-intensive and time-consuming work. Thus, an algorithm to automatically detect damage from GPR signals has been proposed [63,64]. The algorithm first computes the cross-correlation between the signal from the non-damaged area, called the “reference,” and the signal from the target area. If the target area is not damaged, the waveform of the GPR signal has a high similarity to the reference, resulting in a large cross-correlation value. On the other hand, the crosscorrelation of a damaged area is small. Typical types of damage inside a concrete slab include the horizontal crack and ‘‘sandlike” damage (segregation) shown in Fig. 21(b). By applying a certain threshold to the cross-correlation, the damaged and nondamaged areas are determined. Fig. 21(c) shows a comparison between hammer test results and the maximum crosscorrelation function obtained from GPR signals. It shows that they are in good agreement. To validate the damage detection algorithm, a full-scale bridge slab with artificial damage was prepared and the algorithm was applied (Fig. 21(b)). The widths of the artificial horizontal cracks were around 1, 5, and 10 mm. Water commonly presents inside a damaged slab, which can accelerate the progress of the damage. The presence of water can also improve the accuracy of damage detection. Damage detection was performed for dry and wet conditions, and the results are shown in Figs. 21(c) and (d). For the dry condition, cracks with a width of 10 mm were identified. For the wet condition, small crosscorrelation values are noted at the artificial cracks; however, crack areas are identified at all crack width areas after applying the threshold. This technique has been applied to a number of real bridges, and good agreement with the hammering test results was obtained.
《3. Monitoring of building structures》
3. Monitoring of building structures
《3.1. Building monitoring for the verification of active- and semi-activecontrol systems》
3.1. Building monitoring for the verification of active- and semi-activecontrol systems
In the 1990s and 2000s, research and development on vibration control technologies advanced rapidly in Japan. Practical applications of these systems to building structures attracted increasing global interest as an innovative technology in the fields of earthquake and wind engineering. Various mechanical devices have been proposed for the passive, semi-active, and active control of building structures. Active and semi-active control has been applied to many buildings [65]. Practical applications were supported by vibration monitoring using digital information technology since vibration sensors are needed in the control in order to realize feedback control laws and verify the control effectiveness. The first implementation of active-control system to a building was in the Kyowa Building, which was built in 1989. By 2009, about 70 active- and semi-active-control installations had been achieved in Japan, of which 52 are active control and 17 are semi-active control [66]. Among the active-control applications, 51 are active mass damper (AMD) systems.
In this section, an example of monitoring the performance of an AMD system is described, since this is the largest application of active-control system to existing buildings. Verification of the effectiveness of the control system is conducted through vibration analysis of the data recorded at the actively controlled buildings. Fig. 22 shows the dependency of additional damping ratios on the first vibration modes at different periods obtained from vibration data recorded under small earthquakes, strong winds, and forced vibration tests. Note that the figure does not indicate the equivalent damping ratios but rather shows the additional damping ratios [66], which are defined as the difference between the controlled damping ratio and the uncontrolled damping ratio. For active-control systems, the uncontrolled damping ratio can be evaluated when the AMD system is not in operation. In this figure, the additional damping ratio was in the range of 0.7%–18.2%, with an average of 7.8%. Information on the damping ratios for about 20 applications is unavailable, since these are not evaluated by damping ratio but by other criteria. Despite the relatively large variation, Fig. 22 reveals that the additional damping ratio decreases as the first natural period increases. Because tall buildings are flexible structures with long natural periods and small damping ratios, even small additional damping is very effective in reducing the responses.
《Fig. 22》
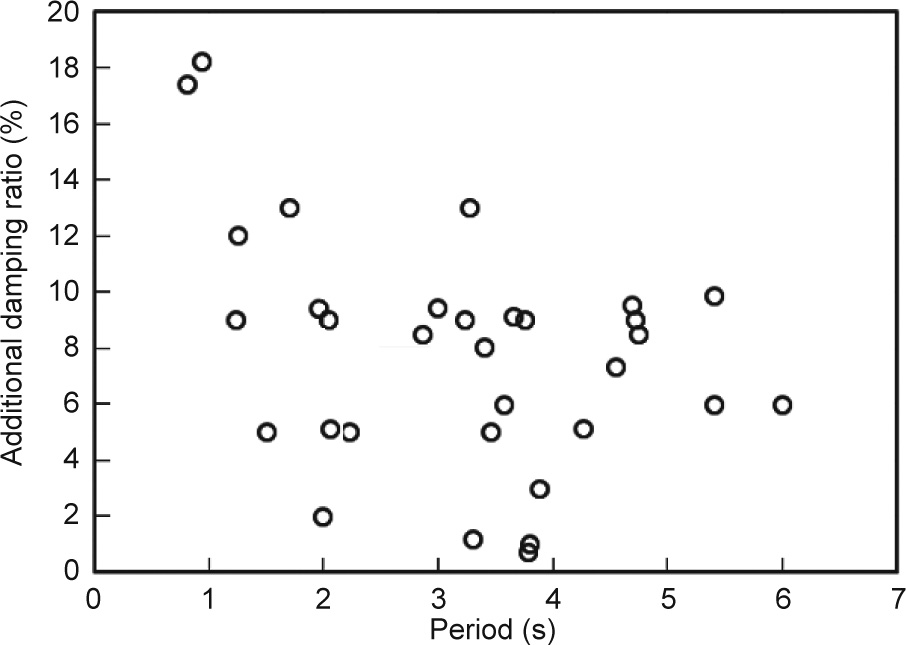
Fig. 22. Dependency of the additional damping ratios on the first natural periods in active control.
Prior to 2007, the existing semi-active-control systems had never experienced medium/large earthquakes, which are the target excitations in structural design. On 16 July 2007, the ChuetsuNiigata-Oki Earthquake hit the Niigata area and shook the 31- story Bandaijima Building in Niigata City. A peak acceleration of 100 cm·s-2 was recorded on the top floor of the building. The maximum force of the semi-active damper installed on the fifth story was 640 kN, and the maximum stroke was 5.2 mm [67]. The maximum limits are 1500 kN for the control force and 60 mm for the stroke. Previously, the building experienced the smaller 2004 Chuetsu-Niigata (Niigata Prefecture) Earthquake on 23 October 2004. The responses of the semi-active controllerstructural system at that time were smaller than those of the 2007 Chuetsu-Niigata-Oki Earthquake. Fig. 23 shows the stroke– force relations of the semi-active damper installed in the fifth story. Based on identification using the auto-regressive exogenous (ARX) model, the equivalent damping ratio of the lowest controlled mode was about 7% under these earthquakes and their aftershocks. The damping ratio without semi-active control was evaluated as 1% by the random decrement (RD) method applied to wind observation.
《Fig. 23》
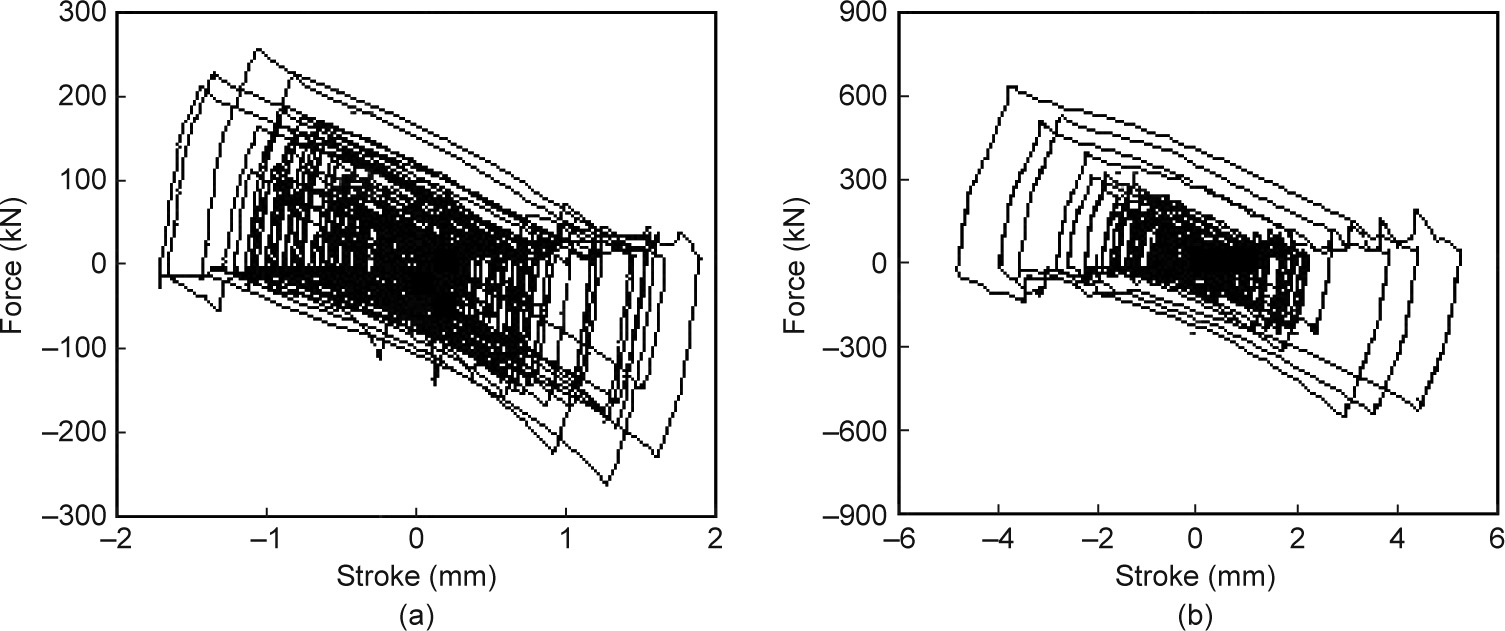
Fig. 23. Stroke–force relations of a semi-active damper in the fifth story, Bandaijima Building, under two Niigata earthquakes in 2004 and 2007: (a) 23 October 2004, the Chuetsu-Niigata (Niigata Prefecture) Earthquake; (b) 16 July 2007, the Chuetsu-Niigata-Oki Earthquake.
Monitoring and verification of the installed structural control system are very important in order to continue increasing the practical applications of the system in future. It is recommended that the actively and semi-actively controlled existing structures be monitored continuously, and that their responses under dynamic loadings be recorded. The long-term accumulation of observation records and the corresponding analysis can contribute to health monitoring in structural control. Control verification based on observation data should be promoted widely, and the reports should be made available to the public.
《3.2. Monitoring for the verification of passive-control systems》
3.2. Monitoring for the verification of passive-control systems
Passive control is recognized as the most useful technology for large-scale excitations, because it requires neither an external energy supply nor computing based on vibration measurement. In fact, the number of passive-control applications is overwhelmingly greater than the number of both active- and semi-active-control applications combined [66,68]. However, before the 2011 Great East Japan (Tohoku) Earthquake (Mw = 9.0), it was difficult to confirm the effectiveness of passive control, since such a system does not require monitoring systems for its vibration control, and since neither moderate nor large earthquakes had occurred in the cities where many buildings had passive control systems. Considering the large number of practical applications, vibration monitoring is still not widely implemented in passively controlled buildings.
On 7 March 2011, four days before the Great East Japan (Tohoku) Earthquake, several reports on the verification of passive control were presented at a symposium held by the Architectural Institute of Japan (AIJ). The symposium recommended that passive control should be verified with actual measurement records under large earthquakes. In the early 2000s, Japan revised the Building Standard Law (BSL) to accommodate performance-based design, which naturally requires structural designers and engineers to check whether the building performs as expected in the design. This confirmation can be implemented through observation and the accompanying analyses.
After the 2011 Great East Japan (Tohoku) Earthquake, the Vibration Control Committee under the Japan Society of Seismic Isolation (JSSI) started investigating the actual performance of baseisolated and vibration-controlled buildings [69]. The committee received questionnaire responses from 327 base-isolated buildings and 130 vibration-controlled buildings (other than base-isolated buildings). About 100 vibration-controlled buildings were in the area where the main shock registered more than “5 lower” on the JMA’s seismic intensity scale with ten classes. The scale “5 lower” is the sixth scale from the smallest earthquake scale, and is approximately 50–100 cm·s-2 at the peak acceleration in the frequency range from 0.5 to 5.0 s. The report states that the structural responses were recorded at 15 vibration-controlled buildings during the earthquake, and that system identification was applied to 11 buildings among these in order to identify their natural periods, corresponding damping ratios, uncontrolled seismic responses, and so on. The sub-committee on structural control under the AIJ had asked the public to disclose the verification of the control systems installed in buildings, and the total number of verified buildings slightly exceeded the number listed in the JSSI report. In Japan, the number of buildings with vibration monitoring systems has increased in recent years. However, most of the recorded data is not open to the general public or to researchers.
Fig. 24 shows the linearly equivalent natural periods and the corresponding damping ratios of the passively controlled buildings in the first vibration modes under the main shock [70]. Unlike Fig. 22 and Fig. 24 indicates the equivalent damping ratios based on the reference. One plot refers to one controlled horizontal direction in a structure. The dynamic properties were evaluated either by ARX model or by subspace system identification. In the identification, the input signal is the acceleration on either the first floor or the base, and the outputs are the accelerations on the upper floors. Therefore, the damping effect described in the figure is a result of the building’s damping and the installed passive control devices. For passive-control systems, it is impossible to divide the equivalent damping ratio into additional damping and structural damping. Each plot indicates a mean value under the main shock. The reported buildings have multi-layered stories with typical floor plans, and the installed passive-control devices are classified into hysteresis dampers, buckling-restrained braces, viscous dampers, and oil dampers. The passive control includes no joint dampers between two adjacent buildings. It should be mentioned that finding a good regression curve for the identification results is impossible, considering their large variance. The indicated curve is a reference to understand the global tendency of the control effectiveness.
《Fig. 24》
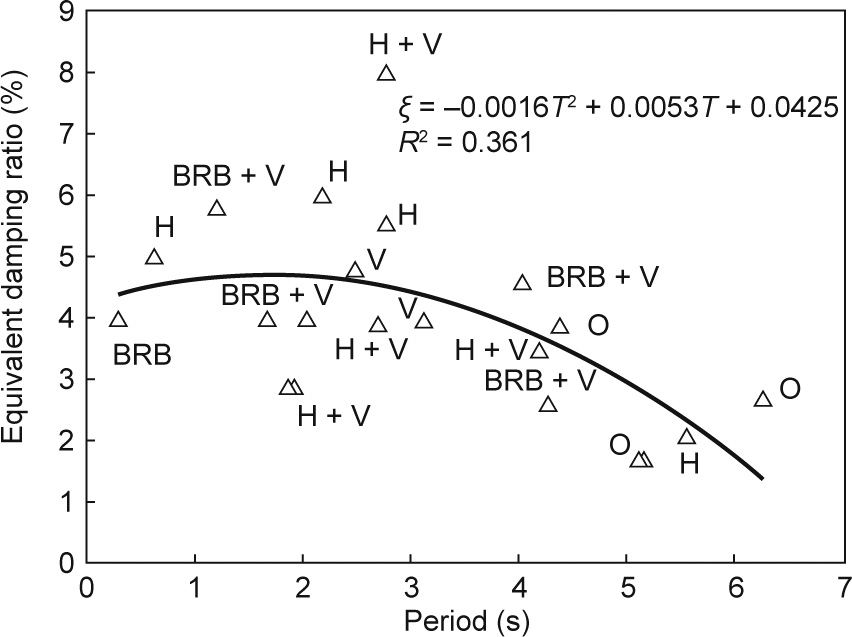
Fig. 24. Dependency of the equivalent damping ratios (ξ) on the first natural periods (T ) in passive control. R2 : correlation coefficient; H: hysteretic damper; V: viscous damper; O: oil damper; BRB: buckling-restrained brace.
The results presented in this figure are mostly from middle- and high-rise buildings with 11–54 floors, except for one five-story reinforced concrete building. The types of structures included in the graph are reinforced concrete structure (RC), steel-framed reinforced concrete structure (SRC), concrete-filled circular tubular steel columns with steel beams (CFT) and steel structures. Peak ground accelerations vary from one building to another depending on the location. Peak horizontal accelerations of 210 and 310 cm·s-2 were recorded in the basement of a 21-story office building in Sendai City, Tohoku District, while on other buildings in Tokyo and in the surrounding areas—that is, the Saitama and Kanagawa Prefectures—peak horizontal accelerations of 50– 140 cm·s-2 were recorded. It should be mentioned that the ground motions in the Tokyo Metropolitan Area correspond to small or moderate earthquakes in the Japanese structural design. Fig. 24 excludes the building in Gifu City, Chubu District, which has semi-active and passive dampers [71], because the input acceleration was smaller compared with the ground accelerations in the Tokyo Metropolitan Area.
In general, the figure shows that passive control was effective in all the observed buildings, because the damping ratio of the first horizontal mode of an uncontrolled building is normally between 1% and 2%. The main shock excitation level in the metropolitan area was not enough for the hysteretic dampers to function sufficiently. It is noticeable that the resulting damping is somewhat less effective for hysteretic dampers. The peak acceleration ratios between the top floor and base were in the range of 1.7–10.9 for hysteretic dampers and in the range of 1.1–3.1 for viscous and oil dampers. These ratios reveal the differences among the dynamic characteristics of dampers: hysteretic dampers with displacement dependency work well under large earthquakes, while viscous/oil dampers with velocity dependency work under small, medium, and large earthquakes. It is difficult to accurately describe the general tendency of control effectiveness, because the number of reported buildings was limited, the identification results have large variations, and the structural design philosophies are not open. However, the equivalent damping ratio shows a decrease with the period after an initial increase. When a certain damping ratio is expected, the passive control cannot follow up the scale of a higher building with a first mode of more than 3 s. A similar decrease with the period can be seen in Fig. 22. In an actual building, the spaces required to install dampers are strongly restricted and the construction cost is prohibitive. This understanding became possible through the seismic observation records. Monitoring is recommended for building structures in order to further the advancement of structural control technology.
《3.3. Building monitoring for structural assessment and damage detection》
3.3. Building monitoring for structural assessment and damage detection
Advances in information technology have realized active- and semi-active-control methods that require sensors and control laws. With the maturation of vibration control technology, research interest in the field has gradually shifted to structural assessment and damage detection using information technology, which is widely known as ‘‘structural health monitoring.” Although the idea of maintaining and managing civil engineering structures using structural health monitoring had existed in the past, research on damage detection through vibration measurement in buildings became active in the later 2000s. The first impetus for this research was the 1995 Great Hanshin (Kobe area) Earthquake, which hit the urban areas of typical modern cities in Japan. The damage was extensive, and a great deal of effort and time was required for structural engineers to judge the safety of many buildings. As a result, advanced research topics for the rapid and automatic earthquake damage assessment of important structures such as public buildings, hospitals, and high-rise buildings were initiated.
The 2011 Great East Japan (Tohoku) Earthquake occurred during the time when this research and development had been implemented. The instructions for earthquake victims to return home after the main shock and during the aftershock created some confusion in Tokyo. In big cities, it is currently recommended to accept difficulty in returning home after a large earthquake. In the case that building safety and use is confirmed after a large earthquake, the tenants of an office building should stay there for some days. It is impossible for non-experts in structural engineering to guarantee building safety. This is another reason for the interest in damage detection via vibration monitoring. Monitoring significantly affects the decision-making for building use after an earthquake, because an analytical model used in the design cannot describe the seismic response precisely. In addition, it was found that the use of earthquake observation records was highly effective and encouraging when building managers reported the building damage to the users or residents [72]. However, the number of sensors in actual buildings is limited. Hence, integration of measurement with model-based analysis is required to provide building users with useful information about structural damage.
For a medium- or high-rise steel building, the linearly equivalent dynamic properties can be evaluated easily in the lowest vibration modes with a limited number of sensors. By modifying its analytical model based on the identification results, it is possible to equivalent-linearly estimate the structural responses at all floors and in all stories [73]. In the near future, it will be difficult to estimate the response at each structural member with acceptable accuracy for the following reasons: ① The number of installed sensors is limited, ② many non-structural members contribute to the seismic response of an entire structure, and ③ it is difficult to extract signals directly linked to the damage from measurements at structural members.
In practice, the seismic-induced damage of an entire building is assessed comprehensively based on the damage to the structural and non-structural members, equipment, overturning of furniture, and so on. Each example of damage can be classified as an acceleration-dependent, displacement-dependent, or combined phenomenon. This means that the accelerations and displacements of all floors are useful for decision-making on tentative use immediately after an earthquake. Inter-story displacement, which is obtained as the difference between the displacements of two adjacent floors, is necessary information in order to detect structural damage in each-story.
Damage detection methods based on linear modal analysis, which aim to estimate the damage to medium- and high-rise steel buildings by using information from sensors on limited floors, were proposed in Refs. [73,74], and are shown in Fig. 25. The seismic responses of all floors in a building are estimated using the records from several floors [73]. First, the method in Ref. [73] identifies the linearly equivalent modal properties in the lowest modes of each horizontal direction by means of a single-input-multioutput (SIMO)-ARX model. Fig. 25 shows a case study of a building analyzed by the SIMO-ARX model. The modal amplitude at the ith output floor for the  mode
mode  is assumed to be a sinusoidal function with two unknowns,
 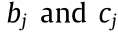 , and is approximated by Eq. (1):

where Hi is the normalized height of the ith output location to the roof floor (i = 1–3 in Fig. 25). Parameters in Eq. (1) are determined by minimizing the performance index  in Eq. (2).
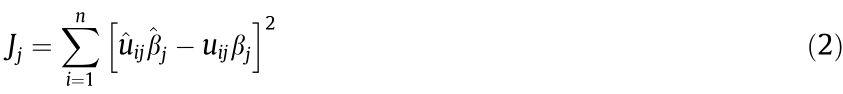
where  is the identified modal amplitude at the ith output floor for the mode and n is the number of measured outputs.
《Fig. 25》
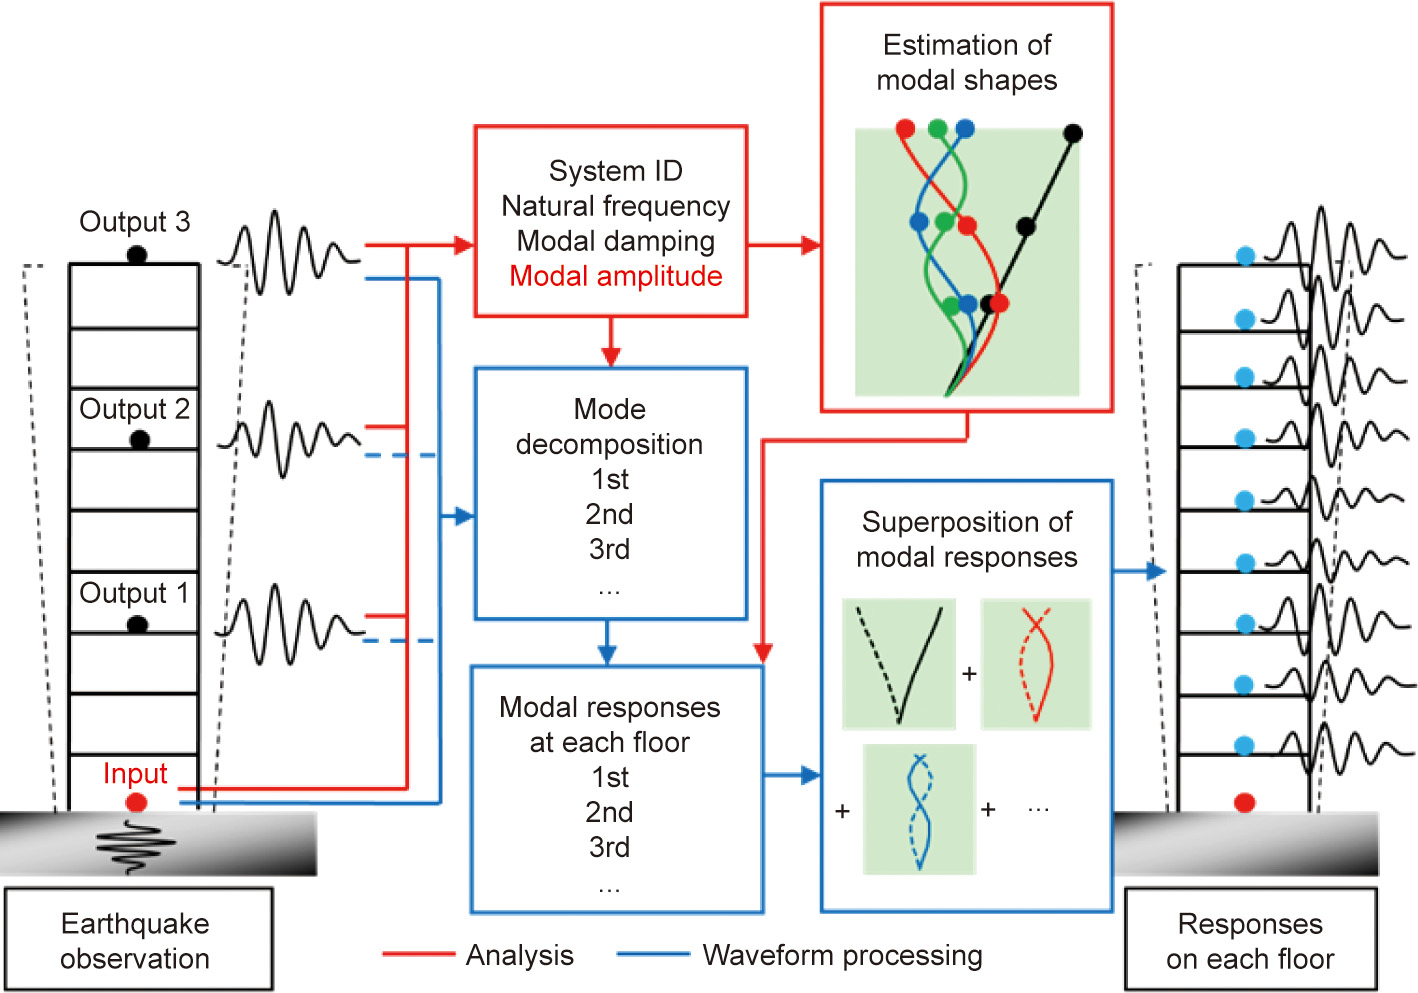
Fig. 25. Estimated accelerations on all floors by using the accelerations recorded on some floors.
After are optimized, the jth modal amplitude of each floor can be obtained by setting Hi in Eq. (1) at the normalized height of each floor. This process can be expressed by both the red lines and red frames shown in the figure.
Next, the jth modal response acceleration at a selected output floor is calculated from the measured acceleration of that floor using a bandpass filter corresponding to the mode’s frequency. Both the modal amplitude of each floor and the modal acceleration at the selected floor are utilized to obtain the modal acceleration at each floor in the jth mode. By using a superposition of the modal accelerations from several lowest modes, the seismic responses of each floor can be estimated. In this method, the number of outputs is independent of the number of selected lowest modes. Furthermore, it is possible to obtain displacements by doubleintegrating the accelerations, and implementing a similar process. Using this method, it is possible to estimate the seismic response of an entire building without analytical models a priori, and physical phenomena are realized through modal identification.
This method was applied to a 29-story steel building located on the west side of the Japan Railway (JR) Shinjuku Station, Tokyo, Japan. The building’s floor plan is 25.6 m in the north–south (NS) direction and 38.4 m in the east–west (EW) direction; the building is 27.8 m in height, and does not have structural control devices [75]. Accelerometers were installed on the lowest floor (basement) and on the 1st, 8th, 16th, 22nd, 24th, and 29th floors above the ground. The building accelerations due to the main shock of the 2011 Great East Japan (Tohoku) Earthquake were recorded with a sampling frequency of 100 Hz [76].
Fig. 26 shows the estimated distribution of the maximum response accelerations and displacements along the height. The estimation uses three accelerations measured on the 1st, 16th, and 29th floors, and considers three lowest vibration modes in the modal superposition. Two accelerometers (NS1 and NS2) were installed on each of the 16th, 22nd, and 29th floors, resulting in two plots on the same floor. On the 8th floor, the displacement relative to the ground cannot be obtained by the double integration of the corresponding acceleration. A good agreement between the estimated and observed responses can be seen from the figure. The performance of the 29-story building was still in the linear range for the 2011 Great East Japan (Tohoku) Earthquake; however, it should be noted that the proposed study is not applicable in the nonlinear range [73].
《Fig. 26》
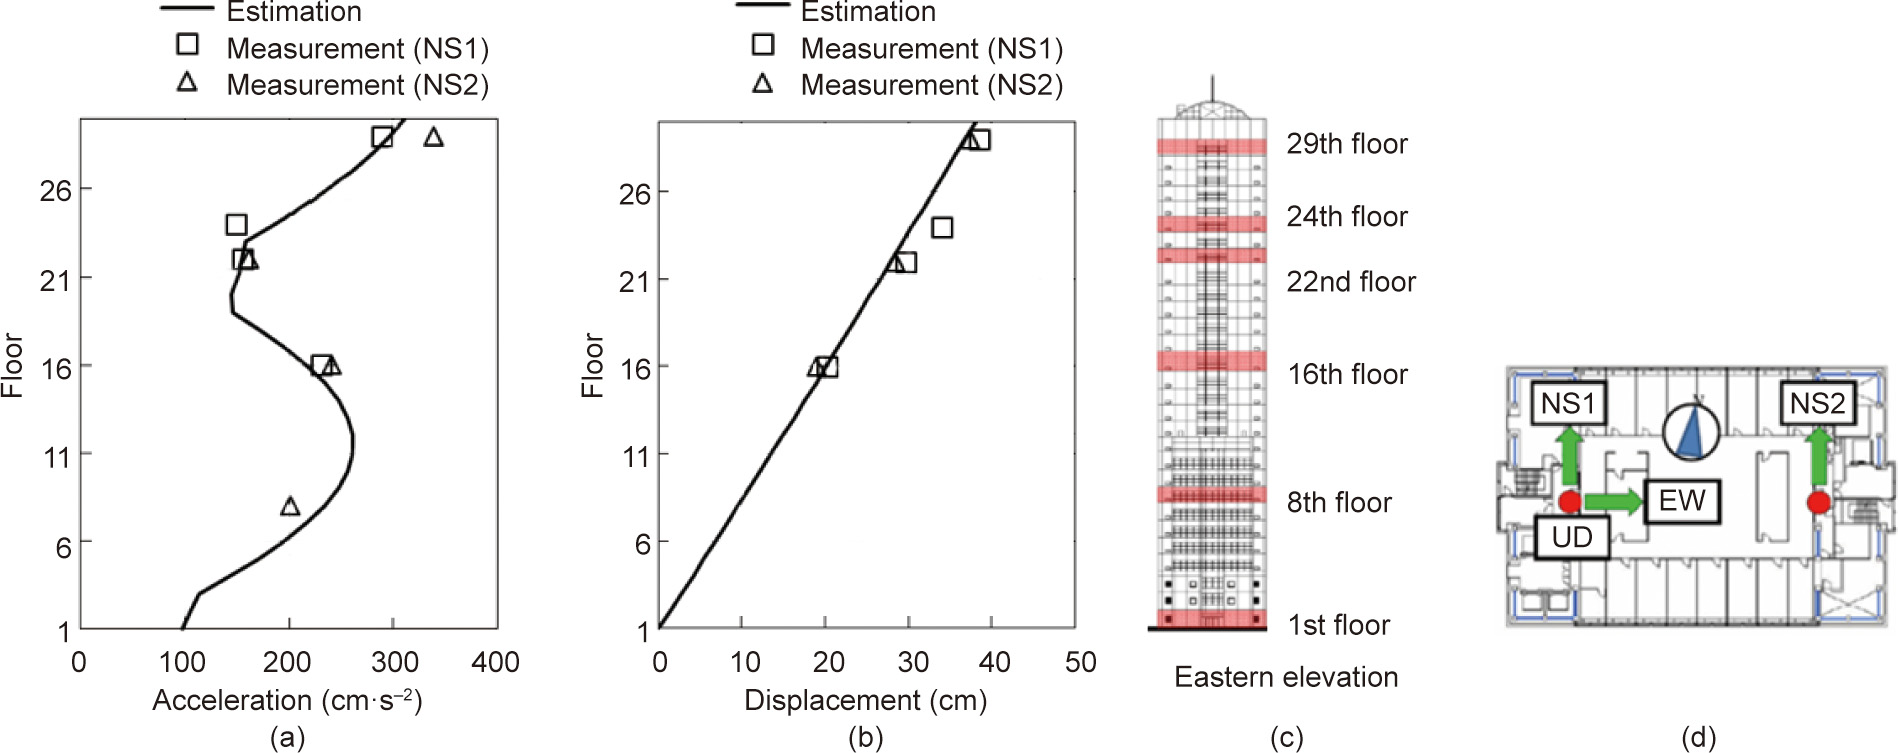
Fig. 26. Response estimation at the center of all floors in the NS direction based on accelerations measured on the 1st, 19th, and 29th floors, and consideration of the lowest three vibration modes. (a) Maximum response accelerations; (b) maximum response displacements; (c) accelerometer installed floors; (d) typical floor and sensor locations. UD: up–down, i.e., vertical.
The applicability of this method to the nonlinear range was first studied using shaking table tests of a 1/3 scale 18-story steel specimen [74]. The tests were conducted in 2013 at “E-Defense,” which is a three-dimensional full-scale earthquake testing facility managed by the National Research Institute for Earth Science and Disaster Prevention (NIED). Fig. 27 shows a moment-resisting frame structure with the dimensions of 6.0 m (three 2.0 m bays in the x direction) by 5.0 m (one bay in the y direction) by 25.3 m in height as the test steel specimen. The model is a 1/3 scale building with the following heights: 0.7 m for the foundation, 1.65 m for the first story, and 1.35 m for each of the other stories; the total weight is 4180 kN. The frame is composed of box-shaped steel columns and H-shaped steel beams, with a column width of 200 mm. The beam in the x direction is 270 mm in depth and has a flange width of 85–95 mm; in the y direction, the depth is 250 mm and the flange width is 125 mm.
The accelerometers were installed at two corners on each floor, as shown in Fig. 27. The accelerations were recorded with a sampling frequency of 200 Hz. The test specimen was excited only in the x direction (longitudinal direction) using the input artificial ground motion that is expected at Tsushima, Aichi Prefecture, under a scenario of a consolidated-type megathrust earthquake occurring at the subduction zones in the south of Honshu Island. The peak ground acceleration was about 300 cm·s-2 . For a fullscale building structure, the pseudo-velocity (pSv) response spectrum value with a damping ratio of 5% is about 110 cm·s-1 in the period range from 0.8 to 10 s, and the input duration time is about 460 s. Corresponding to the 1/3 scale specimen, the time of the artificial earthquake was condensed to  . The peak amplitude of the excitation for repeated loading was increased from 20 to 420 cm·s-1 , as shown in Table 4 [76]. Fig. 27(b) shows the input acceleration to the specimen under the pSv110-1 excitation (under which the pSv response spectrum value is 110 cm·s-1 ).
《Fig. 27》
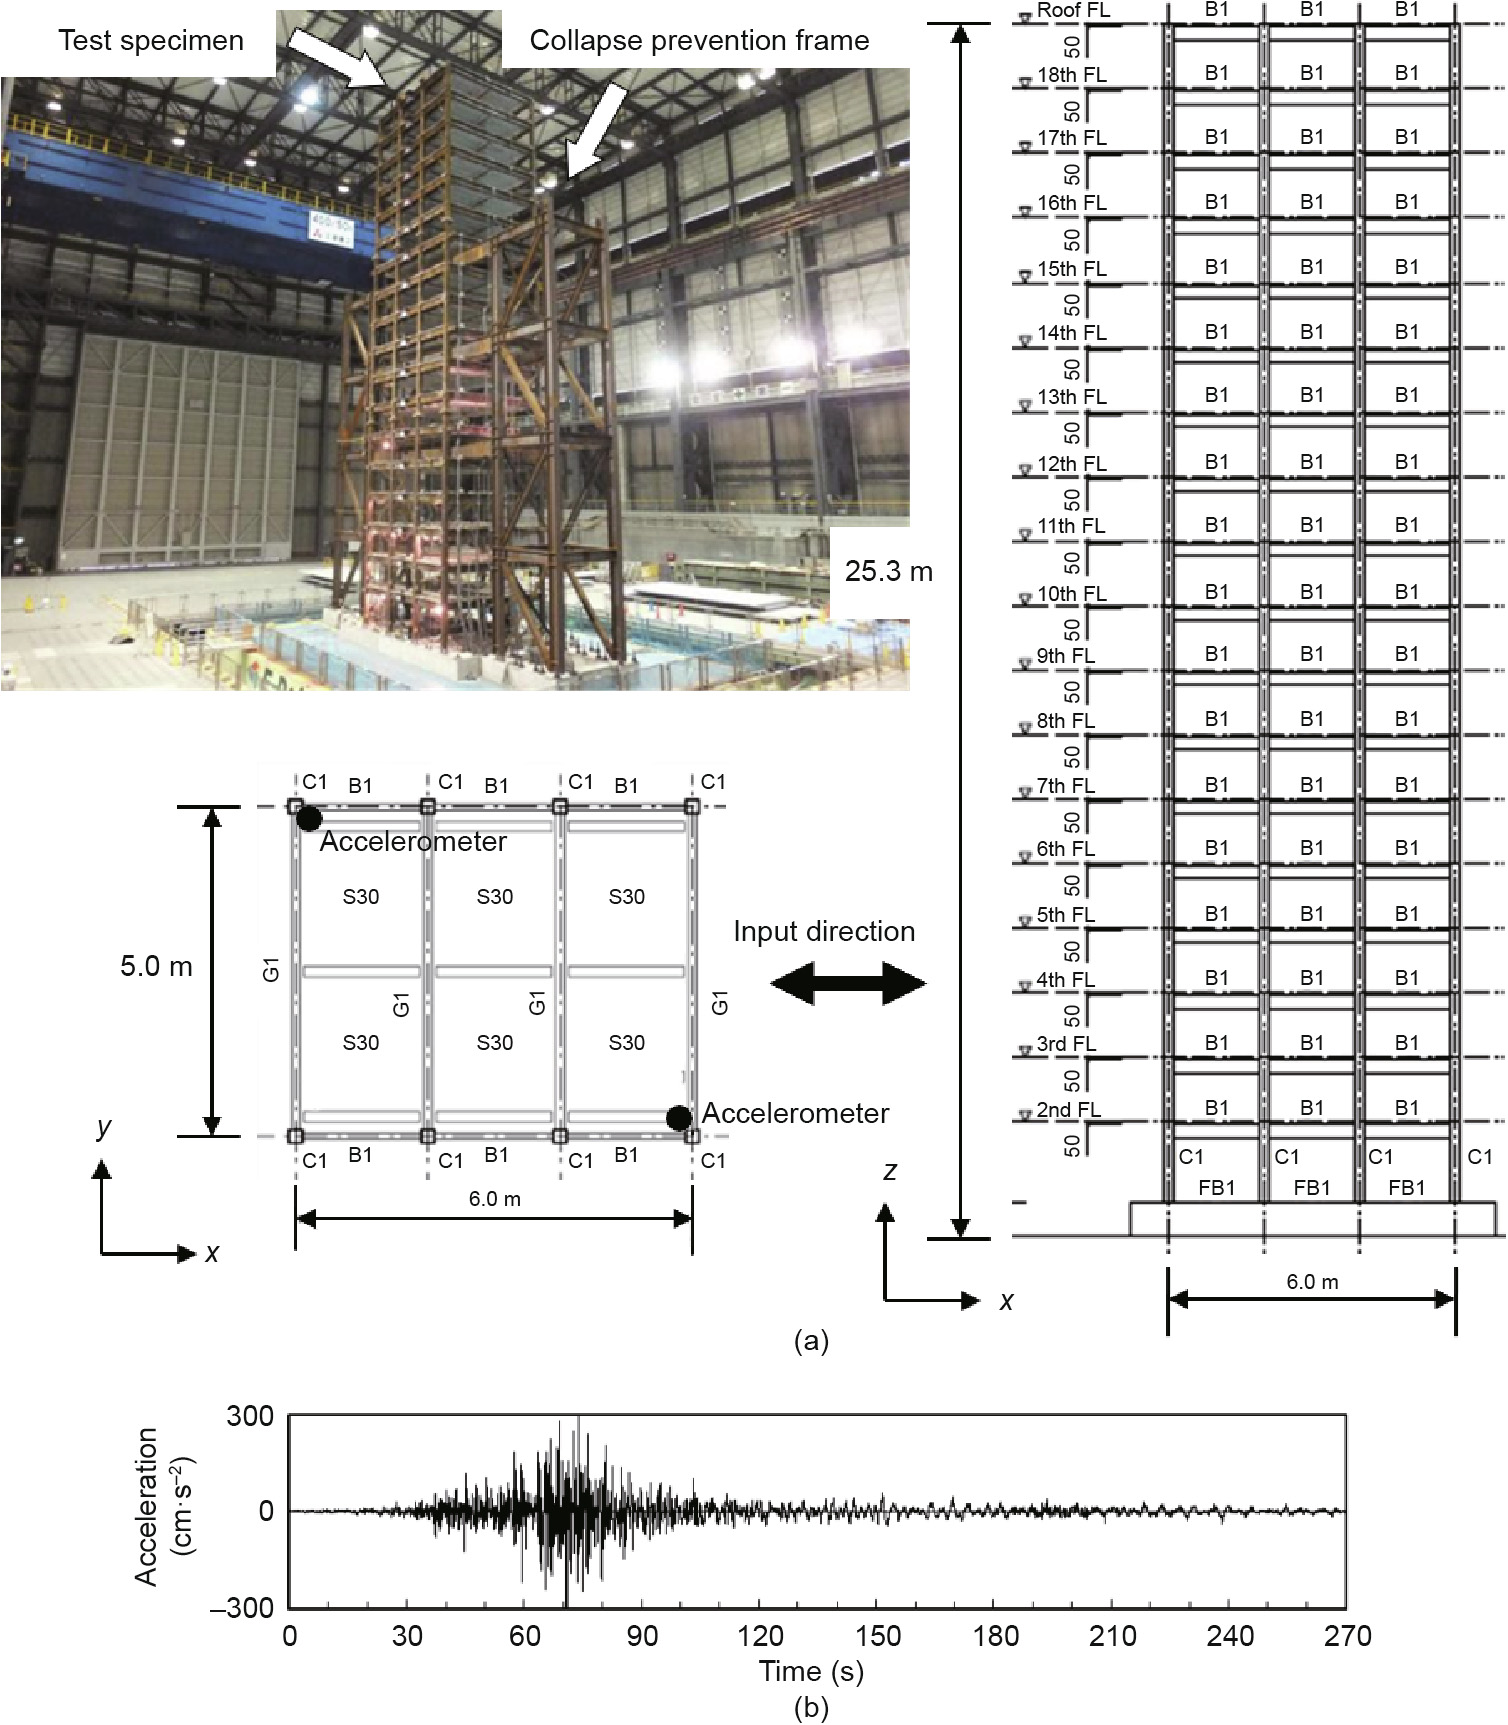
Fig 27. (a) Overview of test specimen (B: bays; C: column; S30: slab; FB: footing beam); (b) input acceleration under pSv110-1. FL: floor.
《Table 4》
Table 4 Shaking table tests for a 1/3 scale 18-story steel specimen.


The analysis is conducted by first modeling the building as a multi-degree of freedom system with a lumped floor mass and linear shear stiffness at each story. An undamped eigenvalue problem is obtained from the mass and stiffness matrices, and several lowest modes along with their modal amplitudes are estimated. The calculated modal amplitudes and the corresponding modal accelerations measured at the limited floors are fundamental information used to estimate the structural responses on all floors. Unlike Ikeda and Hisada [73], Morii et al. [74] assumed that the number of outputs is the same as the number of the selected lowest modes.
The lowest modal accelerations to the base can be obtained from Eq. (3), as follows:

where n is the number of measured outputs,  is the relative acceleration on the kth (k = 1, 2, ..., n) restricted floor to the ground base,
  is the jth modal relative acceleration to the ground, and
  is the modal participation factor of the kth restricted floor obtained through the initially assumed mass and stiffness matrices. After the modal accelerations are obtained, the proposed process is similar to the one used in Ref. [73].
In the applications to the test specimen, the accelerations are measured on the 1st, 4th, 10th, 15th, and 19th floors. Until the pSv340-1 excitation, the method shows good agreement of the estimated responses with the observed responses on the measured floors. The method proposed in Ref. [73] applied the same shaking table tests [77]. The use of the cubic spline interpolation is proposed by Kodera et al. [78] to estimate the drift deformation in all stories with the known information of the accelerations from a limited number of floors.
For a tall steel building, previous studies prove that the acceleration and displacement on each floor can be estimated using accelerations on some floors when the inter-story displacement is between 1/50 and 1/30. The accuracy of these estimations may be within an error of 20% for the maximum response at each floor. Even if the structure becomes nonlinear during a large earthquake, modal analysis of the structure responses is still useful for the analysis of tall steel buildings.
The dependency of equivalent modal properties on structural response amplitude is discussed in the follow. The monitoring and system identification results from tall steel buildings show that the linearly equivalent modal properties depend on the seismic response amplitudes [79–81]. Fig. 28 shows the modal identification results in the lowest three vibration modes of the 29-story building shown in Fig. 26. The red triangles are plotted on the directly measured accelerations on the 29th floor, and the black dots are plotted on the modal accelerations, which are passed through the corresponding bandpass filters. Herein, ω is the equivalent natural frequency, ξ is the corresponding damping ratio,  is the absolute acceleration, and R2 is the correlation coefficient between the identified values and the response accelerations. With an increase of the maximum acceleration amplitude, the equivalent natural frequencies decrease, and the corresponding damping ratios increase. However, the damping ratios have more variance than the natural frequencies. The damping ratios show a decrease in amplitude after an initial increase, which was pointed out based on the previous identification results for several high-rise buildings [82]. The natural frequencies are highly correlated to the logarithm of the maximum accelerations. In the first mode, the natural frequency has a higher correlation with the modal acceleration than with the directly measured acceleration.
《Fig. 28》

Fig. 28. Acceleration dependency of the modal properties in the EW direction for: (a) first mode; (b) second mode; and (c) third mode.
Through many measurements taken before and after the Great East Japan (Tohoku) Earthquake, a similar amplitude dependency of the natural frequencies was found in a 15-story building in Sendai City, 20-story and 21-story buildings in Tokyo, and a 23-story building in Yokohama City [79]. These tall buildings show nonlinear responses even when the displacements are small, which is not considered in the general structural design, assuming linearity within a certain range of displacements.
《4. Conclusions》
4. Conclusions
This paper provides a review on the development of structural monitoring of bridges and buildings in Japan from the authors’ perspective. From a historical standpoint, structural monitoring in Japan has placed stronger emphasis on structural evaluation against extreme events, which is a rational choice considering the harsh environmental conditions that prevail in Japan, such as high seismic activity and strong wind. In the initial development of structural monitoring systems, monitoring data was utilized to verify design assumptions, update specifications, and facilitate the efficacy of vibration control in passive, semi-active, and active systems. Later, monitoring systems were employed to evaluate structural performance under various environmental and loading conditions, and to detect possible structural deterioration over the lifetime of structures. Monitoring systems can also be employed as a basis from which to investigate causes and make decisions regarding required repair and/or retrofitting. More recent interest in monitoring has focused on further extending its application to operation and maintenance, through the rationalization of risk and asset management by monitored data.
This paper describes representative examples of structure monitoring by means of distributed sensor arrays for bridges and buildings, as well as monitoring using vehicles for bridge pavement and slabs. Monitoring has evolved from campaign-type monitoring to the continuous and permanent-type monitoring systems throughout the lifetime of structures, where continuous monitoring data provides information on structures’ behavior under various loading and environmental conditions, including unexpected extreme events. Such systems have been shown to be particularly useful for understanding real structural behaviors in depth, revealing unknown factors that were not considered in the design, and providing structural information for necessary retrofitting after extreme events. The monitoring of environmental conditions is becoming increasingly important for the evaluation of structures’ durability.
We expect and anticipate more developments in structural monitoring in Japan. There are at least two developmental fronts at present: advancements in sensing technology; and advancement in methodologies for data acquisition, analysis, and management. The development of sensors toward more robust and reliable wireless sensors is expected to facilitate more extensive use of wireless sensor networks in the monitoring of large structures. This can be achieved through faster communication, faster data transmission, and more efficient power consumption. Other methodologies are also expected to enhance or complement the current vibrationbased monitoring systems, such as non-contact vibration monitoring using laser technology or unmanned aerial vehicles (UAVs), and visual-based monitoring using high-precision cameras. New developments are also occurring in data acquisition, analysis, and management. The increase in sensors’ capacity and capability means that more data is now available, requiring a smart approach to effectively curate useful data for structural assessment. Hence, developments in data mining and feature extraction using advanced techniques from other fields of study—such as machine learning and deep learning in computer science—are important for more efficient and effective data management. In line with this, structural monitoring is expected to become an integral part of structural engineering, with the benefits of monitoring over the lifetime of a structure justifying the installment cost. This trend emphasizes the need for structural monitoring to shift from the fashionable (‘‘nice to have”) paradigm to the essential (“important to have”) paradigm.
《Acknowledgements》
Acknowledgements
The authors gratefully acknowledge the support and courtesy of the Honshu–Shikoku Bridge Authority and the Metropolitan Expressway Co. Ltd, for the materials related to the works presented in this paper. We also gratefully acknowledge contributions from the following individuals in providing relevant materials for the completeness of this paper: Dr. Masato Abe of BMC Corporation, Japan, Dr. Hitoshi Yamada and Dr. Hiroshi Katsuchi of Yokohama National University, and Dr. Masaaki Yabe and Mr. Kenji Namikawa of Metropolitan Expressway Co. Ltd.
《Compliance with ethics guidelines》
Compliance with ethics guidelines
Yozo Fujino, Dionysius M. Siringoringo, Yoshiki Ikeda, Tomonori Nagayama, and Tsukasa Mizutani declare that they have no conflict of interest or financial conflicts to disclose.


 京公网安备 11010502051620号


