

《1. Introduction》
1. Introduction
At the end of 2019, the coronavirus disease 2019 (COVID-19) was reported [1–4]. On 24 January 2020, Huang et al. [5] summarized the clinical characteristics of 41 patients with COVID-19, indicating that the common onset symptoms were fever, cough, myalgia, or fatigue. All 41 of these patients had pneumonia, and their chest computed tomography (CT) examination showed abnormalities. Complications included acute respiratory distress syndrome, acute heart injury, and secondary infections. Thirteen (31.7%) patients were admitted to the intensive care unit (ICU), and six (14.6%) died. Chan et al. [6] at the University of Hong Kong, China found evidence of human-tohuman transmission of COVID-19 for the first time.
The Diagnosis and treatment protocol for novel coronavirus pneumonia (trial version 7) [7] recommended the etiological confirmation of patients with COVID-19 by means of two technologies: nucleic acid testing or specific antibody testing. The accessibility of nucleic acid testing has greatly improved in the past three months, but shortcomings still exist, such as high operating requirements, a time-consuming procedure, and a relatively low positive rate [8,9]. A study from Wuhan showed that the positive rate of nucleic acid testing from oral swabs, anal swabs, and the blood of infected patients was 53.3%, 26.7%, and 40.0% respectively [10]. Furthermore, antibody detection is not appropriate for early screening, since there is a window phase for antibodies testing. Long et al. [11] reported that the median time of seroconversion for both immunoglobulin G (IgG) and IgM was about 13 d post onset.
At the same time, radiology experts noticed that the manifestations of COVID-19 cases as seen through CT imaging had their own characteristics, which differed from those of the CT imaging manifestations of other viral pneumonias, such as influenza-A viral pneumonia (IAVP), as shown in Fig. 1. Therefore, clinical doctors chose to replace nucleic acid testing with lung CT imaging as one of the early diagnostic criteria for this new type of pneumonia [12], with the aim of immediately curbing transmission.
《Fig. 1》

Fig. 1. Typical transverse-section CT images: (a) COVID-19; (b) IAVP; and (c) no pneumonia manifestations. Both (a) and (b) were taken within 10 d from the onset of the symptoms.
With the rapid development of computer technology, digital image processing technology has been widely applied in the medical field, including organ segmentation and image enhancement and repair, thereby providing support for subsequent medical diagnosis [13,14]. Deep learning technologies, such as the convolutional neural network (CNN) with its strong ability of nonlinear modeling, have also been applied extensively in medical image processing [15–18]. Relevant studies have been conducted on the diagnosis of pulmonary nodules [19], the classification of benign and malignant tumors [20,21], and pulmonary tuberculosis analysis and disease prediction [22–24] worldwide.
In this study, multiple CNN models were used to classify CT image datasets and calculate the infection probability of COVID19. These findings might greatly assist in the early screening of patients with COVID-19.
《2. Materials and methods》
2. Materials and methods
《2.1. Study dataset》
2.1. Study dataset
A total of 618 transverse-section CT samples were collected in this study, including 219 from 110 patients (mean age 50 years; 63 (57.3%) male patients) with COVID-19 from the First Affiliated Hospital, College of Medicine, Zhejiang University; Wenzhou Central Hospital; and the First People’s Hospital of Wenling from 19 January to 14 February 2020. All three hospitals are designated COVID-19 hospitals in Zhejiang Province. Every COVID-19 patient was confirmed with real-time reverse transcription-polymerase chain reaction (RT-PCR) testing from sputum or nasopharyngeal swab, and cases with no image manifestations on the chest CT images were excluded. In addition, there was a gap of at least two days between CT datasets scanned from the same patient in order to ensure the diversity of samples. The remaining 399 CT samples were collected from the First Affiliated Hospital, College of Medicine, Zhejiang University as the controlled experiment group. Of these, 224 CT samples were from 224 patients (mean age 61 years; 156 (69.6%) male patients) with IAVP including H1N1, H3N2, H5N1, H7N9, and so forth; 175 CT samples (mean age 39 years; 97 (55.4%) male patients) were from healthy people. The diagnosis of IAVP was proved by the RT-PCR detection of viral RNA from sputum or nasopharyngeal swab. There were 198 (90.4%) COVID-19 and 196 (87.5%) IAVP cases in early or progressive stages; the remaining 9.6% and 12.5% cases, respectively, were in the severe stage; no significant differences of stages between two diseases. IAVP CT samples were used because it was critical to distinguish IAVP from patients with suspected COVID-19 currently in China.
The ethics committee of the First Affiliated Hospital, College of Medicine, Zhejiang University approved this study, and the research was performed in accordance with relevant guidelines and regulations. All participants and/or their legal guardians signed an informed consent form before the study took place.
A total of 528 CT samples (85.4%) were used for training and validation sets, including 189 samples from patients with COVID19, 194 samples from patients with IAVP, and 145 samples from healthy people. The remaining 90 CT sets (14.6%) were used as the test set, including 30 COVID-19 cases, 30 IAVP cases, and 30 healthy cases. Furthermore, the test cases of the CT set were selected from people who had not been included in the training stage.
《2.2. Process》
2.2. Process
Fig. 2 shows the whole process of COVID-19 diagnostic report generation in this study. First, the CT images were preprocessed to extract the effective pulmonary regions. Second, a threedimensional (3D) CNN segmentation model was used to "segment” multiple candidate image cubes. The center image together with its two neighbors of each cube was collected for further steps. Third, an image classification model was used to categorize all the image patches into three types: COVID-19, IAVP, and irrelevant to infection (ITI). Image patches from the same cube "voted” for the type and confidence score of this candidate as a whole. Finally, the overall analysis report for one CT sample was calculated using the Noisy-OR Bayesian function [25].
《Fig. 2》
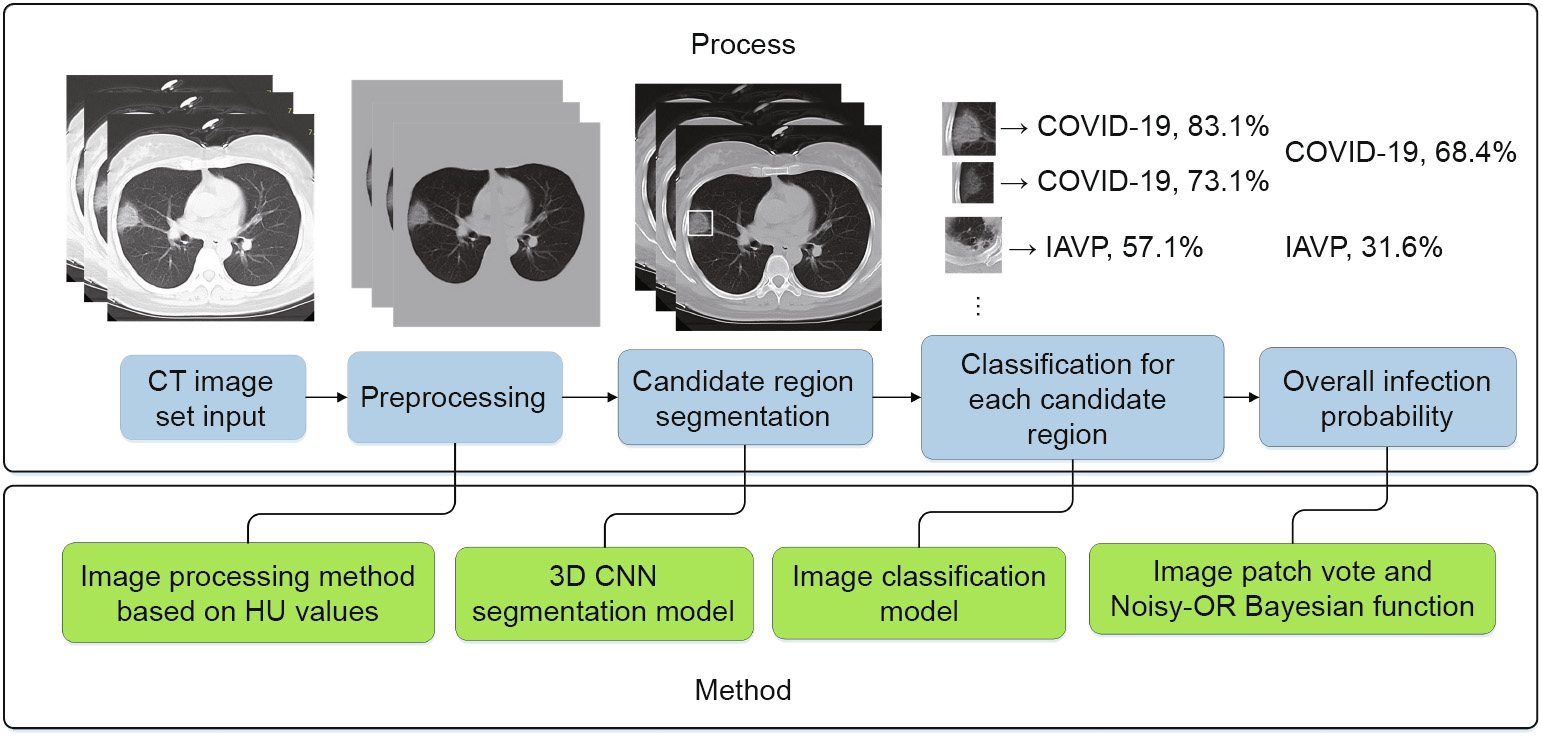
Fig. 2. Process flow chart—take one COVID-19 case as example. HU: Hounsfield unit.
《3. Theory and calculation》
3. Theory and calculation
《3.1. Dataset preprocessing and candidate region segmentation》
3.1. Dataset preprocessing and candidate region segmentation
The study was expedited by using the same method and models for the data preprocessing and candidate region segmentation stages as those used in a previous study on pulmonary tuberculosis [23]. The focus of the infections from pulmonary tuberculosis had multiple structures and types, including miliary, infiltrative, caseous, tuberculoma, and cavitary. The model, VNet–inceptionresidual network (IR)–region proposal network (RPN) [23], used a VNet [26] backbone with an IR [27] structure as the featureextracting part, which was followed by an RPN to segment candidate regions. Although it was trained for the purpose of pulmonary tuberculosis detection, the model was verified by professional radiologists to be good enough to separate candidate patches for viral pneumonia.
The 3D segmentation process mentioned here is not a traditional pixel-level segmentation operation such as VNet or 3D u-net [28]. As the border between a healthy region and the focus of infection is usually blurred and indistinct, it was extremely difficult to label pixel-level masks for lesion regions of the pneumonia. The variable 3D structures of the lesion regions also aggravated this work. Therefore, the segmentation operation used here was more like the operations in an object-detection algorithm. An RPN structure was used to capture the region of interest with 3D bounding boxes instead of pixel-level segmented masks.
Moreover, in the study of pulmonary tuberculosis, the VNet–IR– RPN model was used for both segmentation and classification. Only the segmentation-related bounding box regression part was preserved, regardless of the classification results, because only the former task was required at this stage in this study.
《3.2. Image data processing and augmentation》
3.2. Image data processing and augmentation
A large number of non-infection regions irrelevant to this study were also separated using the 3D CNN segmentation model, including the pulmonary fibrotic structure, calcification spots, and healthy regions that had been identified incorrectly. Therefore, the extra category of ITI was added to the COVID-19 and IAVP categories.
This study included 618 CT samples (219 COVID-19, 224 IAVP, and 175 healthy cases). Subsequently, a total of 3957 candidate cubes were generated from the 3D CNN segmentation model. Only the territory close to the middle of this cube contained maximum information about the focus of infection. Hence, only the center image together with its two neighbors of each cube was collected to represent this region for further classification steps. Next, all image patches were manually classified by two professional radiologists into two types: ITI and pneumonia. The images in the latter category were recognized automatically as COVID-19 or IAVP based on the clinical diagnosis results.
A total of 11 871 image patches were acquired from the aforementioned steps, including 2634 COVID-19, 2661 IAVP, and 6576 ITI. According to the previous dataset assignment, the training and validation sets had 528 CT samples, which were equivalent to 10 161 (85.6%) images, including 2301 COVID-19, 2244 IAVP, and 5616 ITI images. The remaining 1710 (14.4%) images were reserved for the test dataset.
The sampling possibility of the COVID-19 and IAVP cases was expanded three times to balance the specimen number of ITI cases, in order to reduce the influence of the uneven distribution of different image types on the present dataset. At the same time, generic data-expansion mechanisms, such as random clipping, left–right flipping, up–down flipping, and mirroring operation, were performed on specimens to increase the number of training samples and prevent data overfitting.
《3.3. Deep learning model for classification》
3.3. Deep learning model for classification
3.3.1. Location-attention classification
The work of Kanne [29] and Chung et al. [30] has shown at least three distinguishing features of COVID-19: a ground-glass appearance, peripheral distribution along with the pleura, and usually more than one independent focus of infection in a single case, as shown in Fig. 3.
The models were optimized based on these findings. The image classification model was designed to distinguish the appearance and structure of different infections. Moreover, relative distance from the edge was used as an extra weight for the model in order to learn the relative location information of the patch on the pulmonary image. Focuses of infection that were located close to the pleura were more likely to be recognized as COVID-19.
The relative distance from the edge of each patch was calculated as follows:
Step 1: Measure the minimum distance from the mask to the center of the patch (double-headed arrow in Fig. 3(c)).
Step 2: Obtain the diagonal of the minimum circumscribed rectangle of the pulmonary image (Fig. 3(d)).
Step 3: Obtain the relative distance from the edge by dividing the distance from Step 1 by the diagonal from Step 2.
《Fig. 3》
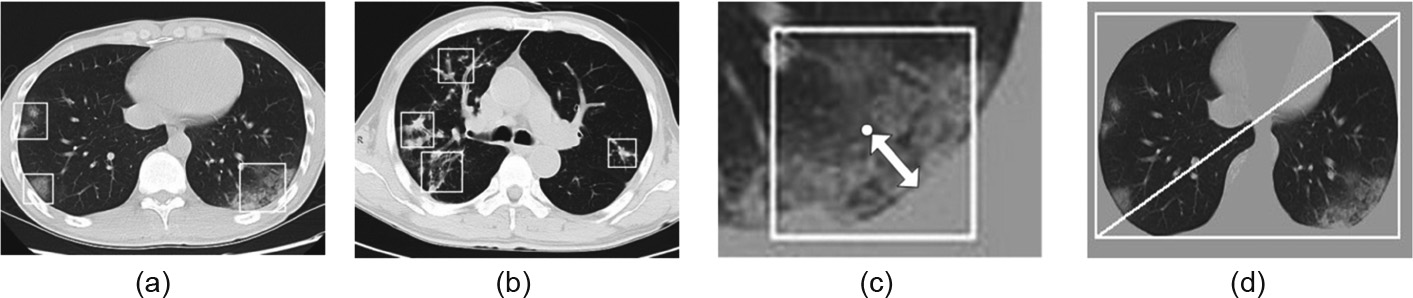
Fig. 3. (a) COVID-19 image with three ground-glass focuses of infections; (b) IAVP image with four focuses of infections; (c) the minimum distance from the mask to the center of the patch (double-headed arrow); (d) diagonal of the minimum circumscribed rectangle of the pulmonary image.
3.3.2. Network structure
Two classification models were evaluated in this study, as shown in Fig. 4. One was a relative traditional residual network (ResNet)-based [31] model and the other was designed based on the first network structure by concatenating the locationattention mechanism in the full-connection layer to improve the overall accuracy rate. This mechanism was added to the first fullconnection layer to maximize the influence of this factor on the whole network.
《Fig. 4》

Fig. 4. The network structure of traditional ResNet-18-based classification model (without the relative distance-from-edge mechanism). The location-attention classification model was built on the backbone of ResNet-18 by concatenating the location-attention mechanism in the full-connection layer to improve the overall accuracy rate. Conv2D: convolution 2D.
The classical ResNet-18 network structure was used for image feature extraction. Pooling operations were also used for the dimensional reduction of data in order to prevent overfitting and improve the problem of generalization.
The output of the convolution layer was flattened to a 256- dimensional feature vector and then converted into a 16- dimensional feature vector using a full-connection network. For the location-attention classification model, the value of the relative distance from the edge was first normalized to the same order of magnitude, and then concatenated to this full-connection network. Next, three full-connection layers were followed to output the final classification result together with the confidence score.
《3.4. Diagnostic report》
3.4. Diagnostic report
3.4.1. "Voting” for each candidate region
Inspired by the theory of the Bagging prediction algorithm [32] in machine learning technology, one candidate region was represented by three image patches: the center image and its two neighbors. These three images "voted” for the whole region according to the following strategies:
(1) If at least two images were categorized into the same type, then the image with the maximum confidence score in this type was selected.
(2) Otherwise, the image with the maximum confidence score was picked (no type dominated).
Regions that "voted” as the ITI type were ignored in the next step.
3.4.2. Noisy-OR Bayesian function to deduce the overall report
One of the remarkable features of COVID-19 is that there is more than one independent focus of infection in a single CT case [29,30]. It is reasonable for the overall probability to be much larger than 50% if a patient has two COVID-19 regions, both having a 50% probability. Accordingly, the total infection confidence score (C) for one infection type was calculated using the probability formula of the Noisy-OR Bayesian function as follows:
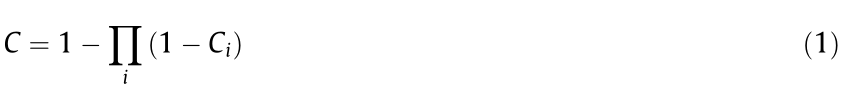
where Ci represents the confidence of the ith region.
The confidence scores of two types, CCOVID-19 and CIAVP, were deduced accordingly; this CT sample was then categorized into the corresponding group according to the dominating C value.
Moreover, the following strategies were used to export the confidence possibility of an entire CT sample to provide a reasonable reference for clinical doctors:
(1) If both CCOVID-19 and CIAVP were equal to 0, then this CT sample belonged to the healthy case.
(2) If one of the C values was equal to 0, then the other C value was exported directly as the confidence possibility of this CT sample.
(3) Otherwise, the softmax function was used to generate two confidence scores.
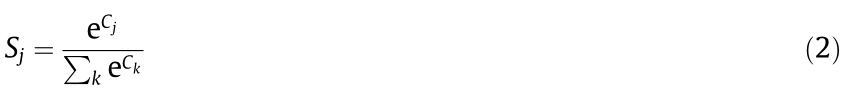
where j, k  (COVID-19, IAVP). Sj was exported as the confidence score for each type of infection. The softmax operation normalized the sum of Sj to 100% and did not alter the judgment result for infection types. However, manual investigation should be involved from the perspective of clinical doctors, as some COVID-19 suspected regions were captured by the models even though they might not be the majority type.
《4. Results》
4. Results
《4.1. Evaluation platform》
4.1. Evaluation platform
An Intel i7-8700k central processing unit (CPU) with NVIDIA graphics processing unit (GPU) GeForce GTX 1080ti was used as the testing server. The processing time largely depended on the number of image layers in one CT set. On average, it took less than 30 s for a CT set with 70 layers to go from data preprocessing to the output of the report.
《4.2. Training process》
4.2. Training process
As one of the most classical loss functions used in classification models, cross entropy was used in this study. When the epoch number of training iterations increased to more than 1000, the loss value did not obviously decrease or increase, suggesting that the models converged well to a relative optimal state without distinct overfitting. The training curves of the loss value and the accuracy rate for two classification models are shown in Fig. 5. The model with the location-attention mechanism achieved better performance on the training dataset, in comparison with the original ResNet.
《Fig. 5》

Fig. 5. Training curve of (a) loss and (b) accuracy rate for the two classification models.
《4.3. Performance on test dataset》
4.3. Performance on test dataset
4.3.1. Performance measurement
A confusion matrix was used, which is a table that is often used to describe the performance of a classification model on test dataset for which the true values are known. It allows the visualization of the performance of an algorithm.
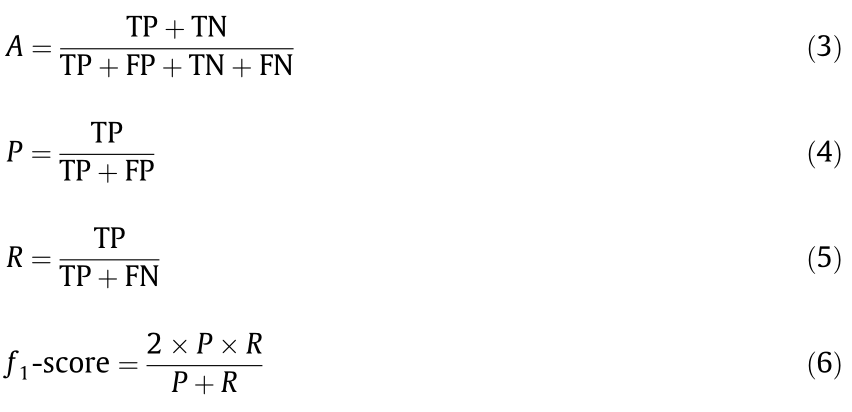
The accuracy (A) of a method determines how correct the predicted values are. Precision (P) determines the reproducibility of the measurement, or how many of the predictions are correct. Recall (R) indicates how many of the correct results are discovered. The f1-score uses a combination of precision and recall to calculate a balanced average result. The following equations show how to calculate these values, where TP, TN, FP, and FN are true positive, true negative, false positive, and false negative, respectively.
4.3.2. Image preprocessing and segmentation
A total of 90 CT samples were randomly selected from each group (30 CT sets from COVID-19, 30 from IAVP, and 30 from healthy cases) for the test dataset. The choice of the test dataset followed the rule that any CT of this person had not been trained in the previous stage, in order to avoid having a similar CT that had been learned by the models. Moreover, the thresholds for both the image preprocessing and the segmentation were optimized to be more suitable for the current study. In the image preprocessing stage, the threshold of the Hounsfield unit (HU) value, which was used to binarize the resampled images, was raised to –200 in order to maximize the filtering out of valid lung. The segmentation model VNet–IR–RPN was configured to reduce the proposal’s threshold to maximize separate candidate regions, even through many normal regions could be included. We noticed that one CT case from the COVID-19 group that had no image patches was segmented as COVID-19 or IAVP, and was hence wrongly categorized as healthy case, as shown in Fig. 6. These focuses of infection were barely noticeable with the human eye, and seemed too tenuous to be captured by the segmentation model in this study.
《Fig. 6》
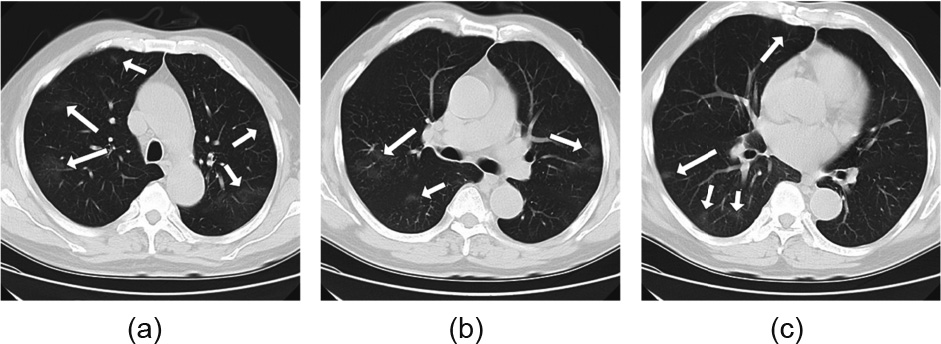
Fig. 6. All CT images (a–c) were from a single CT case. The focuses of infections were pointed out by arrows.
4.3.3. Classification for a single image patch
A total of 1710 image patches were acquired from 90 CT samples, including 357 COVID-19, 390 IAVP, and 963 ITI (ground truth). To determine the optimal approach, the design of each methodology was assessed using a confusion matrix. Two classification models were evaluated: with and without the locationattention mechanism, as shown in Tables 1 and 2.
《Table 1》
Table 1 Confusion matrix of two classification models for the COVID-19, IAVP, and ITI groups.
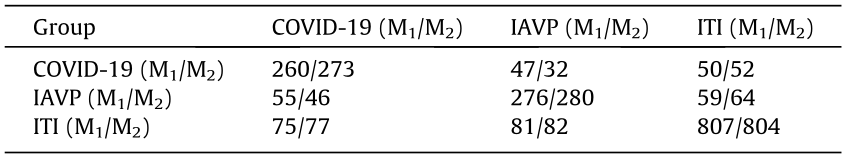
M1: the ResNet model; M2: the ResNet model with the location-attention mechanism.
《Table 2》
Table 2 Recall, precision, f1-score, and accuracy ratea of two classification models for the COVID-19, IAVP, and ITI groups.

a The overall accuracy rates of M1 and M2 for the three groups are 78.5% and 79.4%; the accuracy rates of M1 and M2 for COVID-19 and IAVP groups are 71.8% and 74.0%.
The average f1-score and the overall accuracy rate for the two models were 0.750/0.764 and 78.5%/79.4%, respectively. Furthermore, the location-attention mechanism was used to improve the respective accuracy rate of the COVID-19 and IAVP groups, and was shown to result in a remarkable improvement of 5.0% (260/273) and 1.4% (276/280). This evidence indicates that the second model with the location-attention mechanism achieved better performance. Therefore, that model was used for the rest of this study.
Moreover, as the ITI group was used to remove disturbing factors in this study, it was ignored and not counted by the Noisy-OR Bayesian function in the final step. To retain consistency in the next steps, we further compared the average f1-score and accuracy rate for the first two groups, which were 0.720 and 74.0%, respectively.
4.3.4. "Voting” for a region
Each image patch "voted” to represent the entire candidate region. A total of 570 candidate cubes were distinguished, including 119 COVID-19, 130 IAVP, and 321 ITI regions (ground truth). The confusion matrix of the voting result and the corresponding recall, precision, and f1-score are shown in Tables 3 and 4, respectively.
《Table 3》
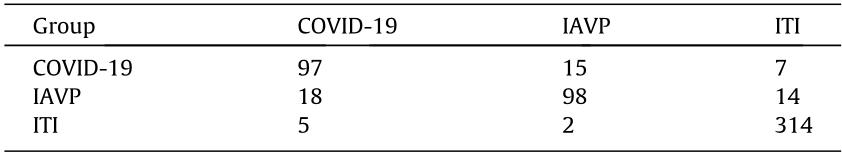
Table 3 Confusion matrix for the COVID-19, IAVP, and ITI groups after voting.
《Table 4》
Table 4 Recall, precision, f1-score, and accuracy ratea for the COVID-19, IAVP, and ITI groups after voting.

a The overall accuracy rate for the three groups was 89.3%; and the average accuracy rate for COVID-19 and IAVP groups was 78.3%.
The average f1-score and overall accuracy rate for the three categories were 0.856 and 89.3%, respectively, which showed a respective improvement of 12.0% and 12.5% when compared with the previous step. As for the first two groups, the average f1-score and accuracy rate were 0.806 and 78.3%, respectively, which showed a respective increase of 11.9% and 5.8%.
4.3.5. Result of the classification of CT samples as a whole
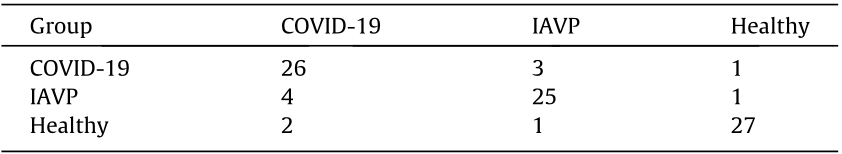
Noisy-OR Bayesian function was used to identify the dominating infection types. Three kinds of results were exported in the final report: COVID-19, IAVP, and healthy cases. The experimental results are summarized in Tables 5 and 6.
《Table 5》
Table 5 Confusion matrix of the export of the Noisy-OR Bayesian function for COVID-19, IAVP, and healthy cases.
《Table 6 》
Table 6 Recall, precision, f1-score, and accuracy ratea of the export of the Noisy-OR Bayesian function for COVID-19, IAVP, and healthy cases.
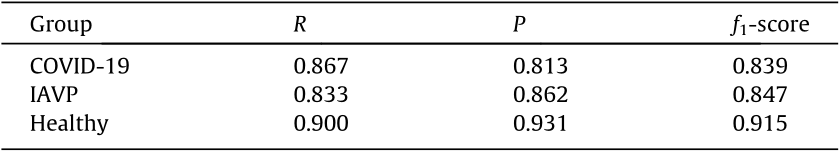
a The overall accuracy rate for the three groups is 86.7% and the average accuracy rate for COVID-19 and IAVP groups was 85.0%.
Only the average f1-scoreand the accuracy rate of the COVID-19 and IAVP groups were counted to compare with the previous results. These were 0.843 and 85.0%, respectively, which showed a promotion of 4.6% and 8.6% in this step.
A consistent improvement of the average f1-score and accuracy rate was observed. The accuracy rate of the classification of COVID19 and IAVP was promoted from 74.0% (single image patch) to 78.3% (image cube), and then to 85.0% (overall CT case based on the dominating infection types). Measured by all three benchmark groups, the overall classification accuracy rate was 86.7%.
Moreover, a series of images with highlighted focuses of infection would also be exported (examples shown in Fig. 7).
《Fig. 7》

Fig. 7. Examples of two CT cases reports with bounding boxes on the original images to highlight the focus of infections. Images (a)–(c) are from one case of IAVP. Images (d)–(f) are from one case of COVID-19. The segmented region of pulmonary was an image cube and only the center image was marked with a bounding box to facilitate the interpreting of the lesions.
《5. Discussion》
5. Discussion
COVID-19 has caused serious public health and safety problems, and hence has become a global concern [33–35]. In the early stage of COVID-19, some patients may already have positive pulmonary imaging findings but no sputum or negative nucleic acid testing results from sputum or nasopharyngeal swabs. These patients are not diagnosed as suspected or confirmed cases. Thus, they are not isolated or treated in a timely manner, making them potential sources of infection. Meanwhile, CT examination is routinely performed on every patient with fever and respiratory symptoms in the early stage, and is repeated for dynamic observation, since it is cheap and easy to operate. Using CT images to screen patients can improve the early detection of COVID-19, and ease the pressure on laboratory nucleic acid testing.
The CT imaging of COVID-19 presents several distinct manifestations, according to previous studies [29,30,36]. These manifestations include focal ground-glass shadows mainly distributed along the pleura, multiple consolidation shadows accompanied by the "halo sign” of the surrounding ground-glass shadow, multiple consolidations of different sizes, and grid-shaped high-density shadows. An experienced radiologist can make judgments on the possibility of COVID-19 based on his or her clinical experience; however, such judgments are easily influenced by subjective factors and individual proficiency. In comparison, deep-learningsystem-based screen models reveal more specific and reliable results by digitizing and standardizing the image information. Hence, they can assist physicians in making a clinical decision more accurately.
There have been many precedents for artificial intelligence (AI)-assisted models that are now widely used in clinical practice, such as the pulmonary nodules diagnostic system. In June 2019, Ardila et al. [20] proposed a deep learning algorithm that used a patient’s current and prior CT volumes to predict the risk of lung cancer. This model achieved an accuracy rate of nearly 94.4% on 6716 cases, and performed similarly on an independent clinical validation set of 1139 cases. In addition to having high accuracy rate, an AI-assisted model can do the work faster and more efficiently than a human.
In this study, deep learning technology was used to design a classification network for distinguishing COVID-19 from IAVP. In terms of the network structure, the classical ResNet was used for feature extraction. A comparison was made between models with and without an added location-attention mechanism. The experiment showed that the aforementioned mechanism could better distinguish COVID-19 cases from others. Furthermore, multiple enhancement methods were involved in our study, such as image patch vote and Noisy-OR Bayesian function, in order to determinate the dominating infection types. All these efforts produced a consistent improvement in the average f1-score and accuracy rate.
This study has some limitations. First, the manifestations of COVID-19 may have some overlap with the manifestations of other pneumonias such as IAVP, organizing pneumonia, and eosinophilic pneumonia. We only compared the CT manifestation of COVID-19 with that of IAVP. A clinical diagnosis of COVID-19 still needs to combine the patient’s contact history, travel history, first symptoms, and laboratory examination. Second, the number of model samples was limited in this study. The number of training and test samples should be expanded to improve the accuracy in the future. More multi-center clinical studies should be conducted to cope with the complex clinical situation. Moreover, efforts should be made to improve the segmentation and classification model. A better exclusive model could be designed for training, the segmentation and classification accuracy of the model could be improved, and the generalization performance of this algorithm could be verified with a larger dataset.
《6. Conclusions》
6. Conclusions
In this multi-center case study, we presented a novel method that can screen CT images of COVID-19 automatically by means of deep learning technologies. Models with a location-attention mechanism can classify COVID-19, IAVP, and healthy cases with an overall accuracy rate of 86.7%, and would be a promising supplementary diagnostic method for frontline clinical doctors.
《Acknowledgements》
Acknowledgements
This study was supported by the National Science and Technology Major Project of China (20182X10101-001).
《Authors’ contribution》
Authors’ contribution
Wei Wu, Tingbo Liang, Lanjuan Li, and Xiaowei Xu initiated the project and provided clinical expertise and guidance on the study design. Xukun Li and Peng Du designed the network architecture and data/modeling infrastructure, training, testing setup, and statistical analysis. Xiaowei Xu, Wei Wu, Xukun Li, and Peng Du wrote the manuscript. Xiangao Jiang, Chunlian Ma, Shuangzhi Lv, Liang Yu, Yanfei Chen, Junwei Su, Guanjing Lang, Yongtao Li, Hong Zhao, Kaijin Xu, and Lingxiang Ruan collected the datasets and interpreted the data. Xiaowei Xu, Xiangao Jiang, Chunlian Ma, and Peng Du contributed equally to this article.
《Compliance with ethics guidelines》
Compliance with ethics guidelines
Xiaowei Xu, Xiangao Jiang, Chunlian Ma, Peng Du, Xukun Li, Shuangzhi Lv, Liang Yu, Qin Ni, Yanfei Chen, Junwei Su, Guanjing Lang, Yongtao Li, Hong Zhao, Jun Liu, Kaijin Xu, Lingxiang Ruan, Jifang Sheng, Yunqing Qiu, Wei Wu, Tingbo Liang, and Lanjuan Li declare that they have no conflict of interest or financial conflicts to disclose.


 京公网安备 11010502051620号


