

《1. Introduction》
1. Introduction
Flexible displays are widely regarded as a future-oriented display technology [1–4]. Nevertheless, their reliability is notably affected by the permeation of water vapor and oxygen in the ambient environment, since the luminescent materials (e.g., organic light-emitting material, quantum dots) used for flexible display fabrication are usually sensitive to moisture and oxygen [5–7]. Thus, encapsulation films with superior barrier performance are of vital importance for promoting the stability and reliability of these devices [4]. Defined in terms of maximum water vapor transmission rate (WVTR), the barrier requirement for display devices ranges from 1×10⁻² g∙(m2 ∙d)–1 for liquid crystal displays (LCDs) to 1 10–6 g∙(m2 ∙d)–1 for organic light-emitting diodes (OLEDs)[8,9]. The high barrier required for OLEDs, known as ‘‘ultrabarrier” [9], is attributed with extremely low permeation rate (WVTR below 1×10⁻⁶ g∙(m2 ∙d)–1 ) as well as exceedingly long period (weeks or months) for permeation to reach a steady state [10–12]. In particular, the ultra-barrier permeation rate is even lower than the detection limits of commercially available instruments by MOCON [13] or Technolox [14]. Measurement of low gas permeation through a membrane is important in pilot plants [15] and tubing [16] as well. Therefore, the detection of ultra-barrier permeation, albeit important, is being significantly challenged by the very low detection limit as well as the prolonged period required for conditioning and measurement [17].
Several approaches have emerged for the permeation detection of water or other gases, including gravimetric techniques [18,19], calcium corrosion tests [5,10,20], the coulometric electrochemical method [12,13], and mass spectrometry [11,21–25]. However, the sensitivity of gravimetric techniques is low and the measurement period is long. Meanwhile, calcium corrosion tests [10] put high demands on test device fabrication and operator skills, while being unable to discriminate between water and oxygen. The use of a coulometric electrochemical sensor [13] involves a long measurement period and a high cost spent on commercial instruments such as MOCON; furthermore, the test accuracy for the ultrabarrier cannot be guaranteed.
Mass-spectrometry-based detection of WVTR benefits from the intrinsically high sensitivity and selectivity of the quadrupole mass spectrometer (QMS), as well as the extremely low background of water vapor that is achievable under an ultra-high vacuum (UHV). Such technique is potentially able to achieve very high sensitivity to trace amounts of water distinguished from other species [17]. However, the long period required for ultrabarrier permeation measurement remains unresolved [12]. Furthermore, the reliability of QMS detection of trace amounts of water is questionable from two aspects: ① The accuracy, stability, and linearity of the QMS signal must be calibrated for water vapor using a standard sample/device [24]; and ② a typical detection scheme for water permeation may involve significant artifacts in the QMS signal, due to variation in the detection background that may be orders of magnitude higher than the permeation signal [11]. The causes of background variation include fluctuation of the effective pumping speed [11,24] and accumulated inner-wall water adsorption [11]. In an ‘‘active pumping” scheme, in which permeation proceeds into a downstream volume that is being actively pumped, the effective pumping speed fluctuates under the changing gas load of permeation, thus affecting the equilibrium partial pressure and, ultimately, the measured permeation rate; conversely, in a ‘‘leak-up” scheme, permeation into an isolated volume leads to continuous change in the inner-wall water adsorption, which would cause severe and complex error in the detected permeation [11]. In this regard, an alternative detection scheme of programmed valving mass spectrometry (PVMS), based on the dynamic accumulation, detection, and pumping of the downstream volume [21], has a QMS signal that is independent of the pumping speed and the downstream volume cyclically pumped. Therefore, the use of PVMS could eliminate the influences of the fluctuating effective pumping speed as well as the continuous accumulation of water adsorption on the inner wall.
In this study, a PVMS detection scheme was coupled with predictive permeation models, allowing sensitive, efficient, and reliable methods to be developed to address the challenges of both the detection limit and the measurement period. Thus a QMSbased instrument, named ‘‘predictive instrument for the measurement of ultra-barrier permeation” (PI-MUP), was achieved, including enhanced sensitivity with improved reliability, a reduced measurement period, and efficient sample loading/ unloading. The system features a dual operation mode: a static mode in which the increase in partial pressure is continuously recorded due to permeation with active pumping, targeting higher permeation rates and validating the permeation model; and a dynamic mode based on time-integration of the permeation signal, with the aim of improved sensitivity for the detection of ultra-barrier permeation. The sensitivity of the system to water vapor was calibrated using a standard polymer sample. Predictive models of permeation measurement were developed in combination with WVTR measurement, in order to forecast the steadystate permeation rates based on non-steady-state results, thus allowing for significant reduction of the measurement period. The accuracy of the models was verified with experimental data, and their forecast capability was also demonstrated. In addition, a special sample fixture was developed, capable of differential pumping around the sealing edges of the test sample, resulting in a simplified system design with higher efficiency for sample loading/unloading. Finally, the system was applied to evaluate the barrier properties of Al2O3/SiNx stacks encapsulating an OLED device, and the test results agreed well with standard reliability aging (RA) measurements.
《2. Methods and setups》
2. Methods and setups
《2.1. Working principle》
2.1. Working principle
The basic setup for permeation measurement is schematically illustrated in Fig. 1. The detailed measurement principle has been explained elsewhere [21,22]. In brief, a thin membrane sample is mounted in between two separate vacuum chambers. Permeant gas is supplied into the upstream chamber with a constant pressure much higher than its partial pressure in the downstream chamber (pu  pd, in which pu (Torr, 1 Torr = 133.3224 Pa) is the upstream pressure and pd (Torr) is the downstream pressure). Driven by the partial pressure gradient across the sample, the permeation flow gradually increases over time until it reaches a steady-state level. The steady-state permeation rate is related to the upstream pressure by the following equation [26]:

where JS (mol∙(m2 ∙s)–1 ) is the steady-state permeation rate, D (m2 ∙s–1) is the diffusion coefficient, S (mol∙(m3 ∙Torr)–1 ) is the solubility coefficient, d (m) is the membrane thickness. The product DS is known as the permeability coefficient.
Before reaching steady state, the permeation rate as a function of time can be given by the following [26]:

where J(t) (mol∙(m2 ∙s)–1 ) is the permeation rate at time t (s).
Permeation into the downstream causes variation in the downstream partial pressure, which will be detected with QMS. In our approach, two modes of measurement are implemented: static mode and dynamic mode. A model was developed for each mode to elucidate the relationship between the permeation rate and the partial pressure signal recorded by QMS, based on the following assumptions: ① The permeation involves solution and diffusion processes for which Henry’s law and Fick’s law respectively apply; ② permeants in the downstream follow ideal gas behavior with minimum adsorption on the inner chamber wall; and ③ for the static mode, the effective pumping speed of the permeant remains consistent during the experiments.
《Fig. 1》
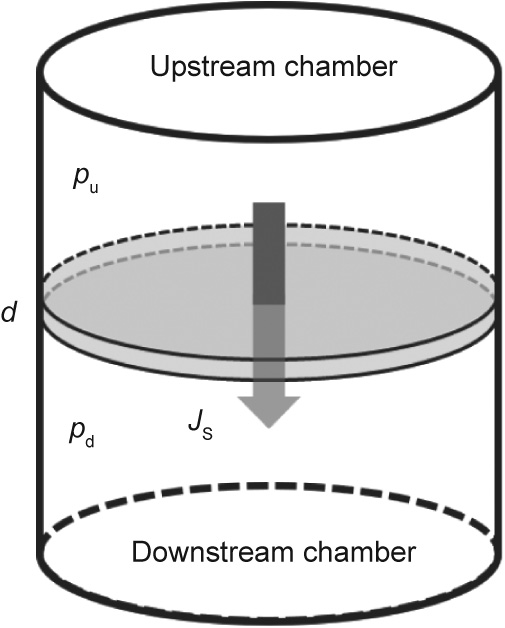
Fig. 1. Schematic setup for gas permeation measurement.
Under the static mode (Fig. 2(a)), permeants are directly detected by QMS in the downstream under continuous active pumping. The permeation rate at any instant (J(t)) can be correlated to the increase in partial pressure since time zero (Fig. 2(b)). According to the law of conservation of mass, the total amount of permeant molecules introduced into the downstream due to permeation over a time period (0–t) is the sum of the amount of molecules pumped away and remaining in the chamber:
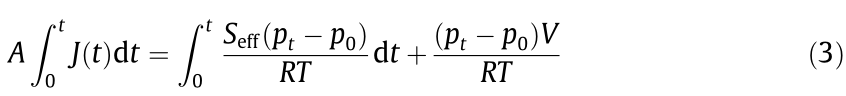
where Seff (m3 ∙s–1 ) is the effective pumping speed, p0 (Torr) is the initial partial pressure, pt (Torr) is the partial pressure at time t, R (m3 ∙Torr∙(mol∙K)–1 ) is the gas constant, T (K) is the temperature, V (m3 ) is the volume of the downstream chamber, and A (m2 ) is the permeation area. Combine Eqs. (2) and (3), and solve for pt :
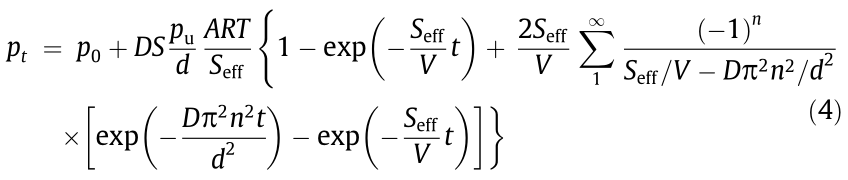
When permeation achieves steady state (t →  ), Eq. (4) becomes

The steady-state permeation rate JS can thus be derived from the steady-state value of the partial pressure pt according to the following:

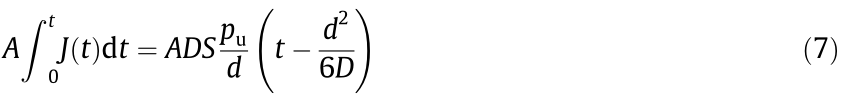
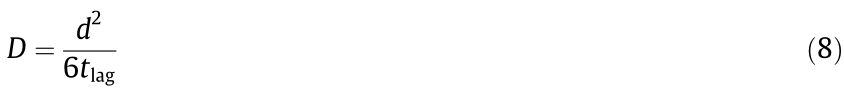
In order to measure the kinetics of permeation and to derive the diffusion coefficient, D, a lag time (tlag) is introduced [26,27]. Based upon the increase in the total amount of permeant molecules over time, tlag is obtained as the abscissa intercept of the steady-state linear increase (t → ):
D can then be calculated by the following:
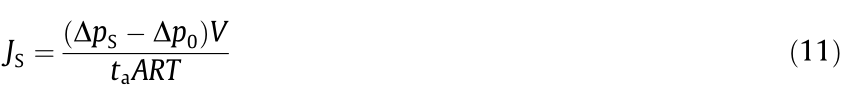
The dynamic mode is schematically shown in Fig. 2(c). The procedure starts by accumulating the permeant for a certain period (ta), before releasing it into an isolated volume for QMS detection. The isolated detection lasts for a detection period (td), which is followed by evacuating the entire downstream volume over an evacuation period (te). These three steps of accumulation, detection, and evacuation thus form a complete measurement cycle, which is continuously repeated as the permeation proceeds. For each cycle, the expected variation of the partial pressure recorded by QMS is schematically shown in Fig. 2(d). Upon initiation of the detection step, the exposure of the accumulated permeant to the QMS generates a partial pressure jump (△p), the magnitude of which gradually increases toward a steady-state level (△pS) as the permeation approaches steady state. The relationship between the detected pressure jump and the permeation rate can be empirically modeled by the following [21]:
《 Fig. 2》
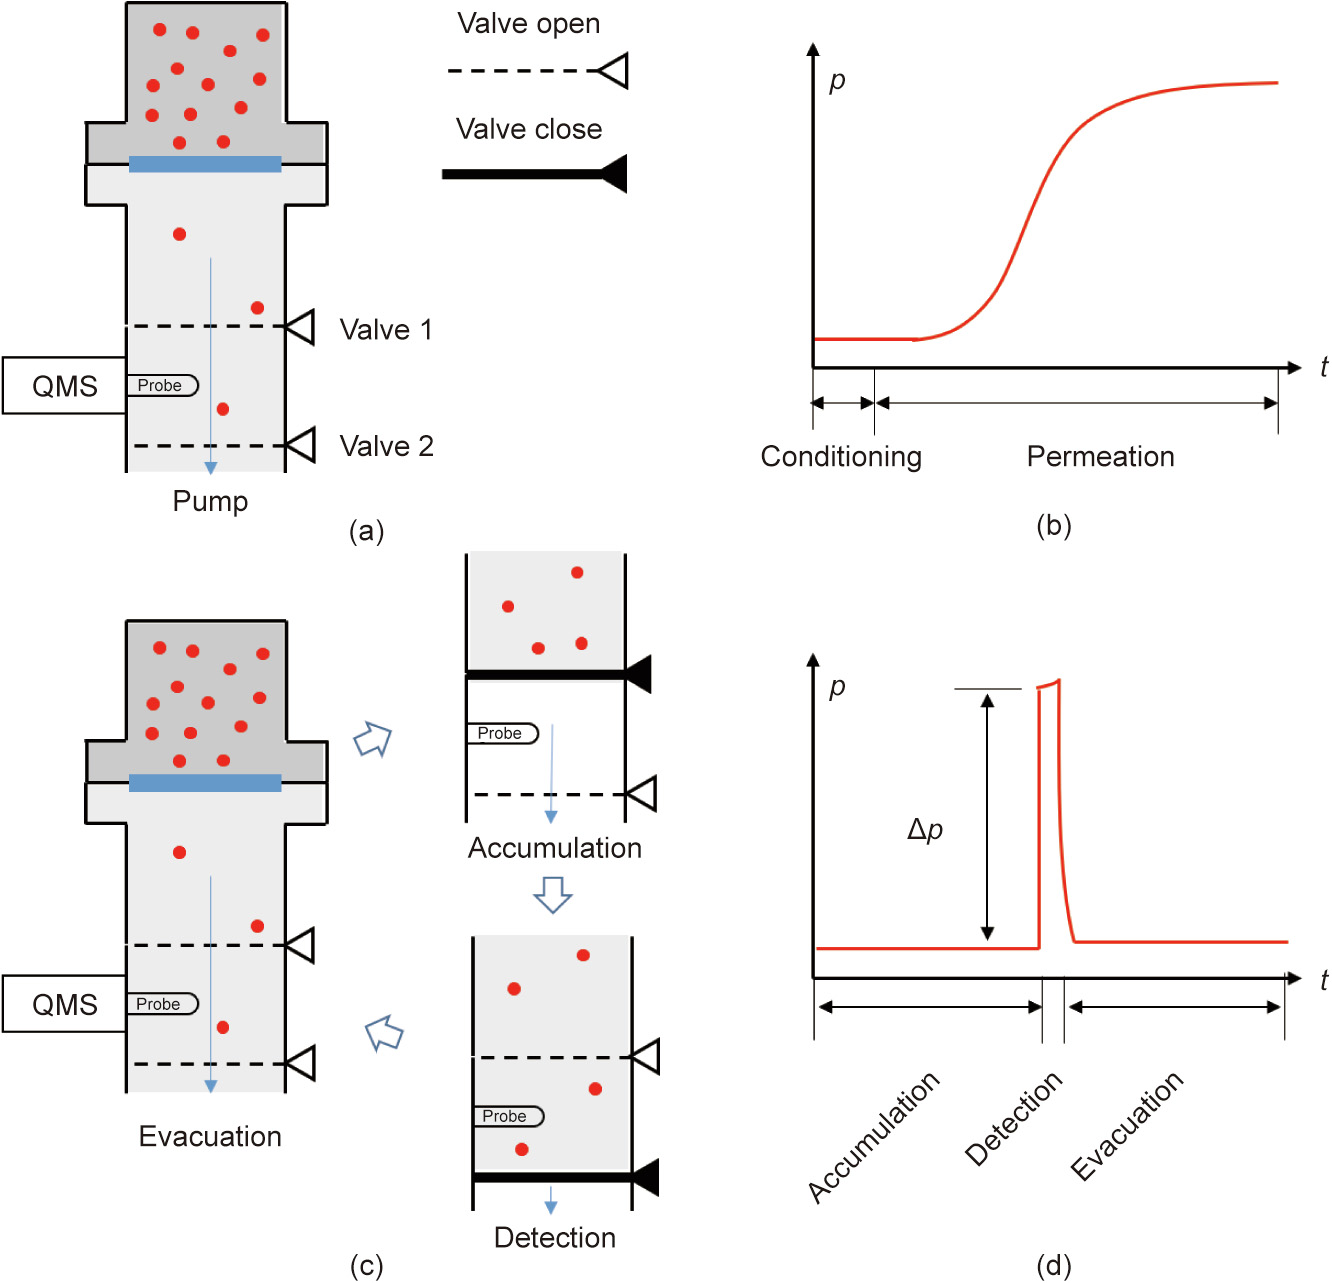
Fig. 2. Principles of permeation measurement: (a) the static mode; (b) the permeation signal under the static mode; (c) the dynamic mode, allowing time-integrated accumulation of the permeation signal; and (d) the permeation signal during one cycle of the dynamic mode.

where  (Torr) is the pressure jump at time t, and
  (Torr) is the pressure jump due to the background. At steady state, J(t) becomes JS, and the recorded pressure jump becomes

Steady-state permeation rate can thus be derived from  by the following:
Compared with the static mode, the dynamic mode has the advantage of an enhanced permeation signal from a reduced QMS background, leading to improved measurement sensitivity with a lower detection limit; it can also eliminate artifacts due to the fluctuation of Seff during permeation.
For both the static and dynamic modes, the steady-state permeation rate JS can also be obtained by fitting the nonsteady-state partial pressure result described by Eqs. (4) or (9). For ultra-barrier permeation, where an extremely long measurement time is required to reach steady-state permeation, the curve-fitting approach is beneficial for forecasting the steady permeation rate, as demonstrated in Sections 3.1 and 3.2.
Fitting of the data to the test model was performed using an algorithm based on weighted least squares [28], with the weight factor of each data point defined from its signal-to-noise ratio and the noise taken from the average of the five data points at the beginning of the signal:

《2.2. Experimental setup》
2.2. Experimental setup
Fig. 3 presents an image and the schematic of the PI-MUP system, which consists of different sections for sample fixture, permeant introduction, and permeant detection.
《Fig. 3》

Fig. 3. (a) Image and (b) schematic diagram of the PI-MUP system.
A sample fixture was designed for efficient loading/unloading of a thin membrane sample with a gas-tight seal around its perimeter and a gas pressure differential between its opposite areas. A crosssection diagram of the fixture is schematically shown in Fig. 4. The membrane sample is horizontally mounted on a custom-designed flange, with each side of the membrane sealed against the flange or a gasket with a Viton O-ring, which defines a circular test area of about 13.85 cm2 exposed to permeation. Peripheral to the sample seal is an outer O-ring that seals the sample perimeter from the atmosphere, allowing the downstream volume to be differentially pumped and thus minimizing any artifact signals due to air leakage. A stainless steel mesh is installed 1–2 mm below and in parallel with the sample membrane, with the aim of preventing the membrane from excessive deflection or rupture under a large pressure differential. Based on a separate characterization of sample deflection under a pressure differential, we found that mechanical support from the mesh takes effect only when the center deflection of the membrane reaches greater than 1 mm under a pressure differential greater than about 75 Torr. Before unloading the sample, the pressure in both the upstream and downstream chambers is slowly and simultaneously increased to 1 atm (1 atm = 101 325 Pa) with nitrogen to avoid the abrupt introduction of a large pressure differential on the sample [22].
《Fig. 4》
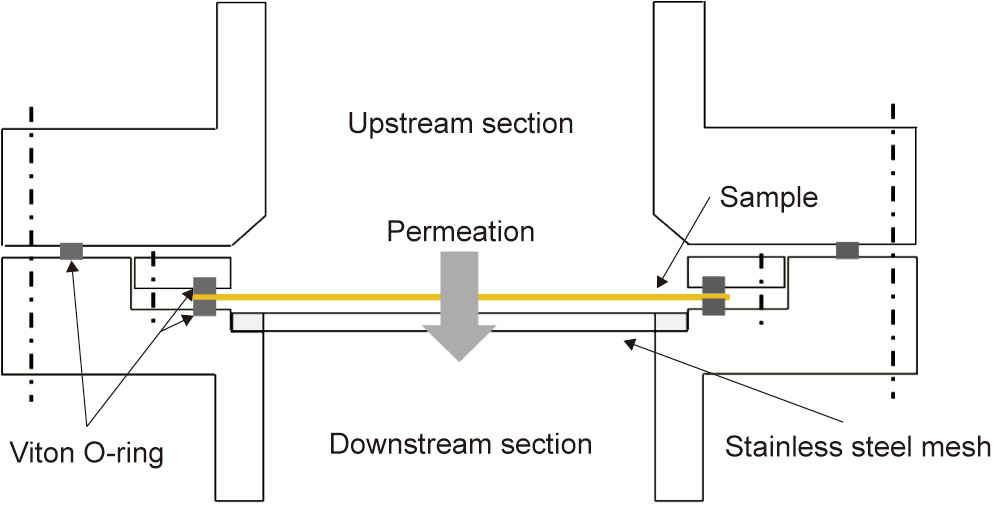
Fig. 4. Cross-section schematic diagram of the sample fixture.
The permeant introduction section introduces into the upstream chamber an isobaric atmosphere of a different test gas or water vapor with an adjustable pressure level. Initially, the upstream chamber is evacuated with a mechanical pump to a base pressure level below 1×10⁻³ Torr; permeants are then manually introduced through a metering valve. For test pressures below 0.1 Torr, a stabilized pressure level is achieved by maintaining a balance between the flow through the metering valve and the active pumping of the upstream; for test pressures above 0.1 Torr, the upstream chamber is isolated from the mass flow once the desired pressure level is achieved. In order to lower the background noise of water vapor on the QMS, the vapor source was chosen to be heavy water, D2O, which has permeation properties similar to those of H2O but a much lower background. Stored in a glass tube, the heavy water has its vapor driven into a ballast vessel with the vapor pressure being read by a diaphragm gauge. The usage of a ballast vessel allows minimum contamination of the heavy water source while preventing over-saturation of the water vapor in the supply line and the upstream chamber. The relative humidity (RH) level in the upstream chamber can be obtained from the measured partial pressure by the following:
where  (Torr) is the partial pressure of water vapor, and
  (Torr) is the equilibrium vapor pressure of water.
The permeant detection section consists of separate UHV chambers for permeant accumulation, detection, and pumping. The chambers are connected to each other using pneumatic flapper valves, enabling a dynamic measurement scheme through a combination of opening and closing of the valves programmed under LabVIEW®. The downstream total pressure in the accumulation and detection chambers is monitored with an ion gauge (IG). A QMS (Hiden model HPR-20, Hiden Analytical, UK) is mounted on the detection chamber for the detection of the partial pressure of the permeant species. Prior to permeation measurement, the UHV chambers are evacuated to a base pressure level below 1 ×10⁻⁸ Torr, which is usually achieved after a bake out for more than 8 h at 120 °C under continuous pumping.
《2.3. Calibration of permeation rate》
2.3. Calibration of permeation rate
The permeation rate of the PI-MUP system at room temperature was calibrated with standard polyethylene naphthalate (PEN) samples of Teonex Q51 (Teijin DuPont Films, UK) with a thickness of 100 μm. The WVTR of PEN was tested under both the static and dynamic measurement modes. For the static measurement, the steady-state permeation rates (JS) were calculated using Eq. (6) with an effective pumping speed (Seff) estimated to be 122 L∙s–1 , which takes into account the conductance of the detection chamber. For the dynamic measurement, the procedure was first validated by testing the permeation of helium, which is an inert gas with fast permeation kinetics, before testing the WVTR of PEN. A series of steady-state permeation rates (JS) was obtained under different applied upstream pressures (pu) in the following way. First, the partial pressure jump (△p) for every measurement cycle was extracted from the variation in the downstream partial pressure, which was monitored on the QMS for helium and water vapor as ion signals from channels 4 (He+ ) and 20 (D2O+ ), respectively. Next, the steady-state value of the partial pressure jump due to permeation (△pS) was obtained and separated from that due to the back ground (△p0). Next, a steady-state permeation rate (JS) was calculated from Eq. (11) based on an estimation of the downstream chamber volume (V = 8.52 ×10⁻⁴m3 ). Finally, the measured JS versus pu was compared against the standard permeation properties of the PEN samples, which were either obtained from the literature [29] (2.79×10⁻² cm3 ∙(m2 ∙d)–1 for helium), or from measurements on a commercial instrument by MOCON ((0.74 ± 0.2) g∙(m2 ∙d)–1 for WVTR) following a National Institute of Standards and Technology (NIST)-traceable procedure [13,30].
To calibrate the PI-MUP system, each experimentally obtained JS was compared with a standard permeation rate for each upstream pressure (pu) because there is no standard ultra-barrier for calibration. Each ‘‘standard permeation rate” was extrapolated from the standard test conditions of the atmospheric pressure for helium and the equilibrium vapor pressure for water vapor, which will be discussed in Section 3.2. After calibration, the demonstrated detection limit of the PI-MUP system could also be obtained.
《3. Results and discussion》
3. Results and discussion
《3.1. Static measurement》
3.1. Static measurement
Fig. 5(a) presents the WVTR of PEN tested under 25 °C/100% RH using the static mode. Upon the introduction of water vapor into the upstream, the upstream pressure (pu) immediately saturates at about 24 Torr, while the downstream partial pressure  remains at a low background for a certain period of time before gradually approaching a steady-state level, which corresponds to the steady-state permeation. Reproducibility of the measurement was confirmed with multiple tests on two different PEN samples (S1 and S2) from the same batch. The WVTR was determined for each test by averaging the permeation rate values recorded during the steady-state period from 15 to 20 h. Averaged over the three tests performed on sample S1, the WVTR of PEN was determined to be 5.30 ×10⁻² g∙(m2 ∙d)–1 , with a standard deviation of 1.23%. Through a comparison with the standard value of 0.74 g∙(m2 ∙d)–1 , as measured on the MOCON instrument [13], the WVTR measured on the PI-MUP system was then calibrated with a correction factor of 13.96 (calculated from 0.74/(5.30×10–2)) with an uncertainly of 1.25%. Furthermore, since the QMS signal has a background of about 5.36 ×10⁻¹² Torr, the minimum observable difference between the partial pressure at steady-state permeation (pt) and the initial partial pressure (p0) will be 5.36×10⁻¹² Torr if a signal/background ratio of 1 is assumed. Such a change in pressure corresponds to a WVTR lower detection limit of about 6.13 ×10⁻⁴ g∙(m2 ∙d)–1 , according to Eq. (6).
《Fig. 5》

Fig. 5. Permeation of water vapor (D2O) through PEN tested under 25 °C/100% RH using the static mode: (a) time-dependent variation of the downstream partial pressure versus the upstream pressure (red) of water vapor; and (b) permeation versus time fitted with the permeation model.
The permeation-versus-time result was applied to evaluate the accuracy of the permeation model developed in Section 2.1. As shown in Fig. 5(b), the accuracy of the model to the test data is affected by the range of data selected for the fitting. In general, the use of less data for the fitting results in greater deviation from the model. Nevertheless, significant deviation does not occur, even for a data range of 0–30 000 s (the initial 50% of the total data range).
The permeation model then allows a forecast of the steady-state permeation properties from non-steady-state results. As presented in Table 1, based on the initial 30 000 s of non-steady-state data, the forecasted steady-state permeation rate (JS) and diffusion coefficient (D) are both close in magnitude to the respective values recorded from the steady-state measurement [31].
《Table 1》
Table 1 Comparison of measured and forecasted permeation properties for measurement under 25 °C/100% RH using the static mode.

《3.2. Dynamic measurement》
3.2. Dynamic measurement
A permeation test of helium through PEN was performed on a dynamic procedure with an evacuation time of 120 s, an accumulation time of 20 s, and a detection time of 8 s (designated as 120 s– 20 s–8 s) applied for each dynamic cycle. Fig. 6(a) presents the variation in the helium partial pressure (pHe) and the extracted partial pressure jump △p for one typical cycle. Such a variation in the partial pressure is consistent with the expected trend outlined in Fig. 2(d).
《Fig. 6》
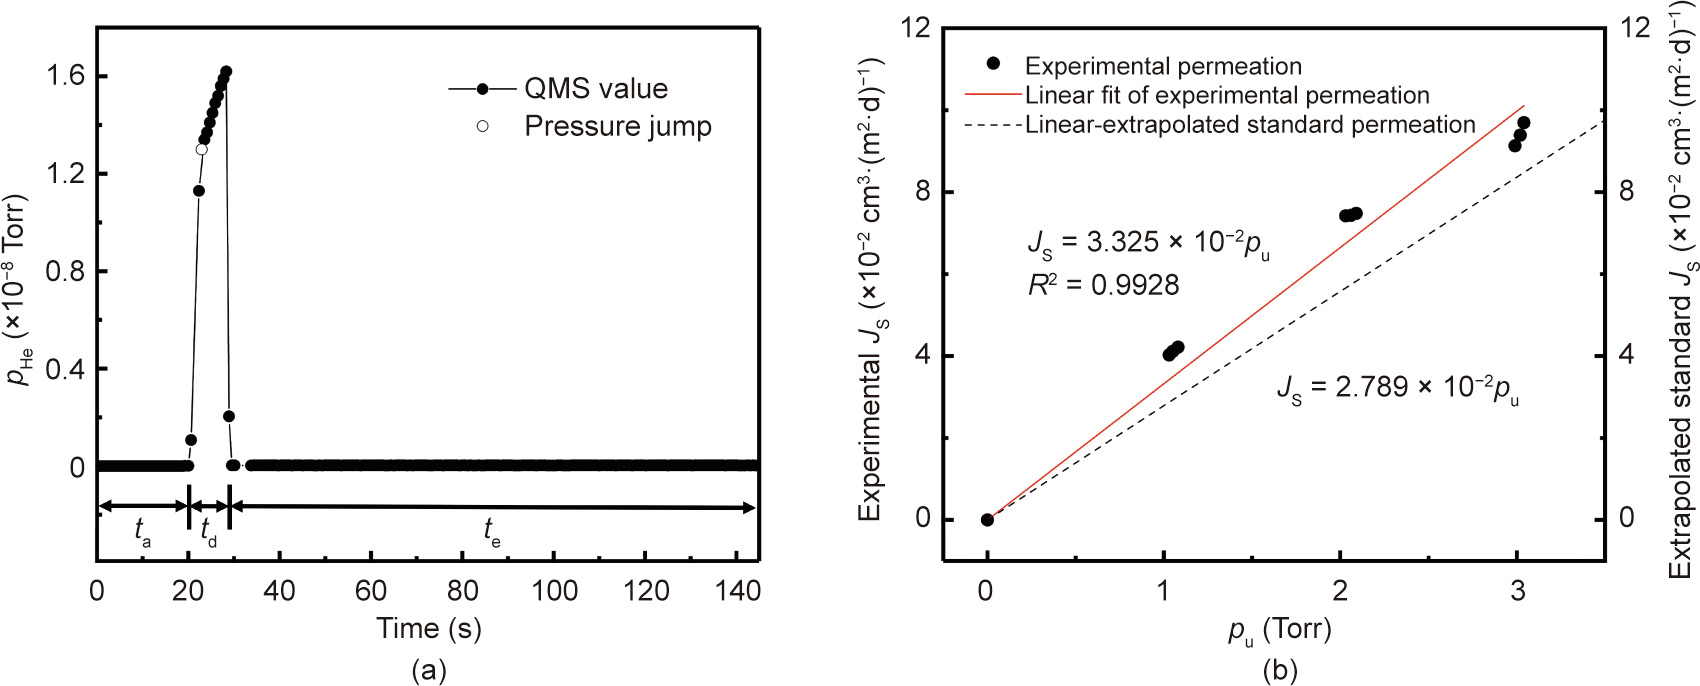
Fig. 6. Permeation of helium through PEN tested using the dynamic mode with an evacuation period of 120 s, accumulation period of 20 s, and detection period of 8 s for each test cycle: (a) variation in partial pressure and the corresponding △p during a single representative cycle; and (b) experimental permeation compared with the linearly extrapolated standard permeation.
Following the above procedure, the steady-state helium permeation rate (JS) was tested as a function of the applied upstream pressure (pu), with JS obtained from △pS using Eq. (11). Fig. 6(b) presents the experimentally obtained JS versus pu, in comparison with the standard permeation rates linearly extrapolated from the permeation rate tested under an upstream pressure of 1 atm. A linear relationship can be found between the experimentally obtained JS and pu, suggesting that the permeability of helium through PEN is independent from the applied upstream pressure. A correction factor of 0.879 can be obtained as the ratio between the slope obtained by linearly extrapolating the standard permeation rate and the experimentally measured linear slope. The pressure-independent helium permeability is consistent with a mechanism of interstitial diffusion without nonlinear interactions [32]. It also supports the validity of the linear extrapolation of standard permeation rates from 1 atm [21].
Permeation of water vapor through PEN was tested using the dynamic procedure under 25 °C/62.5% RH with a time setting of 300 s–150 s–10 s. Fig. 7(a) presents the variation in the downstream water vapor partial pressure during the entire permeation period registered over many measurement cycles, whereas Fig. 7(b) presents such variation during two particular cycles. The partial pressure jump △p for each measurement cycle was extracted and plotted versus time, as shown in Fig. 7(c). As the permeation proceeds, the value of △p gradually increases until it saturates at a steady-state level of △pS, from which the steady-state permeation rate JS was obtained. Similar to the static test mode, the accuracy of the permeation model is affected by the range of non-steady-state permeation data selected for the fitting. As shown in Fig. 7(d), no significant deviation was observed for the selection of the initial 20 000 s of permeation (the initial 35% of the total data range). With regard to the cause of the deviation of the measured steady-state permeation from the permeation model, nonlinear interactions between water and PEN may have occurred during the later stage of permeation approaching the steady state.
《Fig. 7》
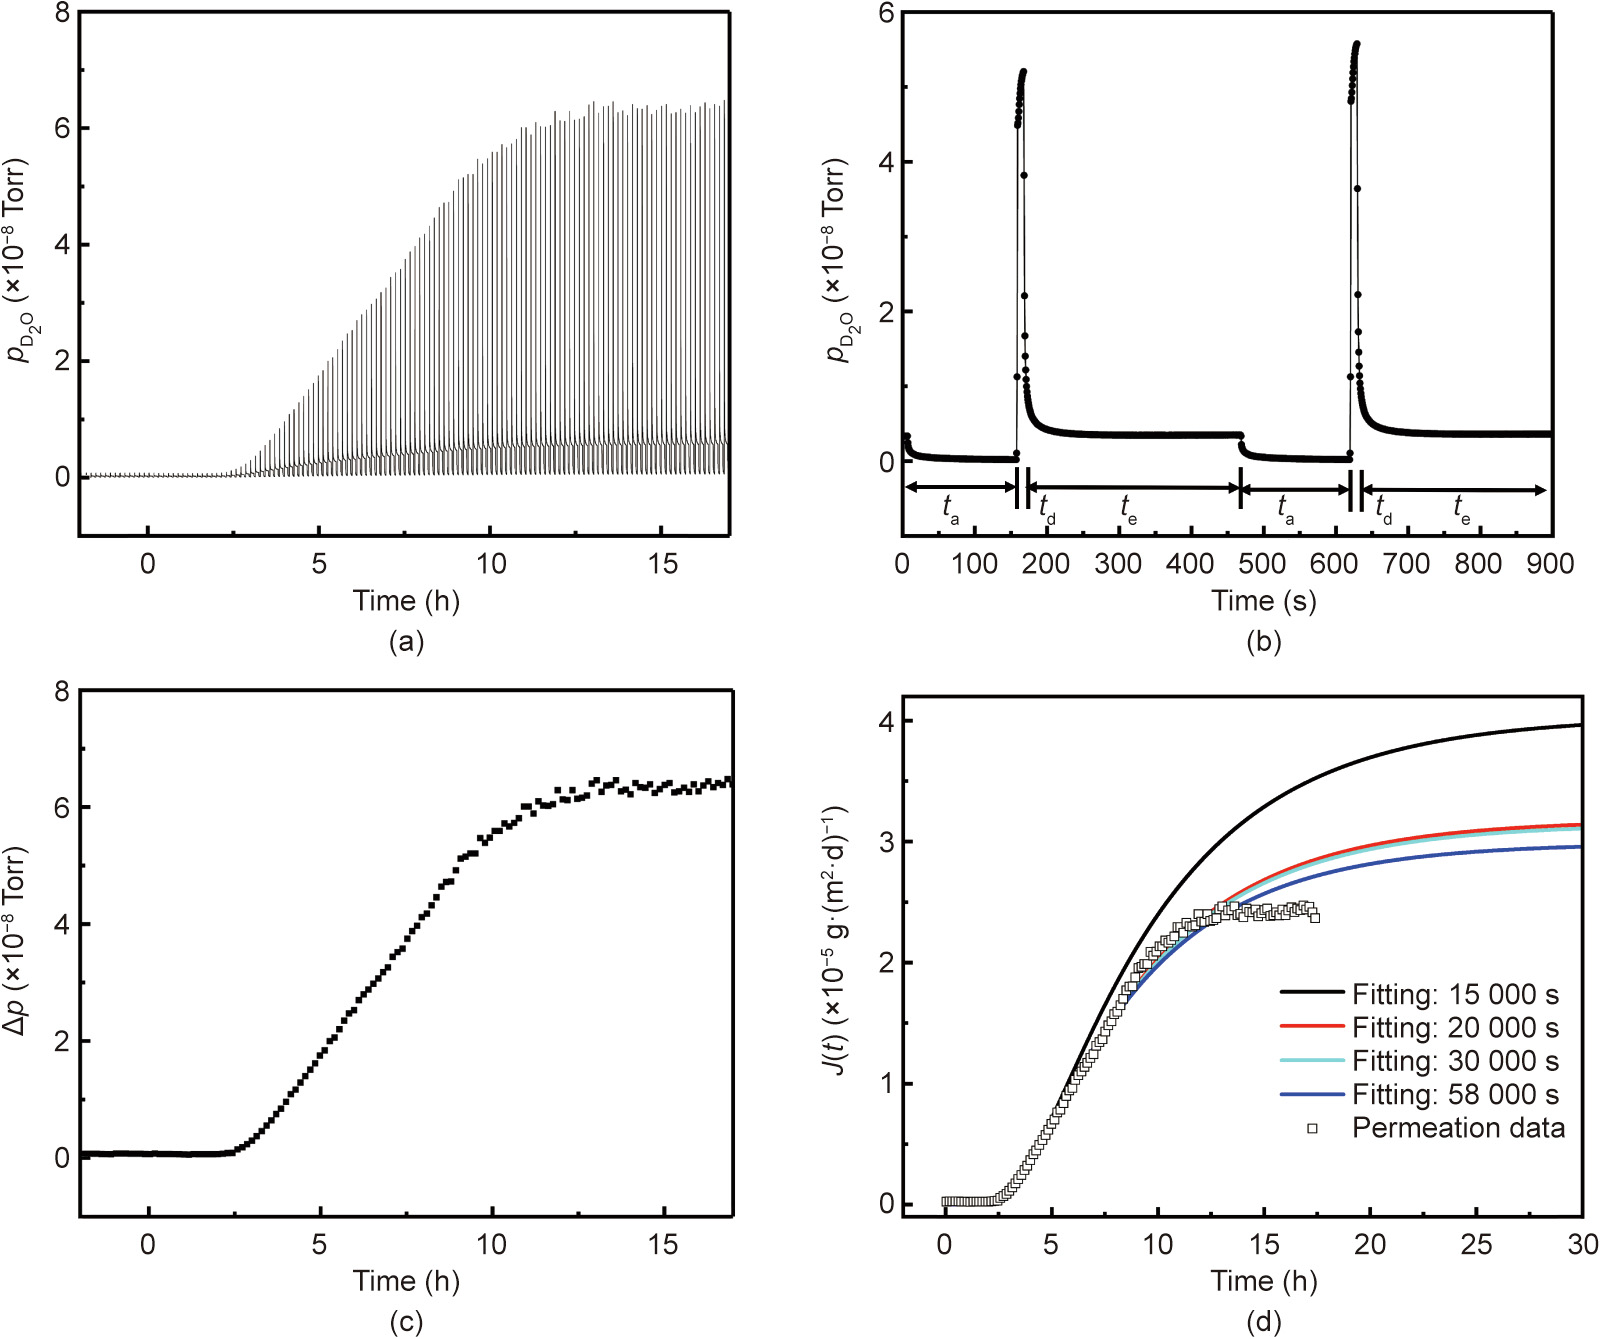
Fig. 7. Permeation of water vapor (D2O) through PEN tested under 25 °C/62.5% RH using the dynamic mode with an evacuation period of 300 s, accumulation period of 150 s, and detection period of 10 s for each test cycle: (a) variation in partial pressure during the whole test period; (b) variation in partial pressure and the corresponding △p during a single representative cycle; (c) increase in △p due to permeation during the whole test period; and (d) permeation versus time fitted with the permeation model.
The experimentally obtained JS as a function of the upstream pressure pu is shown in Fig. 8. JS versus pu can be fitted to a power function of JS = 1:5865 ×10–7 pu2.1125. This power law dependency is consistent with the earlier power law result on PEN using a different QMS detector with a linear sensitivity to water vapor [22]. Separately, by using a standard flow orifice as the test sample, we calibrated the QMS signal of water vapor on our system, showing the QMS signal to be linearly proportional to the flow through the orifice in the entire water vapor partial pressure range explored in Fig. 8 (i.e., 1.30×10⁻¹⁰–1.04 ×10⁻⁷ Torr). Such findings indicate that the observed nonlinear permeation of water is intrinsic to the PEN sample rather than being an artifact from the test device. In addition, the power index of 2.1125 (R2 = 0.9479) is close to 2, suggesting that the permeability coefficient DS in Eq. (1) may be a linear function of pu. The linear increase of diffusivity with concentration has been justified by the possibility of a polymer network swelling in response to water adsorption, which creates additional free volume leading to increased diffusion mobility [17,22,33,34]. Accordingly, the power law needs to be applied to extrapolate the standard WVTR, which is tested under 100% RH on the MOCON instrument, to different upstream pressure levels, as shown in Fig. 8. Calibration of the experimentally obtained WVTR can then be done with a calibration factor of 5663.5, which is obtained as the ratio of the pre-power coefficients between the standard versus experimental permeations. Furthermore, the lower detection limit of WVTR was calibrated to be 7.46 ×10⁻⁷ g∙(m2 ∙d)–1 . Compared with the lower detection limit of about 6.13 ×10⁻⁴ g∙(m2 ∙d)–1 using the static scheme, which may also be affected by the fluctuation of the pumping speed, the dynamic procedure offers a detection limit that is about three orders of magnitude lower.
《Fig. 8》
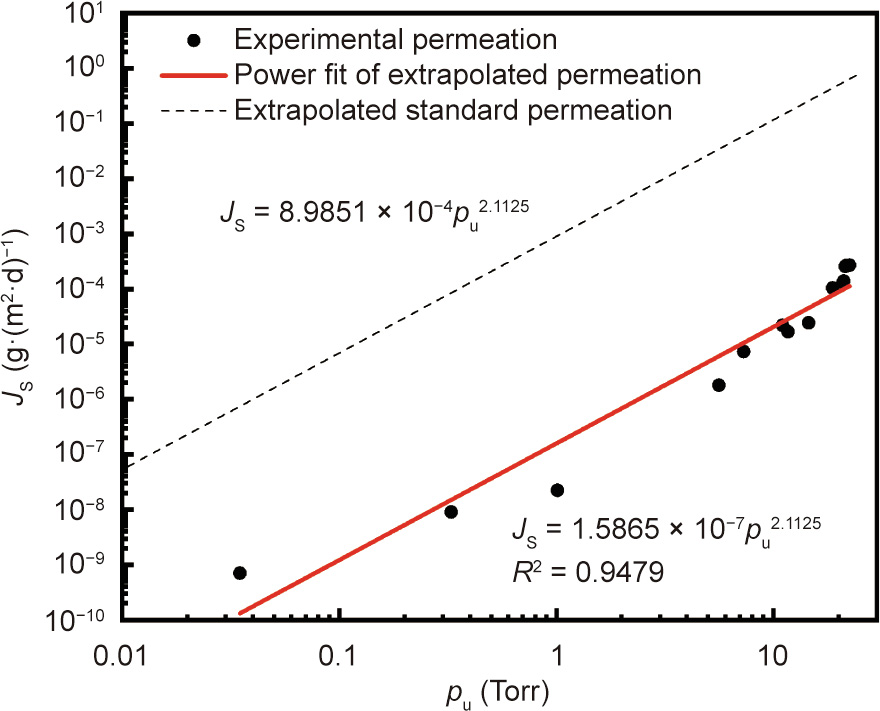
Fig. 8. Water vapor experimental permeation calibrated with standard permeation through PEN.
The dynamic test results of J(t) were also applied to evaluate the accuracy and the prediction capability of the permeation model developed in Section 2.1 for the dynamic scheme. Accuracy was assessed by fitting the recorded J(t) data to the model outlined in Eqs. (2) and (7), as well as by comparing the measured JS result with the one forecasted from the model based on the initial 20 000 s of recorded data.
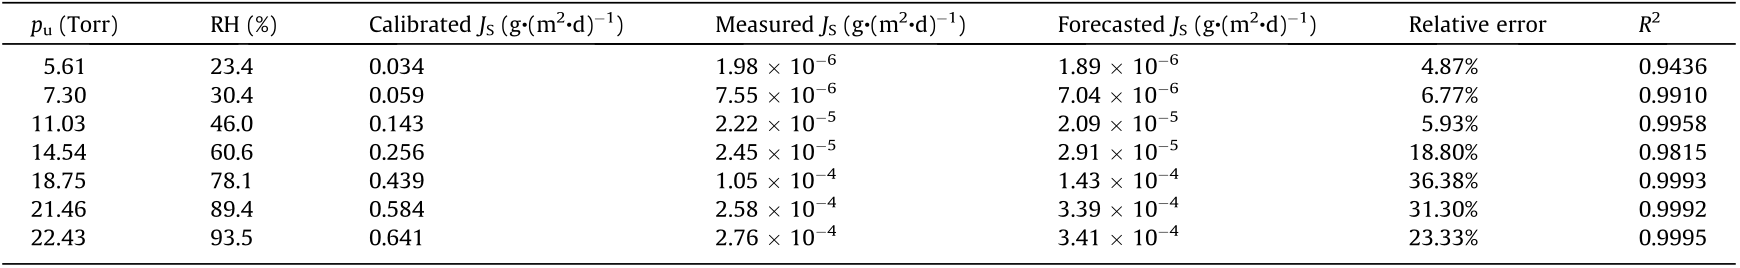
As shown in Fig. 9, the non-steady-state data recorded during the initial 5.6 h fits the model well, with R2 = 0.9958; the forecasted steady-state WVTR of 2.09 ×10⁻⁵ g∙(m2 ∙d)–1 (uncalibrated) is also in close agreement with the experimentally tested value of 2.22 ×10⁻⁵ g∙(m2 ∙d)–1 (uncalibrated), which was recorded over a much longer test period of about 22.5 h. A similar comparison was also done for different applied upstream pressures, as shown in Table 2. In general, the non-steady-state data fits the model well, and the differences between the fitted JS and the measured ones are within 37%. The variation in the relative error listed in Table 2 may be caused by differences in the chamber wall adsorption, as well as differences in the signal-to-noise ratio of the data during the initial stage of permeation. Further improvement of the prediction capability of the dynamic test model is underway, including increasing the signal-to-noise ratio of the data through better QMS background, as well as taking into account the chamber wall adsorption, time for gas desorption from the sample, and any nonlinear permeation effects in the model. Nevertheless, by applying the model for steady-state forecasting, the WVTR measurement time was demonstrated to be significantly reduced by greater than 75%.
《Fig. 9》

Fig. 9. Steady-state WVTR forecasted for PEN under 25 °C/46.0% RH using the dynamic mode (uncalibrated).
《Table 2》
Table 2 Comparison of measured and forecasted steady-state permeation rates for measurements under different upstream pressures using the dynamic mode (forecast is based on the initial 20 000 s of non-steady-state data).
《3.3. Permeation testing of high-barrier encapsulated flexible display devices》
3.3. Permeation testing of high-barrier encapsulated flexible display devices
The barrier properties of an encapsulated OLED device were assessed using the PI-MUP. The WVTR of a bi-layer composite barrier of Al2O3/SiNx encapsulating an OLED device was measured. An electric calcium test and RA test were also performed as calibrations. The bottom SiNx layer was obtained via the plasmaenhanced chemical vapor deposition (PECVD) method, and the top Al2O3 layer was prepared in an atomic layer deposition (ALD) apparatus [35,36]. The thicknesses of the SiNx and Al2O3 layers were approximately 870 and 50 nm, respectively. Figs. 10(a) and(b) respectively present the QMS signals due to steady-state water vapor (D2O) permeation through PEN and the composite barrier under 25 °C/100% RH, with the PEN sample set as a reference. Permeation through the composite barrier took about five days to reach a steady state, and the WVTR was calculated to be 7.29 ×10⁻⁵ g∙(m2 ∙d)–1 , which is four orders of magnitude lower than that of the PEN substrate (7.4 ×10⁻¹ g∙(m2 ∙d)–1 ). In addition, transformation of the OLED with and without barrier encapsulation under severe damp heat conditions of 60 °C/90% RH were monitored by optical microscope imaging, as shown in Fig. 10(c). The lifetime of the OLED encapsulated within the composite barrier in the severe environment was found to be greater than 615 h, and the WVTR value was deduced to be 10–5–10–6 g∙(m2 ∙d)–1 at 25 °C/100% RH based on the requirement for OLEDs [37,38]. The WVTR results from the PI-MUP and RA tests thus agree with each other. Moreover, a composite barrier was also developed on a photoluminescence quantum dots device (Fig. 10(d)), preventing water and oxygen permeations into the quantum dots film and significantly enhancing device reliability. Therefore, the WVTR results from the PI-MUP system can help to guide the design and optimization of encapsulations for flexible display devices.
《Fig. 10》

Fig. 10. Steady-state water vapor (D2O) permeation through (a) PEN and (b) a composite barrier, tested under 25 °C/100% RH using the dynamic mode. (c) Photographs taken at various times during exposure to an accelerated environment of 60 °C/90% RH with and without composite barrier encapsulation. (d) A quantum dot photoluminescence device with a composite barrier encapsulation.
《4. Conclusion》
4. Conclusion
A predictive tool has been developed for the sensitive and expedited measurement of water vapor permeation. The tool is based on an integration of predictive permeation models into highsensitivity QMS analysis. Enhanced WVTR sensitivity has been achieved by operating under a dynamic mode using timeintegrated accumulation of the permeation signal; after calibration, the lower detection limit of WVTR was demonstrated to be in the range of 10–7 g∙(m2 ∙d)–1 , which meets the sensitivity requirement for ultra-barrier permeation measurement. In addition, the predictive permeation models enable a forecast of the steady-state permeation rate based on non-steady-state results, allowing the measurement period to be shortened by more than 75%. Practical application for the permeation testing of a highbarrier-encapsulated OLED device was also explained, with results comparable to the RA test. Based on this demonstrated breakthrough in performance, the current method and instrument offer great potential for the effective detection of ultra-barrier water vapor permeation. Furthermore, as it permits sensitive, accurate, and expedited measurement of trace amounts of gas/vapor permeation, the technique developed in this work can be applied in many different engineering applications, including the measurement of hydrogen isotope permeation in fusion reactors, the detection of small leakages in fuel tanks, and the evaluation of the hermeticity of a mechanical structure or electronic package under a space environment.
《Acknowledgments》
Acknowledgments
This work was supported by the National Natural Science Foundation of China (51835005 and 51911540476), the Hubei Provincial Natural Science Foundation of China (2019CFB527), the Hubei Provincial Natural Science Foundation of China for innovative research groups (2020CFA030), the Independent Research and Development Fund of Huazhong University of Science and Technology (HUST) (2019kfyXMBZ025), and the State Key Lab of Digital Manufacturing Equipment & Technology (0225100102). The authors thank Mengjia Liu from HUST and Dr. Jing Huang from TCL Corporation for respective supply of quantum dot photoluminance film and an OLED device. The authors also acknowledge the Analytical and Testing Center and the Flexible Electronics Research Center of HUST.
《Compliance with ethics guidelines》
Compliance with ethics guidelines
Jianfeng Wanyan, Kun Cao, Zhiping Chen, Yun Li, Chenxi Liu, Runqing Wu, Xiao-Dong Zhang, and Rong Chen declare that they have no conflict of interest or financial conflicts to disclose.


 京公网安备 11010502051620号


