
《1. Introduction》
1. Introduction
Colorectal cancer (CRC) is the third most common cancer and the second leading cause of cancer-related death worldwide [1,2]. More than 60% of CRC patients are diagnosed in the late stages, when the tumor has spread to nearby lymph nodes (stage III) or to distal organs (stage IV), mainly the liver and lung. Diagnosis of CRC in these stages decreases the five-year survival rate to less than 70% and 10%, respectively, whereas it could be increased to more than 80% if CRC patients were diagnosed in the early stages [3]. Current technologies for the diagnosis of CRC are invasive or not specific enough to the disease, such as colonoscopy or fecal occult blood test, respectively. In addition, current biomarkers are useful for prognosis but not for diagnosis, such as the detection of carcinoembryonic antigen (CEA) in plasma samples [4,5]. Therefore, new biomarkers allowing for early, specific, and noninvasive diagnosis of the disease are necessary. CRC develops from polyps (adenoma), which are restricted to the intestinal mucosa, to adenocarcinoma. First, the tumor progresses to the intestinal submucosa (stage I), then into the lamina muscularis propria (stage II); finally, it spreads to other organs (stages III and IV) [4,6]. Mutations and epigenetic and genetic alterations result in protein alterations and dysregulations throughout the different stages of CRC. Some of these altered self-proteins become tumor-associated antigens (TAAs) that induce a humoral immune response in CRC patients [7,8]. Therefore, autoantibodies (immunoglobulin G (IgGs)) against TAAs could be useful biomarkers for the specific detection of the disease in its early stages by means of liquid biopsy [9,10].
In recent years, a variety of proteomics techniques have been used to identify TAAs, with an emphasis on the use of microarrays, such as phage or natural and recombinant protein microarrays [11–13]. However, these techniques are limited by the number of samples analyzed at the same time or by the number of proteins printed onto the arrays. Protein arrays include only 50%–66% of all human proteins and do not include post-translational modifications or proteoforms. Recently, we developed a new approach that addresses these issues using protein extracts from CRC cells for the identification of TAAs. This approach consists of a combination of immunoprecipitation and liquid chromatography–tandem mass spectrometry (LC-MS/MS) procedures, followed by seroreactivity assays [14].
Exosomes are extracellular vesicles 30–150 nm in size, which are secreted by cells. They mediate intercellular communication among surrounding cells and with cells located in distal organs, via blood or lymphatic vessels [15,16]. Tumor-derived exosomes (TDEs) have been reported to be involved in various steps of cancer development and metastasis, inducing the activation of the epithelial–mesenchymal transition, formation of premetastatic niches, and modulation of the immune response of receptor cells [17– 19]. Due to the composition, function, and localization of TDEs in body fluids, TDEs are an interesting and barely explored source for the identification of TAAs that should be specific to CRC.
The tumor microenvironment (TME) comprises cancer cells and a variety of resident and infiltrating host cells, secreted factors, and extracellular matrix proteins. The stroma nurtures cancer cells and facilitates tumor development, invasion, and metastasis. In addition, the TME contributes to the regulation of TAA expression and immune-cell infiltration [20]. Therefore, an analysis of CRC tumor tissue encompassing cancer cells and tumor stroma should identify the tumor stroma neoantigens that have been missed in the analysis of cancer cells in culture [14].
Due to great progress in electrochemical biosensors and biosensing approaches in recent years, these technologies are steadily gaining ground as very suitable high-performance and affordable tools. These approaches are easy to operate with little to no training, and they can perform multiplexed and/or multiomics analysis in the field (i.e., in non-laboratory environments or in areas with limited resources) to provide accurate and reliable quantitative results using a small amount of real-world biological samples and minimal actionable times [21,22]. These devices have most recently been used to explore cancer biomarkers, with a particular focus on prevalent and high-mortality neoplasms such as CRC, in order to assist conventional methodologies in early diagnosis and staging. Within the last two years alone, electrochemical affinity-based biosensors have demonstrated unique opportunities to determine CRC-related transcriptomic biomarkers (microRNAs); epigenetic biomarkers (i.e., 5-methylcytosine (5-mC) and 5- hydroxymethylcytosine (5-hmC) at both the global and regional level in DNA and global N6 -methyladenosine (m6A) in RNA, even with single-base sensitivity); and proteomic biomarkers (i.e., proteins, receptors, or proteases related to the presence of CRC, as well as hypoxia and metastasis events involved in tumoral aggressiveness and progression) [23]. Here, we aim to enlarge the number of CRC-specific TAAs with diagnostic value by using immunoprecipitation (IP) followed by mass spectrometry (MS) to study the protein content of two complementary and barely studied protein sources of CRC TAAs: ① TME tissue samples from CRC patients in the early stages (stages I and II); ② TME tissue samples from CRC patients in the late stages (stages III and IV); and ③ exosomes secreted by CRC cell lines with different metastatic abilities. A total of 103 different proteins were identified as specifically recognized by IgGs from CRC patients. Fifteen of these were further selected for validation by ① bioinformatics and meta-analysis, to determine their potential dysregulation and association with CRC; ② seroreactivity assays to detect their autoantibodies and determine their diagnostic value using sera from CRC patients at different stages, individuals with colorectal premalignant lesions, and healthy individuals as controls; and ③ Western blot (WB) and immunohistochemistry (IHC) to analyze their role as CRC prognostic markers. Finally, an electrochemical biosensing multiplexed platform envisioned as a point-of-care (POC) device capable of detecting all these autoantibodies in plasma was developed.
《2. Materials and methods》
2. Materials and methods
《2.1. Colorectal cancer cell lines》
2.1. Colorectal cancer cell lines
Isogenic CRC cell lines SW480 and SW620 were obtained from the American Type Culture Collection cell repository. Isogenic cell lines KM12C, KM12SM, and KM12L4a were obtained from Fidler’s laboratory (MD Anderson Cancer Center) [24,25]. CRC cells were grown according to established protocols in Dulbecco’s Modified Eagle’s Medium (DMEM; Lonza, Switzerland) supplemented with 10% fetal bovine serum (FBS; Sigma Aldrich, USA), 1× L-glutamine (Lonza), and 1× penicillin/streptomycin (Lonza).
《2.2. Tissue and plasma samples》
2.2. Tissue and plasma samples
The Institutional Ethical Review Boards of the Carlos III Health Institute at the San Carlos Clinical Hospital (Madrid) approved this study on biomarker discovery and validation (CEI PI 45). Tissue and plasma samples were obtained from the San Carlos Clinical Hospital biobank, which belongs to the Spanish National Biobank Net cofounded with European Regional Development Fund FEDER funds, after approval from the ethical review board of the institutions. Written informed consent was obtained from all patients. Plasma and tissue samples were collected using a standardized sample collection protocol and stored at –80 °C until use [9,13,26].
For IP, 12 plasma samples from CRC patients at stages III and IV obtained before surgery and 12 plasma samples from healthy individuals with negative colonoscopy and unknown pathology were used (Table 1 and Table S1 (Appendix A)), together with 13 optimum cutting temperature (OCT) compound-embedded frozen tissue samples from CRC patients at stages I–IV (Table 1 and Table S2 (Appendix A)). For luminescence and biosensing seroreactivity assays, a total of 112 individual plasma samples from CRC patients at stages I–IV obtained before surgery (n = 38), from individuals with premalignant lesions (low- or high-grade adenomas) (n = 36), and from healthy individuals with negative colonoscopy and unknown pathology (n = 38) were used (Table 1 and Table S1).
《Table 1》
Table 1 Information on the plasma samples from CRC patients and healthy individuals used in the study.
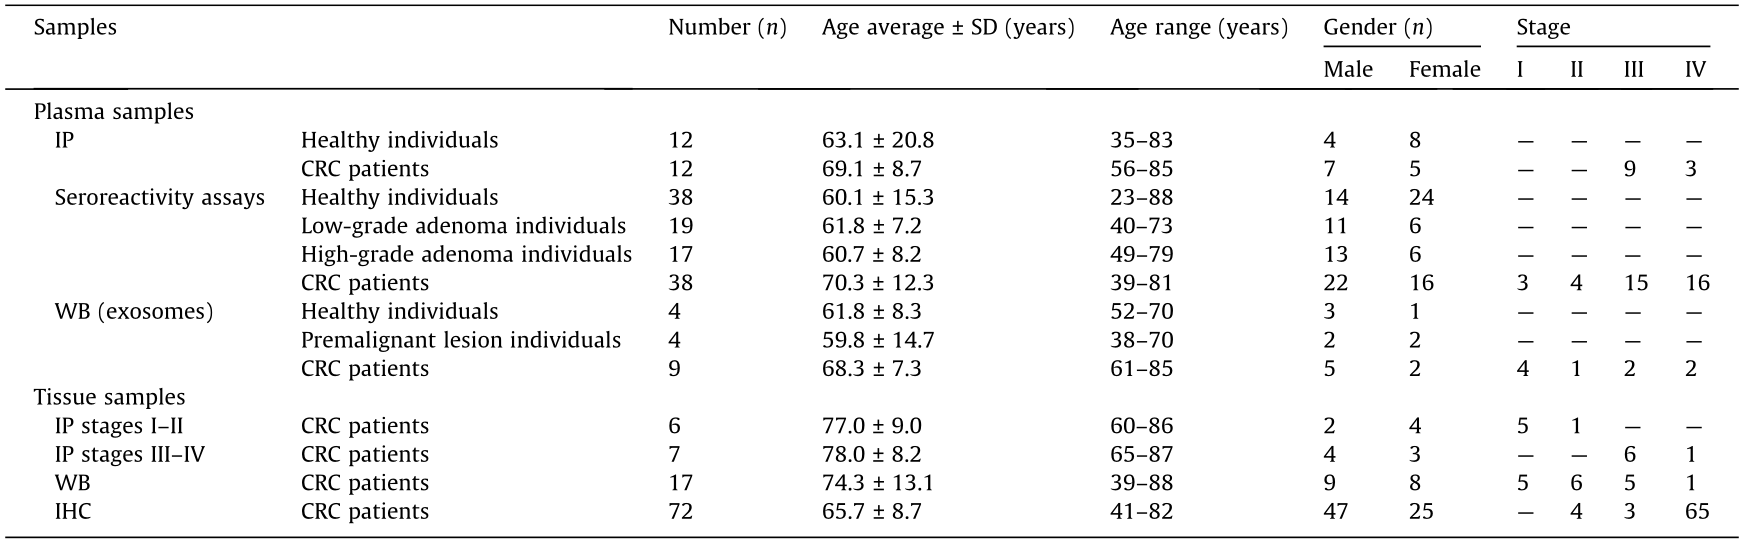
SD: standard deviation.
Premalignant and malignant colorectal lesions were assessed by a pathologist with expertise in gastrointestinal pathology following the internationally recommended criteria. Premalignant lesions were classified as either low- or high-grade adenomas according to the architectural and cytological grades of dysplasia. Malignant transformation was also noted and staged following Dukes’ or Kikuchi’s system.
OCT-embedded frozen tumoral and paired non-tumoral tissue samples from 17 CRC patients at stages I–IV were used for WB analysis (Table 1 and Table S2), together with 17 exosome samples isolated from plasma from CRC patients at stages I to IV (n = 4), from individuals with premalignant lesions (n = 4), and from healthy individuals as controls (n = 9) (Table 1 and Table S1).
《2.3. Exosome isolation and purification》
2.3. Exosome isolation and purification
To isolate and purify the exosomes secreted by the CRC cells, eight 175 cm2 cell culture flasks (Corning, USA) were seeded per cell line. Cells were grown until 90% confluence at 37 °C and under 5% carbon dioxide (CO2). The cells were then washed three times with phosphate buffered saline (PBS) 1× and incubated with 20 mL of DMEM without FBS for 1 h at 37 °C and under 5% CO2 to remove the FBS and exogenous exosomes. Next, the cells were washed three times with PBS 1× and incubated with 20 mL of DMEM without FBS for 48 h at 37 °C under 5% CO2. Then, 160 mL of conditioned medium of each cell line was centrifuged at 500g for 5 min at 4 °C to remove the cell debris (pellet) and then centrifuged again at 2000g for 10 min at 4 °C to remove vesicles greater than 1 μm (pellet). The clarified and conditioned mediums were then collected and stored at –80 °C until use.
Purification of exosomes was then carried out by differential centrifugation. Conditioned mediums were centrifuged (Beckman-Coulter ultracentrifuge, XL-100 K, USA) at 10 000g for 30 min at 4 °C to remove extracellular microvesicles (MVs) with a size of 1 μm. Next, the conditioned mediums were further centrifuged at 100 000g for 70 min at 4 °C for exosome sedimentation. The supernatants were discarded and the exosomes (pellet) were resuspended in a final volume of 1 mL of PBS 1× per cell line. Then, 20 mL of PBS 1× was used to wash each exosome preparation and the samples were centrifuged again at 100 000g for 70 min at 4 °C. Finally, the supernatants were discarded and the pellets containing exosomes were resuspended in 500 μL of PBS 1× and stored at –80 °C until use. Two aliquots of 10 μL were analyzed prior to IP to avoid the continuous freezing and thawing of samples.
To isolate and purify human plasma exosomes, 3 mL of each plasma sample was first centrifuged at 17 000g for 30 min at 4 °C to remove extracellular MVs. The supernatant was then filtered through a 0.22 μm filter and subsequently ultracentrifuged at 120 000g for 90 min for exosome collection (Fig. S1 in Appendix A). Finally, cell culture exosome samples were diluted to 1:50 to 1:100 in PBS 1× and human plasma exosome samples were diluted to 1:1000 in PBS 1×, and both were analyzed using a NanoSight NS300 (Malvern Panalytical, United Kingdom) to verify that the proper isolation and purification of exosomes had occurred.
《2.4. Electron microscopy and cryo-electron microscopy》
2.4. Electron microscopy and cryo-electron microscopy
Exosome particles were analyzed by electron microscopy (EM) and cryo-electron microscopy (cryoEM) with negative staining. First, the exosome samples were fixed for 5 min in PBS 1× and 4% paraformaldehyde; they were applied to glow-discharged carbon-coated grids for 5 min and negatively stained with 2% aqueous uranyl acetate. The samples were then analyzed on an FEI Tecnai 12 electron microscope equipped with a LaB6 filament operated at 120 kV. Images were recorded with an FEI Ceta digital camera.
Alternatively, indicated exosome preparations were analyzed by cryoEM. To this end, exosome preparations were harvested on rhodium grids previously hydrophilized, and samples were quickly frozen in ethane. Samples were then analyzed with an FEI Tecnai 12 microscope operated at 120 kV. Images were recorded on a charge coupled device (CCD) 1000 Gatan camera.
《2.5. Protein extraction and quantification》
2.5. Protein extraction and quantification
CRC cell lines were grown until 90% confluence at 37 °C and under 5% CO2, resuspended with PBS 1× containing 4 mmol∙L–1 of ethylenediaminetetraacetic acid (EDTA), and harvested by centrifugation at 1200 r∙min–1 for 5 min at room temperature. Then, cells were resuspended in 500 μL of lysis buffer (radioimmunoprecipitation assay (RIPA); Sigma Aldrich) supplemented with 1× protease and phosphatase inhibitors (MedChemExpress, USA) and lysed by mechanical disaggregation using 16 gauge and 18 gauge needle syringes. Finally, the samples were centrifuged at 10 000g and 4 °C for 10 min and protein extracts (supernatants) were stored at –80 °C until use.
Protein extracts from OCT-embedded CRC tissue samples were used for this study. First, tissue samples were cut into small pieces on dry ice and washed twice with 500 μL of PBS 1×, which was subsequently discarded by centrifugation at 10 000g at 4 °C for 5 min. The tissue samples were then resuspended in 300 μL of RIPA supplemented with 1× protease and phosphatase inhibitors, and mechanically lysed with the TissueLyser II (Qiagen, Hilden, Germany) (two cycles for 2 min each at 30 Hz). Next, 200 μL of RIPA supplemented with 1× protease and phosphatase inhibitors was added to each sample, and the samples were mechanically disaggregated again with the TissueLyser II (two cycles for 2 min each at 30 Hz). Finally, the samples were centrifuged at 10 000g at 4 °C for 10 min and the protein extracts (supernatants) were stored at –80 °C until use.
Protein concentration was determined by the Trp quantification method [27] and confirmed by Coomassie blue staining after 10% sodium dodecyl sulphate–polyacrylamide gel electrophoresis (SDS-PAGE) under reducing conditions.
The protein concentration of the exosome samples was quantified using a MicroBCA Protein Assay Kit (Thermo Fisher Scientific, USA) and confirmed by Coomassie blue staining and WB after 10% SDS-PAGE. For the SDS-PAGE, the exosomes were lysed with a loading buffer supplemented with 0.15% β-mercaptoethanol (five cycles of 5 min on ice and 5 min at 95 °C). For IP, the exosomes were lysed with RIPA supplemented with 1× protease and phosphatase inhibitors, by means of mechanical disaggregation. The samples were then centrifuged at 10 000g at 4 °C for 10 min, and the protein extracts (supernatants) were collected and stored until use.
《2.6. SDS-PAGE and Western blot》
2.6. SDS-PAGE and Western blot
Protein expression was analyzed by Coomassie blue staining and WB. 5 μg of each protein extract were separated using 10% SDS-PAGE under reducing conditions and then transferred to nitrocellulose membranes at 100 V for 1 h. The membranes were blocked with 0.1% Tween PBS 1× supplemented with 3% skimmed milk (blocking buffer) for 1 h at room temperature and then incubated with primary antibodies at optimized dilutions (Table S2) in blocking buffer overnight (O/N) at 4 °C with shaking. Next, the membranes were washed three times with 0.1% Tween PBS 1× and incubated with the appropriate indicated horseradish peroxidase (HRP)-conjugated secondary antibodies (Table S3 in Appendix A) diluted in blocking buffer for 1 h at room temperature with shaking. The membranes were then washed three times with 0.1% Tween PBS. A signal was developed using the ECL Pico Plus chemiluminescent reagent (Thermo Fisher Scientific), detected on an Amersham Imager 680 (GE Healthcare, USA). Protein band intensities were quantified with Image J software and normalized according to the total protein content of the corresponding lanes (Ponceau Red staining, Sigma Aldrich).
《2.7. Immunoprecipitation》
2.7. Immunoprecipitation
For the IP of proteins contained in exosomes, a total of 200 μg of each exosome protein extract was used (1 mg of total protein), whereas 2 mg of the total equimolecular protein extracts was used for the study of CRC TME tissue (stages I–II and stages III–IV, separately). Protein pools were precleaned through incubation with 20 μL of Protein G agarose beads (SCBT), previously equilibrated with RIPA, for 1 h at 4 °C with rotation.
First, IgGs from a pool of plasma samples from CRC patients at stages III and IV (n = 12) and from a pool of plasma samples from healthy individuals (n = 12) were isolated (Table 1 and Table S1). 200 μL of Protein G agarose beads was separately incubated with 50 μL of each pool of sera and 350 μL of 200 mmol∙L–1 sodium phosphate at pH 7.0 for 90 min. The beads were then washed twice with 1 mL of 200 mmol∙L–1 sodium phosphate at pH 7.0 for 5 min and incubated again with another 50 μL of each pool of sera and 350 μL of 200 mmol∙L–1 sodium phosphate at pH 7.0 for 90 min. Then, the beads were washed four times with 1 mL of 200 mmol∙L–1 sodium phosphate at pH 7.0 for 5 min. Finally, the bound IgGs were eluted twice with 300 μL of 0.1 mol∙L–1 glycine at pH 2.7 for 4 min. The eluted proteins were neutralized with 30 μL of 1 mol∙L–1 Tris buffer at pH 8.8, and the concentration of isolated IgGs was quantified with the Nanodrop 2000C (Thermo Fisher Scientific).
Next, isolated IgGs from CRC patients and healthy individuals as controls were covalently bound to Protein G agarose beads, as previously described [14]. In brief, 100 μL of beads previously equilibrated in 100 mmol∙L–1 Tris-HCl containing 150 mmol∙L–1 NaCl at pH 7.4 (TBS 1× ) were separately incubated with 200 μg of IgGs isolated from CRC patients or controls in TBS 1× for 2 h. Next, the beads were washed with TBS 1× and incubated three times with 200 mmol∙L–1 triethanolamine at pH 8.9 (Sigma Aldrich) for 5 min to remove all traces of Tris from the previous buffer. After that, the beads were incubated twice with 200 mmol∙L–1 triethanolamine containing 50 mmol∙L–1 dimethyl pimelimidate (DMP, Sigma Aldrich) at pH 8.9 for 1 h to ensure efficient IgG–protein G cross-linking. The beads were then washed with 200 mmol∙L–1 triethanolamine at pH 8.9 and blocked with ethanolamine (Sigma Aldrich) for 15 min. Finally, non-cross-linked IgGs beads were eluted twice with 0.1 mol∙L–1 glycine containing 2 mol∙L–1 urea at pH 2.7 for 5 min, and the beads were equilibrated with RIPA prior to the incubation with the protein extracts .
Finally, the precleaned protein extracts were incubated with Protein G beads covalently bound to IgGs from the controls O/N at 4 °C with rotation and subsequently incubated with Protein G beads covalently bound to IgGs from CRC patients O/N at 4 °C with rotation. After incubation with the protein extracts, the beads were washed 11 times with TBS 1× and the proteins that were recognized by the IgGs from the controls and the CRC patients were eluted twice with 100 μL of 0.1 mol∙L–1 glycine at pH 2.7 for 5 min. The eluted proteins were neutralized with 2 mol∙L–1 ammonium bicarbonate (ABC) buffer at pH 8.0 and the protein concentration was quantified using the Nanodrop 2000C (Thermo Fisher Scientific).
All incubations were performed at room temperature with rotation, and all supernatants were removed by means of centrifugation at 13 200 r∙min–1 and 4 °C for 5 min. Aliquots of all steps were analyzed by Coomassie blue or silver staining after 10% SDS-PAGE (Fig. S2 in Appendix A).
《2.8. Liquid chromatography–tandem mass spectrometry》
2.8. Liquid chromatography–tandem mass spectrometry
Of the immunoprecipitated eluted proteins, 50% were separated by 10% SDS-PAGE and stained with Coomassie Brilliant Blue G-250. Then, whole lanes were cut into small pieces, separately unstained with 50 mol∙L–1 ABC/50% acetonitrile (ACN), dehydrated with ACN, and dried. The samples were then reduced with 10 mol∙L–1 dithiothreitol (DTT) in 25 mol∙L–1 ABC and alkylated with iodoacetamide to a final concentration of 50 mol∙L–1 . Next, the gel pieces were dried, rehydrated with 12.5 ng∙mL–1 porcine trypsin (Thermo Fisher Scientific) in 50 mol∙L–1 ABC, and incubated overnight at 37 °C. The peptides were extracted using 100% ACN and 0.5% TFA, purified using a Zip Tip with 0.6 μL of C18 resin (Millipore, Sigma Aldrich Química SL, Spain), and dried. Finally, the samples were reconstituted in 5 μL of 0.1% formic acid/2% ACN prior to analysis by nano LC-MS/MS in the Proteomics and Genomics Facility of the Center for Biological Research (CIB-CSIC, Spain)
Peptide separations were carried out on an Easy-nLC 1000 nano system (Thermo Fisher Scientific). For the analysis, the sample was loaded into a precolumn Acclaim PepMap 100 (Thermo Fisher Scientific) and eluted in a RSLC PepMap C18 that was 50 cm long, with an inner diameter of 75 μm, and a particle size of 2 μm (Thermo Fisher Scientific). The mobile phase flow rate was 300 nL∙min–1 using 0.1% formic acid in water (solvent A) and 0.1% formic acid and 100% ACN (solvent B). The gradient profile was set as follows: 5%–35% solvent B for 90 min, 35%–100% solvent B for 4 min, and 100% solvent B for 8 min. Four microliters of each sample were injected.
MS analysis was performed using a Q-Exactive mass spectrometer (Thermo Fisher Scientific). For ionization, 1900 V of liquid junction voltage and a capillary temperature of 300 °C were used. The full-scan method employed a m/z 400–1500 mass selection, an Orbitrap resolution of 70 000 (at m/z 200), a target automatic gain control (AGC) value of 3e6 (i.e., 3×10⁶ ), and maximum injection times of 100 ms. After the survey scan, the 15 most intense precursor ions were selected for MS/MS fragmentation. Fragmentation was performed with a normalized collision energy of 27 eV, and MS/MS scans were acquired with a starting mass of m/z 200, an AGC target of 2e5 (i.e., 2×10⁵ ), a resolution of 17 500 (at m/z 200), an intensity threshold of 8e3 (i.e., 8×10³ ), an isolation window of 2.0 m/z units, and a maximum IT of 100 ms. Charge state screening was enabled to reject unassigned, singly charged, and equal or more than seven protonated ions. A dynamic exclusion time of 20 s was used to discriminate against previously selected ions.
《2.9. Mess-specrometry data analysis》
2.9. Mess-specrometry data analysis
MS data were analyzed with Proteome Discoverer (version 1.4.1.14) (Thermo Fisher Scientific) using standardized workflows. Mass spectra *.raw files were searched against the SwissProt_2016_10.fasta, Homo sapiens (human) database (20 121 sequence protein entries) using the Mascot search engine (version 2.6, Matrix Science, United Kingdom). Precursor and fragment mass tolerances were set to 10 ppm and 0.02 Da, respectively, allowing two missed cleavages, carbamidomethylation of cysteines as a fixed modification, and methionine oxidation and acetylation of the N-terminal as a variable modification. The identified peptides were filtered using a Percolator algorithm [28] with a q value threshold of 0.01.
《2.10. Bioinformatics and meta-analysis》
2.10. Bioinformatics and meta-analysis
A first screening of the proteins identified as potential autoantigens specific to CRC was performed using the contaminant repository for affinity purification MS data (CRAPome) database [29]. Proteins appearing in more than 15% of the IP experiments reported in this database were discarded from further analysis. Then, the proteins were analyzed using the STRING (version 11.0) and DAVID (version 6.8) databases to study protein enrichment and to identify altered networks and pathways in which these proteins are involved [30–32]. The STRING settings were fixed to Markov Cluster Algorithm (MCL) clustering enrichment 2 and a confidence score of 0.4.
Extensive meta-analysis of the selected proteins was performed by analyzing whether genetic alterations associated with CRC had been previously associated with these proteins. To this end, the UALCAN [33] and cBioPortal [34] databases were used, as they provide information on dysregulations in gene expression between CRC and paired healthy tissue samples and genetic alterations identified in tumor tissue samples, respectively. In addition, information from the Human Protein Atlas [35,36] and GEPIA 2 [37,38] was used to examine whether the identified proteins had been previously associated with CRC patients’ prognosis or survival using the best cutoff or the quartile, respectively.
《2.11. Immunohistochemistry》
2.11. Immunohistochemistry
For the IHC analysis, tissue microarrays containing 88 core samples from 72 CRC patients (Table 1 and Table S4 in Appendix A) were constructed using the manual tissue arrayer-1 (MTA-1) tissue arrayer (Beecher Instruments, USA). Each core (diameter: 1 mm) was punched from pre-selected tumor regions in paraffinembedded tissues. Staining was conducted in 2 μm sections. Slides were de-paraffinized via incubation at 60 °C for 15 min, and then incubated on a PT-Link (Denmark) for 20 min at 95 °C in a lowpH buffered solution (EnVision FLEX Target Retrieval Solution, Dako, Denmark). To block endogenous peroxidase, the holders were incubated with peroxidase-blocking reagent (Dako). Biopsies were incubated overnight at 4 °C using optimized dilutions of the indicated antibodies (Table S3). Tissues were incubated with the appropriate anti-Ig horseradish peroxidase-conjugated polymer (EnVisionFLEX-HRP, Dako) to detect the antigen–antibody reaction. All antibodies and anti-Ig HRP-conjugated antibodies presented high specificity, and no positiveness resulted from these antibodies individually. Sections were then visualized with 3,3' - diaminobenzidine as a chromogen for 7 min and counterstained with hematoxylin. Visualization and immunoreactivity were conducted according to established protocols [14,39].
《2.12. Gateway cloning and protein expression》
2.12. Gateway cloning and protein expression
Sequence-verified full-length complementary DNA (cDNA) plasmids containing the TP53, TGM3, ACTR3, PSPH, MT-CO2, SPDL1, HMGCS2, CYB5R1, RAB25, FABP5, SDF2L1, S100A8, SERPINB12, SERPINB3, RAB2A, and DEFA1 genes in a flexible pDONR221, pDONR223, or pENTR223 vector system were obtained from the publicly available DNASU Plasmid Repository (https://dnasu.org/ DNASU/Home.do) [40]. Subsequently, open reading frames (ORFs) were transferred to the pANT7_cHalo vector for in vitro expression by LR Clonase reaction (Invitrogen, USA), following the manufacturer’s instructions, to obtain full-length proteins expressed as fusion proteins to Halotag in their C-terminal end [41,42]. Next, TOP10 Escherichia coli (E. coli) cells were transformed with the LR reaction’s products to isolate the expression plasmids of interest. Donor and expression plasmids were purified using Miniprep (Neobiotech, USA), according to the manufacturer’s instructions, and the sequence was verified prior to use.
Fusion proteins were expressed using the 1-Step Human Coupled IVT Kit HeLa cell lysate (Thermo Fisher Scientific), according to the manufacturer’s instructions for luminescence immunoassays. Protein expression was analyzed by WB as previously described, using 0.67 μL of protein expression per well, a mouse monoclonal primary antibody anti-Halotag (1/2500, Promega, USA), and HRP-labeled goat anti-Mouse (GAM, Sigma Aldrich) as the secondary antibody.
《2.13. Seroreactivity luminescence assays》
2.13. Seroreactivity luminescence assays
The seroreactivity of the p53, TGM3, ACTR3, PSPH, MT-CO2, SPDL1, HMGCS2, CYB5R1, RAB25, FABP5, SDF2L1, S100A8, SERPINB12, SERPINB3, RAB2A, and DEFA1 proteins was analyzed by a luminescence Halotag-based beads immunoassay, as previously described [42–45], using Magne Halotag beads (MBs, Promega) prepared following the manufacturer’s instructions. First, the MBs were equilibrated three times in 500 μL of wash buffer (0.1% Tween 20, 0.05% Triton X-100, in PBS 1× ) for 5 min at room temperature and with rotation. Then, the proteins expressed in vitro were incubated with the MBs O/N at 4 °C with rotation, in a relation of 0.67 μL of protein and 0.5 μL of MBs suspension per reaction, in a final volume of 600 μL of PBS 1× . In addition, 96-well plates (Bio-Plex Pro Flat bottom plates, Bio-Rad, USA) were blocked with 300 μL of 0.1% Tween PBS 1× supplemented with 3% bovine serum albumin (BSA) O/N at 4 °C and 120 r∙min–1 . After protein immobilization, the MBs were washed three times with wash buffer for 5 min at room temperature with rotation, and then blocked with SuperBlock Blocking Buffer (Thermo Fisher Scientific) for 1 h at room temperature with rotation. After that, the MBs were transferred to 96-well plates (Bio-Plex Pro Flat bottom plates, BioRad) and separately incubated with 50 μL of each of the 112 plasma samples at 1/400 dilution in 0.1% Tween PBS 1× supplemented with 3% BSA O/N at 4 °C and 150 r∙min–1 (Table 1 and Table S1). Next, the wells were washed three times and incubated with 50 μL of HRP-labeled anti-Human IgG secondary antibody (Dako), diluted 1/3000 in 0.1% Tween PBS 1× supplemented with 3% BSA for 1 h at room temperature and 150 r∙min–1 . Finally, the wells were washed three times, and a signal was developed with the ECL Pico Plus chemiluminescent reagent (Thermo Fisher Scientific) and recorded onto The Spark multimode microplate reader (Tecan Trading AG, Switzerland). As the controls for the assay, the MBs that were covalently immobilized with fusion proteins were incubated with anti-Halotag antibody and the appropriate HRP-conjugated secondary antibody (Table S3).
《2.14. Seroreactivity biosensing assays》
2.14. Seroreactivity biosensing assays
The protocol used for seroreactivity biosensing assays has been previously reported and optimized [41,42], so it was followed here. Proteins were expressed in vitro, anchored to MBs, and incubated with plasma samples [41,42]. To verify the correct protein immobilization, Halotag fusion proteins were detected with antiHalotag mAb (Promega), followed by 1 h incubation with 1/3000 diluted HRP-conjugated anti-mouse IgG (Sigma Aldrich). The amperometric measurements were performed in the presence of the hydroquinone (HQ)/H2O2 system with disposable screenprinted carbon electrodes upon the magnetic capture of the MBs bearing the immunocomplexes on the working electrode [41,42]. The biorecognition event was monitored by the variation in the cathodic current generated by the enzymatic (HRP) reduction of H2O2 mediated by HQ and measured at –0.20 V (vs Ag pseudoreference electrode) [41,42].
《2.15. Statistical analysis》
2.15. Statistical analysis
Plots, mean, standard error of the mean, and t-test were obtained with Microsoft Excel 2019 and GraphPad Prism 5 programs. Nonparametric Mann-Whitney U test values were calculated using R (v3.6.2, Austria). p values less than 0.05 were considered to be statistically significant. Receiver operating characteristic (ROC) curves to determine the diagnostic ability of each protein individually or in combination were constructed with R (v3.6.2), using the ModelGood and Epi packages.
《3. Results》
3. Results
In this work, we analyzed CRC TDEs and the TME as complementary and barely analyzed sources for the identification of CRC-specific TAAs that could be useful for the early detection of this disease. For the identification of TAAs, we used a recently described approach consisting of a combination of IP and LC-MS/MS, using exosomes and CRC tumor tissues followed by seroreactivity assays [14]. The exosomes used for TAA identification were isolated from the secretome of SW480 and KM12C CRC cells, as models of a primary tumor, and from the secretome of SW620, KM12SM, and KM12L4a cells, as models of CRC metastasis to the lymph nodes, liver, and liver and lung, respectively. CRC tissue samples and exosomes isolated from plasma samples of patients at different stages were used to validate the dysregulation of the TAAs during the course of the disease. Finally, we integrated the TAAs into an electrochemical immunosensing platform based on Halotag technology to construct a POC device for differentiating between CRC patients and individuals carrying premalignant lesions, and healthy individuals [41,42]. Fig. 1 depicts the workflow of this study.
《Fig. 1》
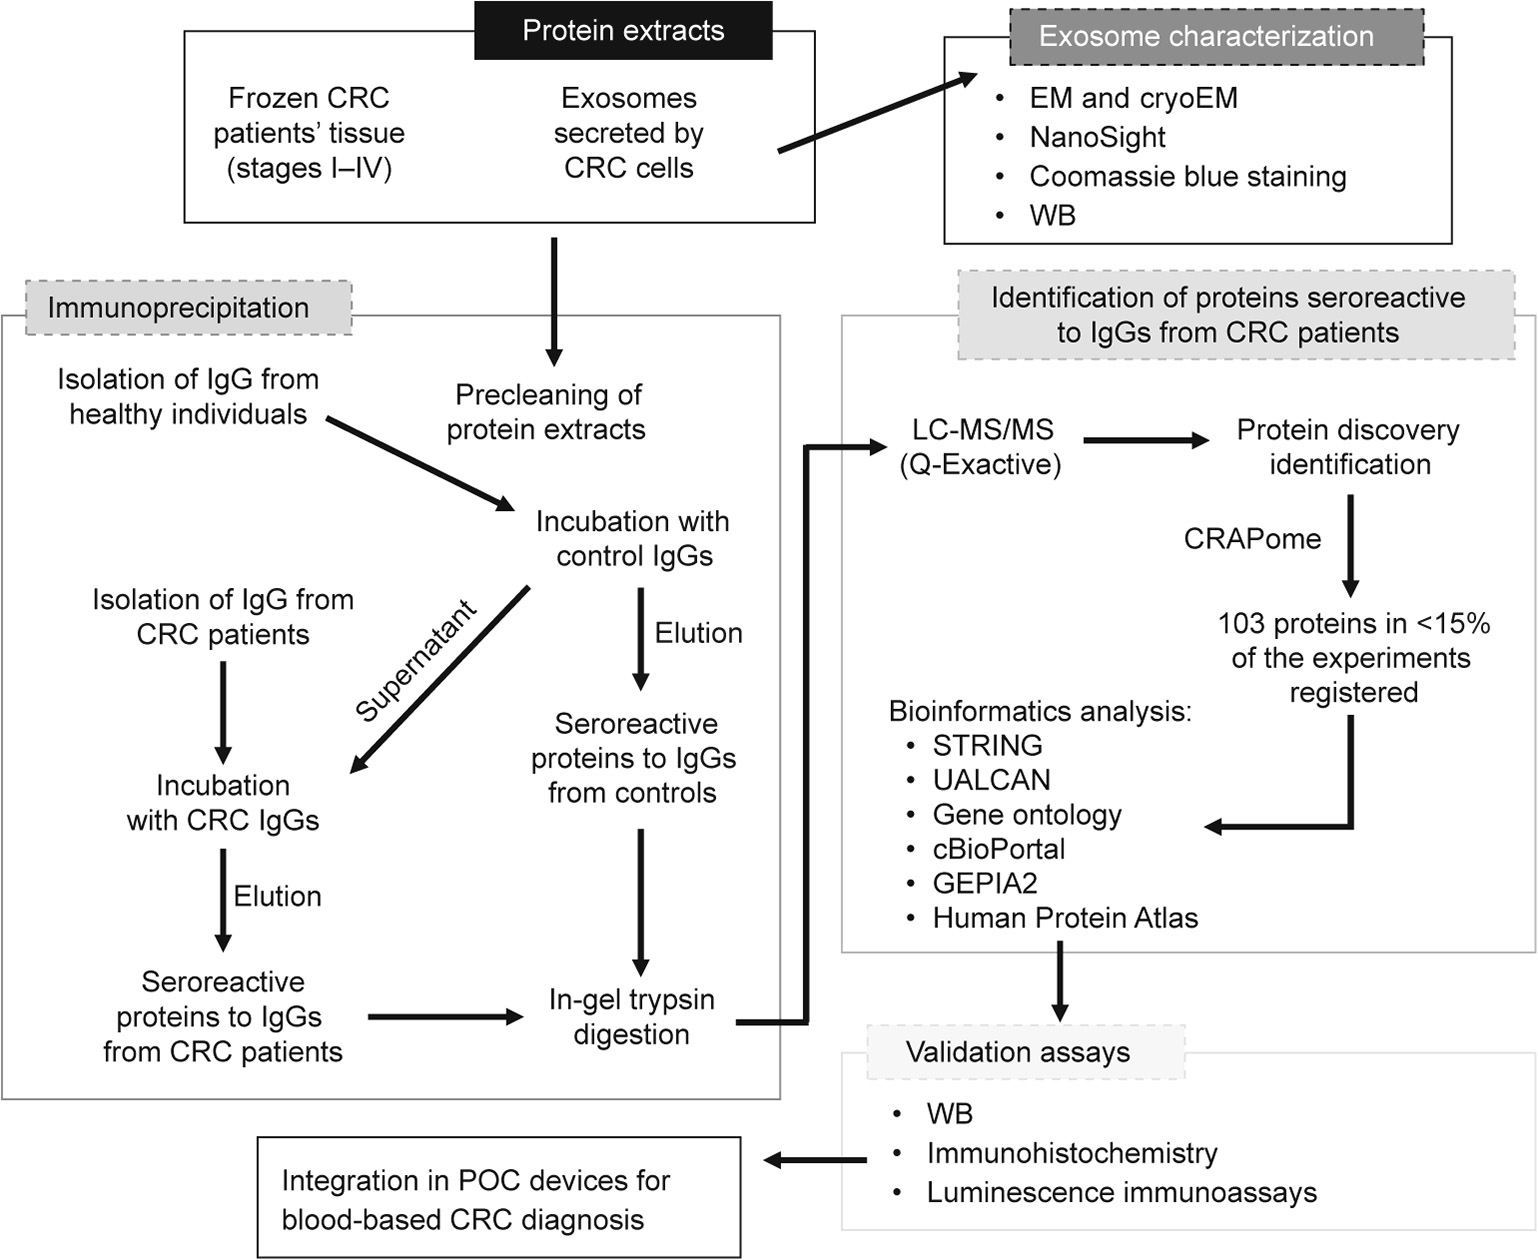
Fig. 1. Work flow of the approach used in this study for the identification, validation, and integration in POC diagnostic devices of TAAs from exosomes and tissue samples from CRC patients. Protein extracts from exosomes secreted by five CRC cell lines with different metastatic abilities and tissue samples from CRC patients at stages I–IV were investigated using IP coupled to MS to identify potential TAAs specific to CRC that were dysregulated during the course of the disease and that had diagnostic ability. A metaanalysis of the 103 proteins identified as specifically seroreactive to IgGs from CRC patients was performed, identifying 15 proteins more likely to be actual TAAs for validation. WB, IHC, and meta-analysis were used to determine their association with CRC development, progression, and prognosis. Finally, the seroreactivity of these proteins was validated by seroreactivity luminescence assays prior to integrating the proteins on POC-like devices for the diagnosis of CRC and colorectal premalignant individuals.
《3.1. Characterization of exosomes secreted by CRC cell lines》
3.1. Characterization of exosomes secreted by CRC cell lines
The extracellular vesicles released by the CRC cells were isolated via the differential centrifugation of the conditioned media of the cultured cells. The conditioned media was collected after the CRC cells were incubated for 48 h in DMEM without FBS, thus avoiding isolation of the exogenous exosomes. Before using the exosome protein content in IP assays, the purified samples were characterized to confirm that appropriate isolation and purification of the exosomes had occurred (Fig. 2).
Using EM (Fig. 2(a)), we observed vesicles no larger than 150 nm, which were compatible with an exosome vesicle size with a distorted structure due to the dehydration processes that were necessary for sample preparation. No contaminants, such as MVs non-previously harvested or protein aggregates, were detected. For further confirmation, purified vesicles from SW480 cells were analyzed using cryoEM (Fig. 2(a)). We observed vesicles no larger than 150 nm surrounded by a lipid bilayer and with their native structure. Finally, with the NS300, we observed isolated vesicles in suspension, and obtained the mean size and concentration of all the samples (Fig. 2(b)). The vesicles isolated from non-metastatic KM12C and SW480 cells were more heterogeneous in size and more numerous than those secreted by their isogenic metastatic counterparts, the KM12SM and KM12L4a cells and the SW620 cells, respectively. In addition, the mean size of the vesicles in all the samples was between 140 and 200 nm, which was in agreement with the sizes of the exosome samples.
We also analyzed the protein extract of the exosome samples using Coomassie blue staining and WB (Fig. 2(c)). These analyses showed differences in the protein content between the exosomes and cell lysates of the same CRC cells. Importantly, the presence of Alix, a protein marker specific to extracellular vesicles, was exclusively observed in the exosome samples. Collectively, these results confirmed that the appropriate isolation and purification of exosomes from the CRC cells had occurred.
《Fig. 2》

Fig. 2. Characterization of the exosomes released by CRC cell lines. (a) Electron microscopy and cryoEM images of the vesicles secreted by CRC cell lines, isolated and purified by differential centrifugation. Vesicles smaller than 150 nm were observed, surrounded by a lipid bilayer compatible with exosomes. (b) Overlapped spectra of the exosomes secreted by CRC cells, obtained with the NS300, showed differences in their size and concentration in the different isogenic CRC cells. Exosomes secreted by non-metastatic SW480 and KM12C cells were more heterogeneous in size and larger than those secreted by the isogenic metastatic SW620, KM12SM, and KM12L4a cells, respectively. In addition, the SW isogenic cells secreted a greater number of exosomes than the KM12 cells. (c) Coomassie blue staining (upper panel) and WB of exosomes and cell lysates revealed differences in the protein pattern between exosomes and cells. The presence of Alix, a protein specific to extracellular vesicles, was observed only in exosomes.
《3.2. Identification of potential TAAs by IP coupled with LC-MS/MS》
3.2. Identification of potential TAAs by IP coupled with LC-MS/MS
The exosomes secreted by the CRC cells and the CRC tissue samples from patients at stages I–IV were examined by IP followed by LC-MS/MS in order to identify CRC-specific TAAs that had been dysregulated during the course of the disease. Protein extracts from the exosomes and tissue samples were first analyzed with Coomassie blue staining (Fig. 2(c) and Fig. S2(a) in Appendix A) to assess their quality.
Second, IgGs from CRC patients (n = 12) and from healthy individuals as controls (n = 12) were separately isolated from plasma samples (Table 1 and Table S1) and covalently bound to Protein G agarose beads. The protein extracts were then incubated with the IgGs from the controls to remove the proteins that were seroreactive to the controls. Then, the clarified protein extracts were subsequently incubated with the IgGs from CRC patients to identify TAAs specific to the disease. Proteins that were seroreactive to the IgGs from the controls and to those from the CRC patients were eluted and analyzed by means of silver staining after 10% SDSPAGE, prior to LC-MS/MS analysis (Fig. 3(a)).
Next, proteins that were seroreactive to both IgGs were concentrated in 10% SDS-PAGE, in-gel digested with trypsin, and then identified using MS. A total of 919 proteins were identified from the three IP assays (404 proteins from the tissue samples from patients at stages I–II, 270 proteins from tissue samples from patients at stages III–IV, and 245 proteins from exosomes). Among these, 235 proteins were exclusively seroreactive to the IgGs from CRC patients, 194 were exclusively seroreactive to the IgGs from healthy individuals, and 490 proteins appeared in both analyses (Fig. 3(b) and Tables S5–S7 in Appendix A).
Prior to the bioinformatics and meta-analysis, the 235 proteins that had been exclusively identified as seroreactive to the IgGs from CRC patients were screened in the CRAPome database with a cutoff of less than 15% of appearance in IP experiments registered in the database. A total of 103 different proteins were then selected as more likely to be actual TAAs specific to CRC. Among these proteins, 13 had been identified in two or three of the IP assays performed in the study (Table 2 and Fig. 3(c)). Remarkably, some of the 103 proteins were previously identified as CRC TAAs in previous studies [14], such as the TALDO1, MT-CO2, or SPCS2 proteins, which supported the accuracy of this approach for the identification of TAAs.
《Fig. 3》

Fig. 3. IP followed by the LC-MS/MS of proteins from CRC cell-derived exosomes, tumoral tissue, and tumor stroma exosomes targeted by autoantibodies. (a) Silver staining of proteins seroreactive to IgGs from healthy individuals and from CRC patients eluted after the three IPs carried out in this study. (b) Venn diagrams of the proteins seroreactive to the IgGs from healthy individuals, those seroreactive to the IgGs from CRC patients, or those seroreactive to both IgGs, identified and quantified by LC-MS/MS in each IP. A total of 919 proteins were identified from the three IPs, with 235 of them being specifically seroreactive to IgGs from CRC patients. (c) Venn diagram of the 103 proteins identified as potential TAAs specific to CRC in each IP that appeared in < 15% of the IP experiments registered in the CRAPome database. Thirteen of these proteins were identified in more than one IP performed in this study. CT: control.
《3.3. Bioinformatics, meta-analysis, and validation》
3.3. Bioinformatics, meta-analysis, and validation
An extensive meta-analysis of the 103 proteins identified as potential TAAs of CRC was then performed (Fig. 4). The STRING and DAVID databases were used to examine the protein networks and pathways in which these proteins are involved. With DAVID, we found that the proteins were implicated in multiple key biological processes and functions, with some playing critical roles in cancer (Fig. 4(a)). Regarding their cellular localization, the proteins were mainly cytoplasmic or located in extracellular exosomes, which suggested that the exosomes would be enriched in TAAs specific to the disease. Furthermore, with STRING, the proteins were grouped by direct and indirect interactions into 10 clusters comprising proteins related to metabolic processes, immune response, cytoskeleton organization, signal transduction, protein transport, response to stress, calcium binding, and cell differentiation (Fig. 4(b)), all of which are processes closely associated with cancer.
《Fig. 4》
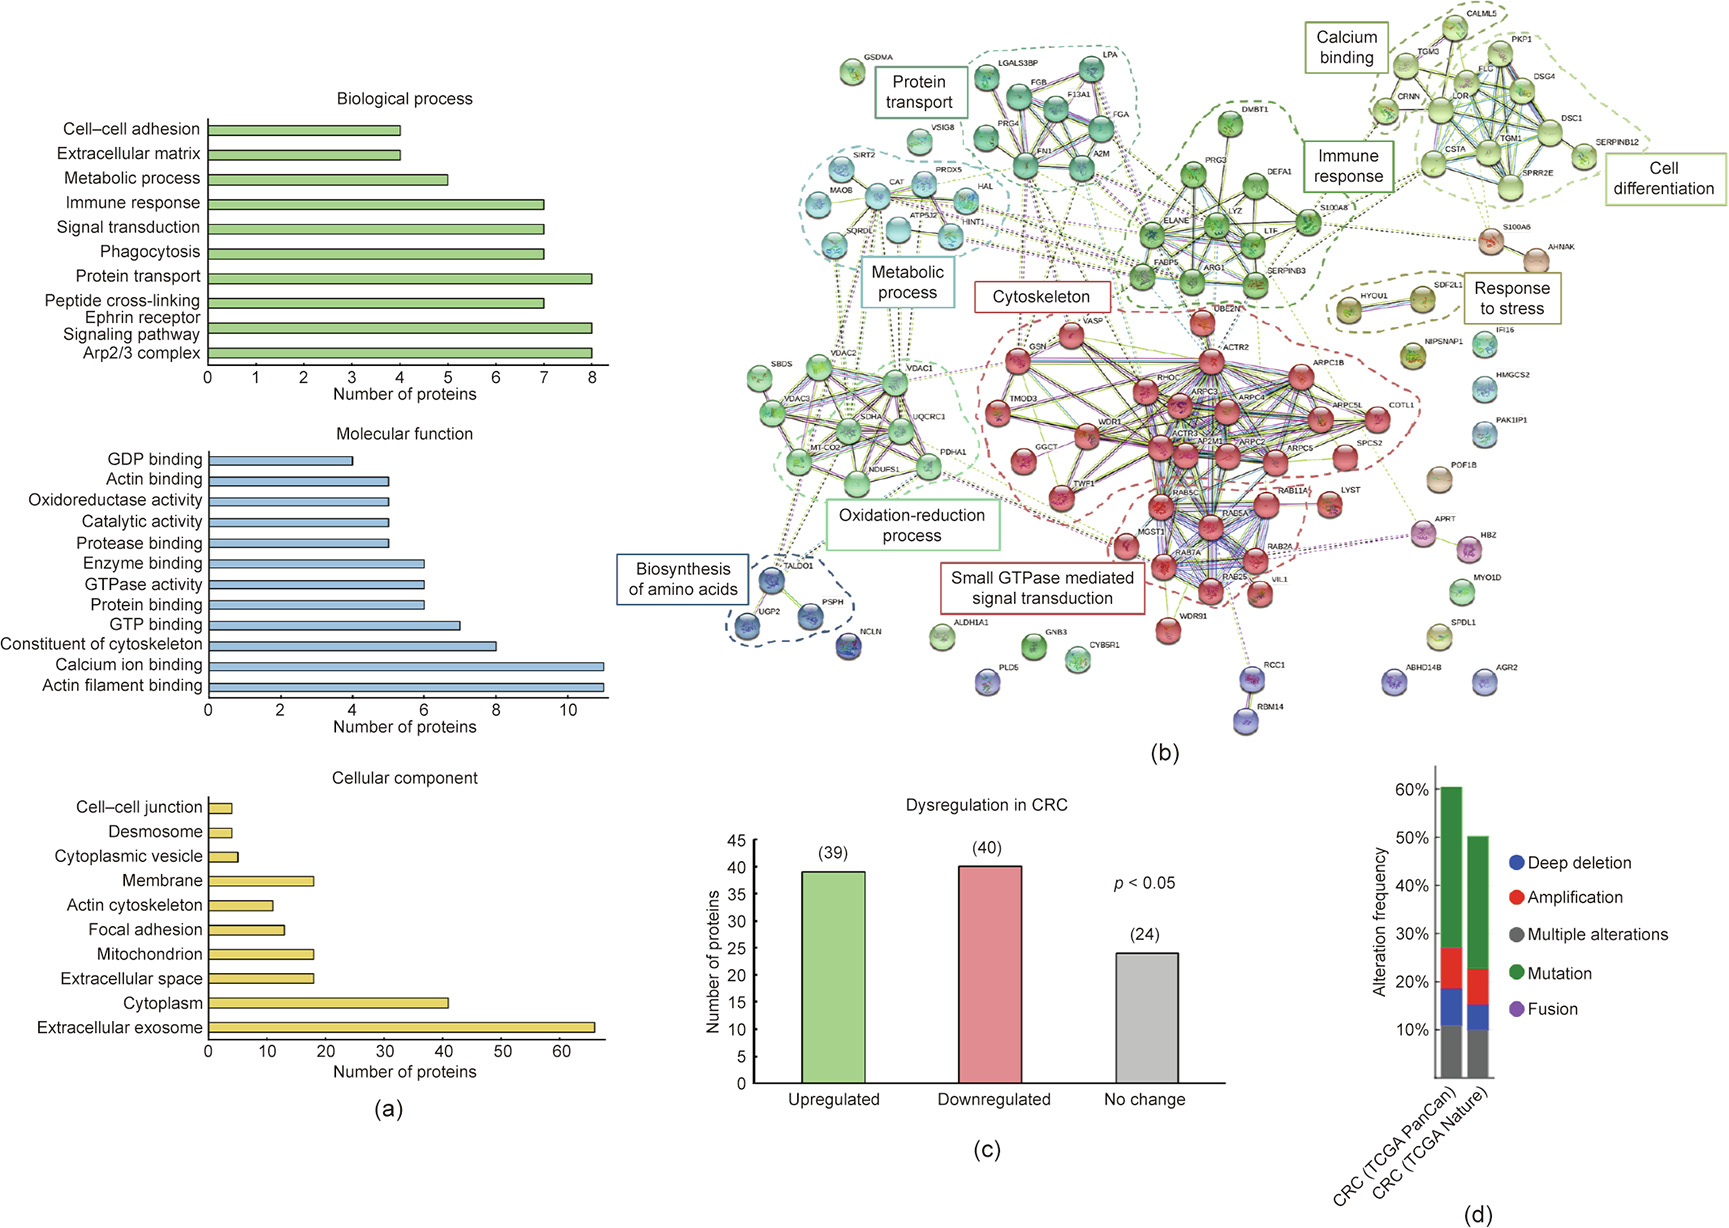
Fig. 4. Bioinformatics and meta-analysis of the proteins selected as potential TAAs specific to CRC. (a) Biological process, molecular function, and cellular component processes in which many of the 103 identified proteins are implicated were determined with the DAVID database. Some of these processes are relevant processes and functions that are altered in cancer development, with some being critical in cancer, such as cell–cell adhesion, metabolic processes, protein transport, or signal transduction. In addition, some of these proteins are in exosomes and in the extracellular space, highlighting their susceptibility to be recognized by the immune system. (b) STRING revealed ten different clusters of interaction among the proteins closely associated with CRC development, such as cell communication, protein transport, or immune response. (c) The UALCAN database showed a statistically significant (p < 0.05) dysregulation in gene expression in CRC tissue samples in comparison with paired healthy tissue samples for 79 proteins out of the 103 proteins identified. (d) cBioPortal revealed gene alterations of 102 of these proteins previously associated with CRC (TCGA Nature 2012 and PanCancer Altas). Alterations in these genes were described in more than 50% of the tissue samples registered in these databases. GDP: guanine dinucleotide phosphate; GTP: guanosine triphosphate.
Next, as the protein targets of autoantibodies are dysregulated in tumoral tissue and might be point mutated, frameshifted, or overexpressed [7,8], among other alterations, we investigated whether genetic dysregulations and/or any other alterations had been previously described for these proteins associated with CRC. With UALCAN, we found a statistically significant dysregulation in the gene expression in CRC tissues in comparison with adjacent paired healthy tissues for 79 proteins out of the 103 proteins identified (p < 0.05), with the gene expression of 39 of them being upregulated in CRC (Fig. 4(c)). In addition, using cBioPortal, we surveyed in two CRC datasets of the cancer genome atlas (TCGA) program (PanCancer Atlas and Nature 2012) for genetic alterations previously described for these proteins. We found that various genetic alterations—mainly mutations—had been previously described for all the identified proteins but one (Fig. 4(d)). Furthermore, gene alterations and aberrant expression were identified in more than 75% of the CRC tissue samples registered in these TCGA datasets. These data confirmed that these proteins suffered from alterations that might induce a humoral immune response in CRC patients.
We then focused on the analysis of 15 of the 103 proteins (Table 2) selected according to: ① genetic alterations and/or dysregulations previously associated with CRC; ② existing information about their association with CRC or other cancers; ③ knowledge about biological processes and cellular localization associated with these proteins; and ④ antibody and cDNA availability.
《Table 2》
Table 2 Proteins identified in the three IP assays with potential diagnostic value for CRC that appear in < 15% of the IP experiments in the CRAPome database.
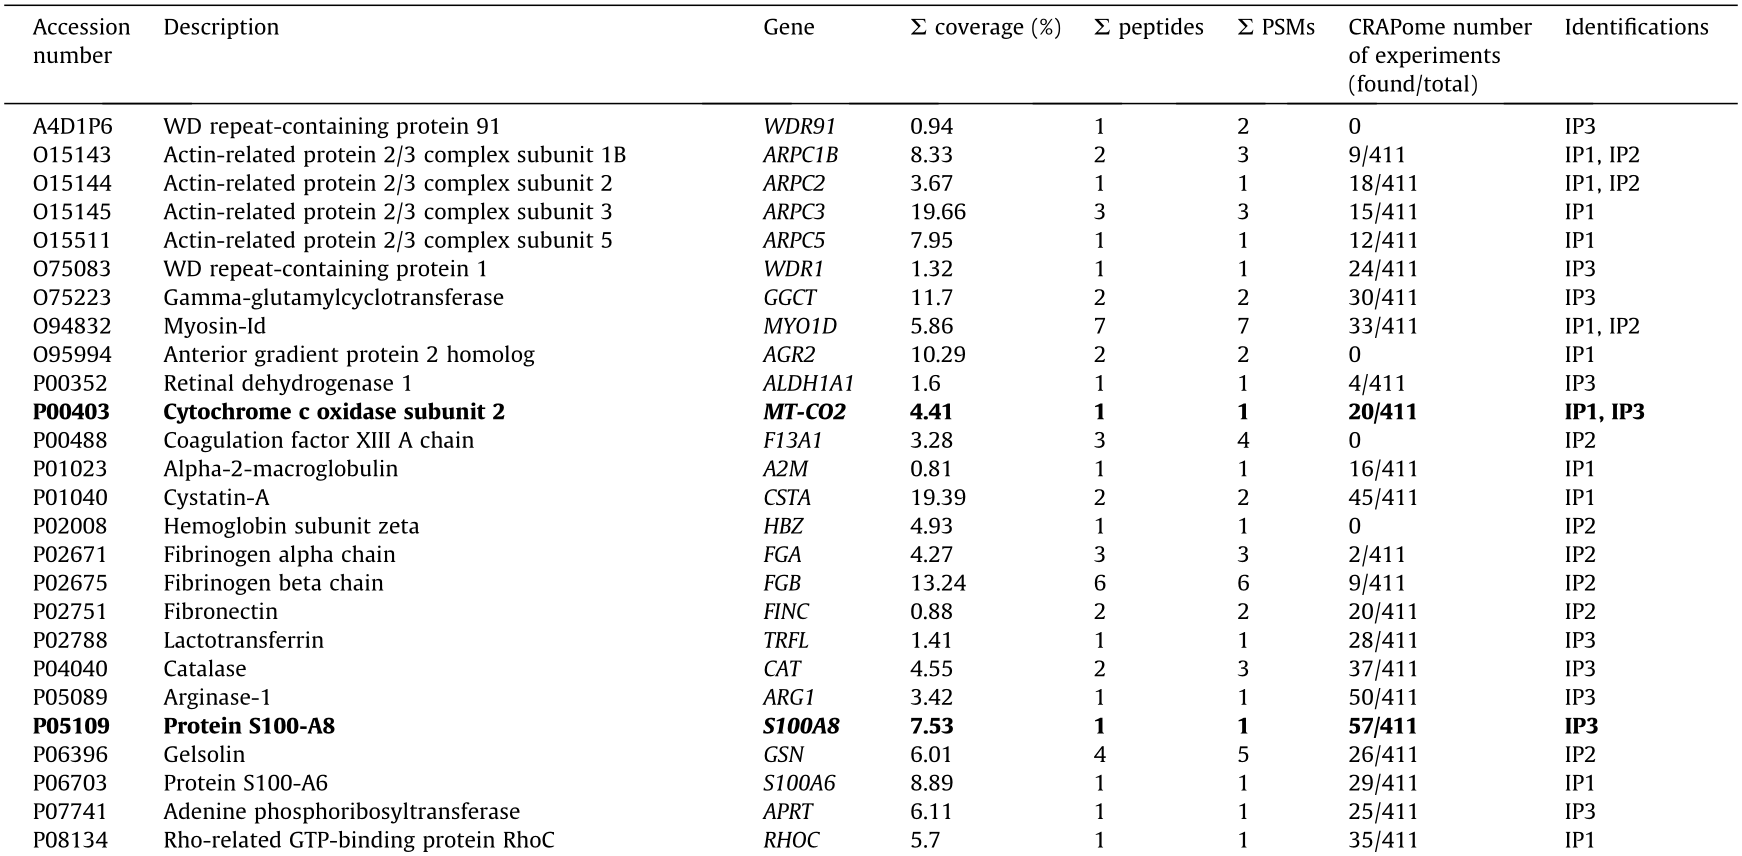
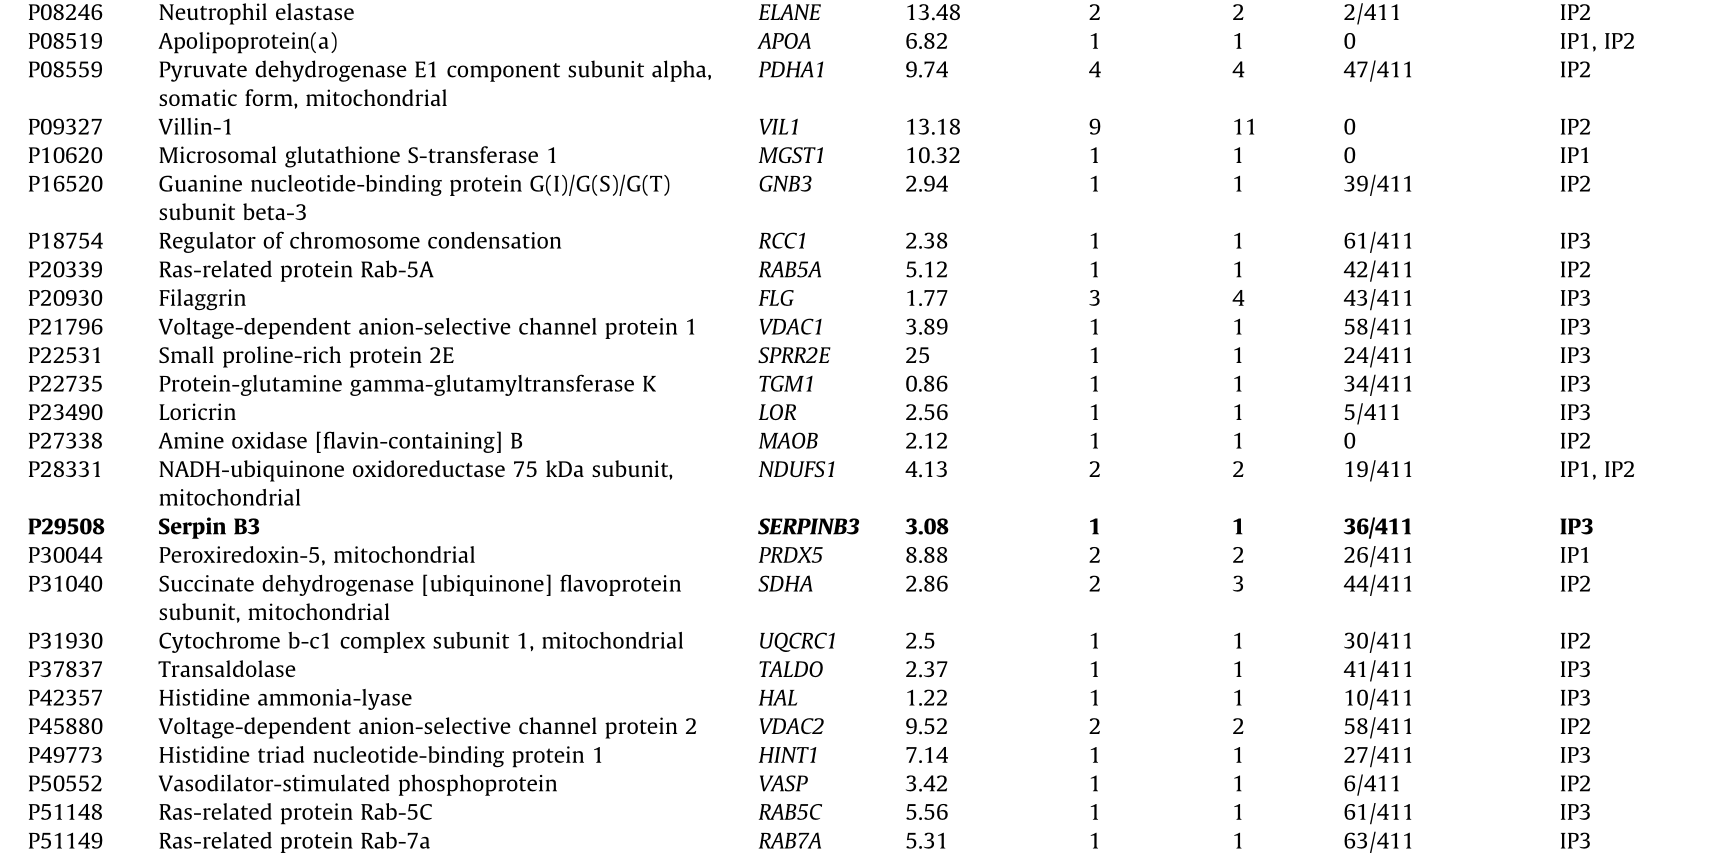
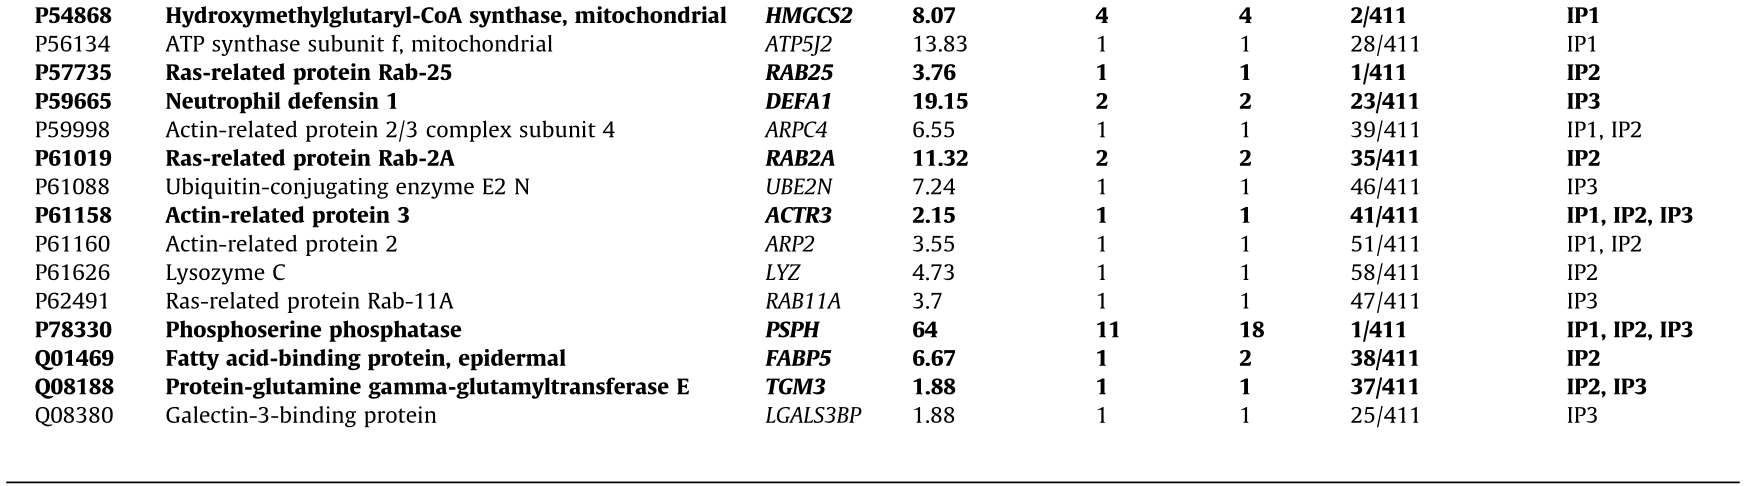

IP1: immunoprecipitation with tissue samples from CRC patients at stages I and II; IP2: immunoprecipitation with tissue samples from CRC patients at stages III and IV; IP3: immunoprecipitation with exosomes secreted by CRC cells.
In bold: The 15 identified proteins more likely to be TAAs specific to CRC among the 103 identified proteins and selected for seroreactivity validation.
NADH: nicotinamide adenine dinucleotide; UTP: uridine-5’-triphosphate; ATP: adenosine triphosphate; NAD: nicotinamide adenine dinucleotide.
 coverage: total percentage of protein sequence coverage sequenced by LC-MS/MS; peptides: total number of peptides; PSMs: total number of peptide spectrum matches.
First, we used WB to analyze their potential dysregulation at the protein level in CRC tissue or in exosomes from CRC patients, in individuals with premalignant lesions, and in healthy individuals. A statistically significant dysregulation was found for eight of the 12 proteins analyzed in the tumoral tissue samples, in comparison with non-tumoral paired tissue samples (n = 17), with SERPINB12, HMGCS2, and FABP5 being downregulated and ACTR3, TGM3, SPDL1, SDF2L1, and RAB25 being upregulated in the tumor samples (Figs. 5(a) and (b)). Interestingly, statistically significant differences were found for nine of the 12 analyzed proteins, when comparing protein levels at different stages of CRC. SDF2L1, RAB25, PSPH, and SPDL1 were upregulated at stages I and III (i.e., early stages). In addition, TGM3 and ACTR3 were observed to be upregulated at all stages of the disease (Fig. 5(c)). In contrast, HMGCS2, FABP5, and SERPINB12 were statistically downregulated at different stages of the disease (Fig. 5(d)), and their levels— together with those of SERPINB3—tend to diminish in parallel to the progression of the disease (Fig. 5(e)).
《Fig. 5》
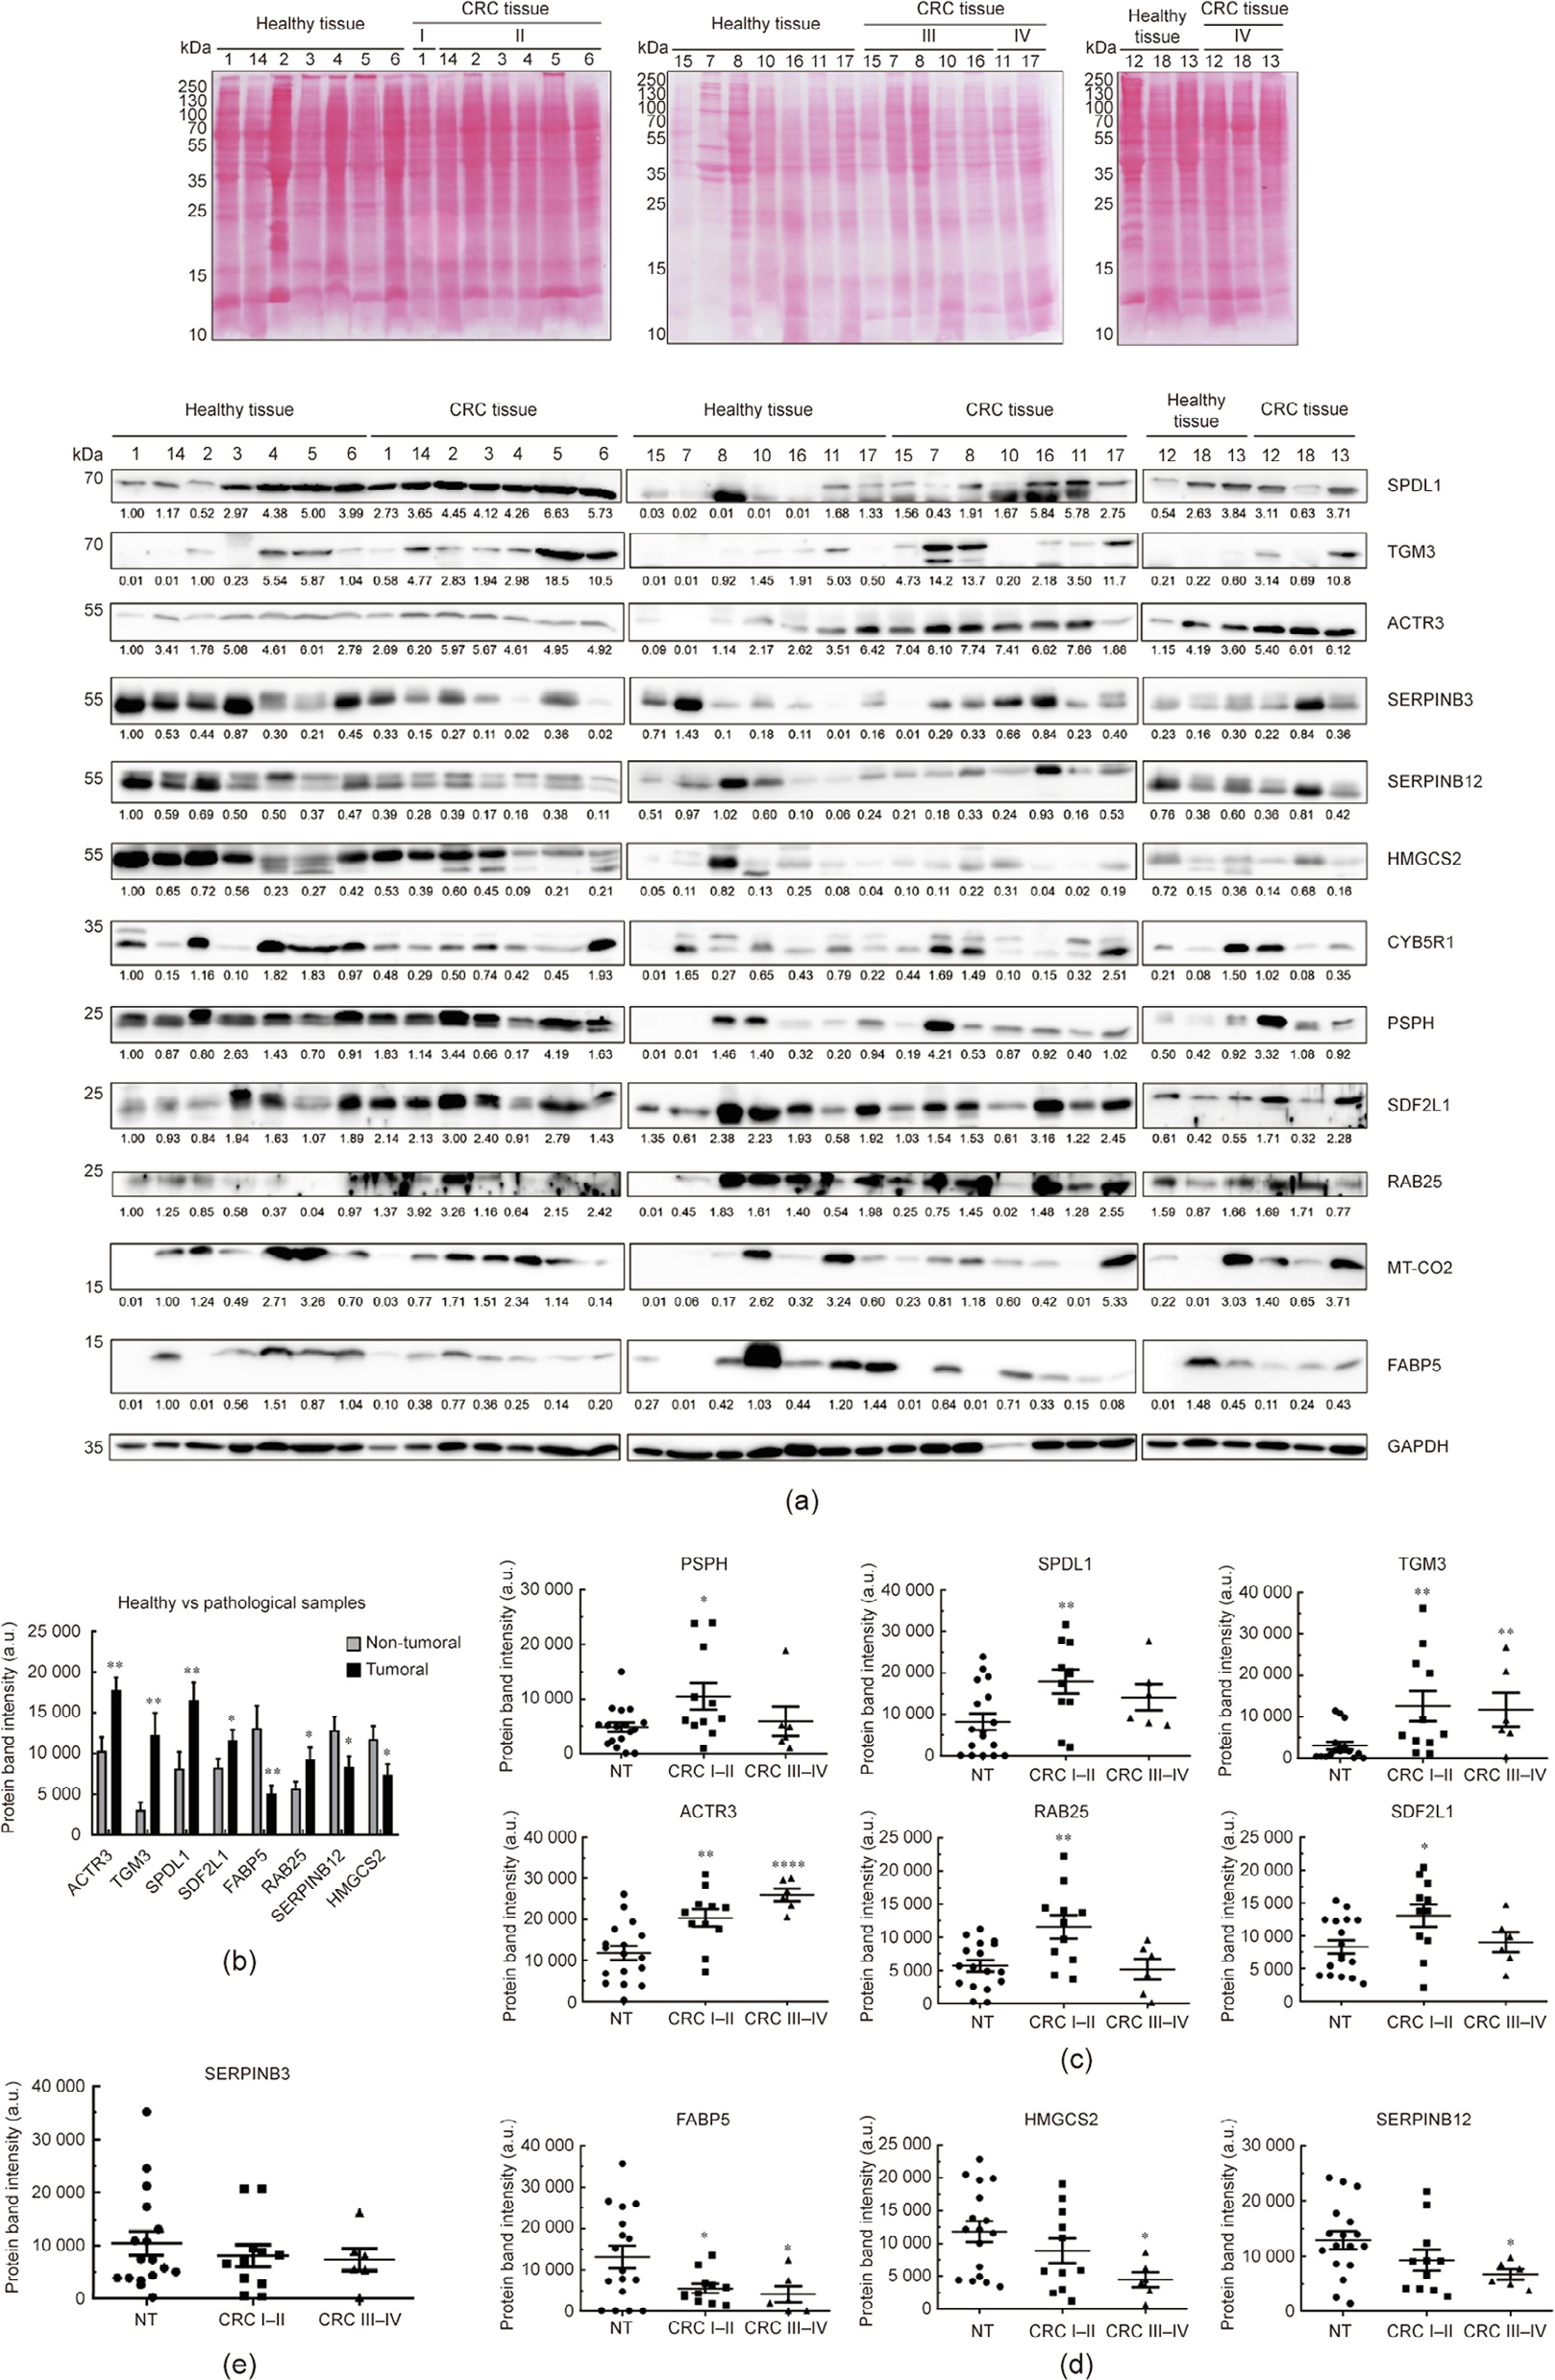
Fig. 5. Analysis of dysregulation at the protein level of the potential TAAs in tissue samples from CRC patients. (a) Ponceau red staining of nitrocellulose membranes and immune blotting of paired tumoral and non-tumoral tissue samples from CRC patients with the 12 potential TAAs analyzed. Glyceraldehyde-3-phosphate dehydrogenase (GAPDH) was used as the control in the assay. Protein bands quantified with ImageJ were normalized according to the total protein lane content based on their respective Ponceau red staining. (b) Significant dysregulation at the protein level between non-tumoral and tumoral tissue samples was found for five of the 12 proteins, with SERPINB12 and FABP5 being downregulated and ACTR3, TGM3 and SPDL1 being upregulated in tumor samples. (c) Overexpression of the proteins SDF2L1, RAB25, PSPH, and SPDL1 was found at stages I and II, whereas TGM3, and ACTR3 were overexpressed at different stages of CRC. (d) Downregulation at the protein level was found for the proteins HMGCS2, FABP5, and SERPINB12, which were observed to diminish in parallel to the progression of the disease, as did SERPINB3 levels. (e) The protein levels of CYB5R1 and MT-CO2 were similar in tumoral and non-tumoral tissue samples. *: p < 0.05; **: p < 0.01; ****: p < 0.0001. Paired tumoral/healthy normal tissue from CRC patients at stage I (1, 2, 3, 4, 5, and 14), at stage II (6, 7, 10, 17, and 18), at stage III (11, 12, 13, 15, and 16), and at stage IV (8) were used. NT: non-tumoral.
In human plasma exosomes (n = 17), differences at the protein level between the pathological and control samples were found for ten of the 12 proteins analyzed, with SPDL1 and SERPINB12 being upregulated, and SERPINB3, ACTR3, MT-CO2, RAB25, HMGCS2, PSPH, TGM3, and SDF2L1 being downregulated in the pathological samples, with a fold change higher than 1.5 and smaller than 0.67, respectively (Figs. 6(a) and (b)). Moreover, TGM3, ACTR3, RAB25, and HMGCS2 levels decreased in parallel to the progression of the disease, from individuals with premalignant lesions to CRC patients (Fig. 6(c)). In addition, reduced levels of SERPINB3, SDF2L1, PSPH, and MT-CO2 were found in CRC patients at early (CRC stages I–II) and late (CRC stages III–IV) stages (Fig. 6(c)). Finally, SPDL1 was downregulated in individuals with premalignant lesions and upregulated in CRC patients, whereas the levels of SERPINB12 increased during the progression of the disease (Fig. 6(c)).
《Fig. 6》
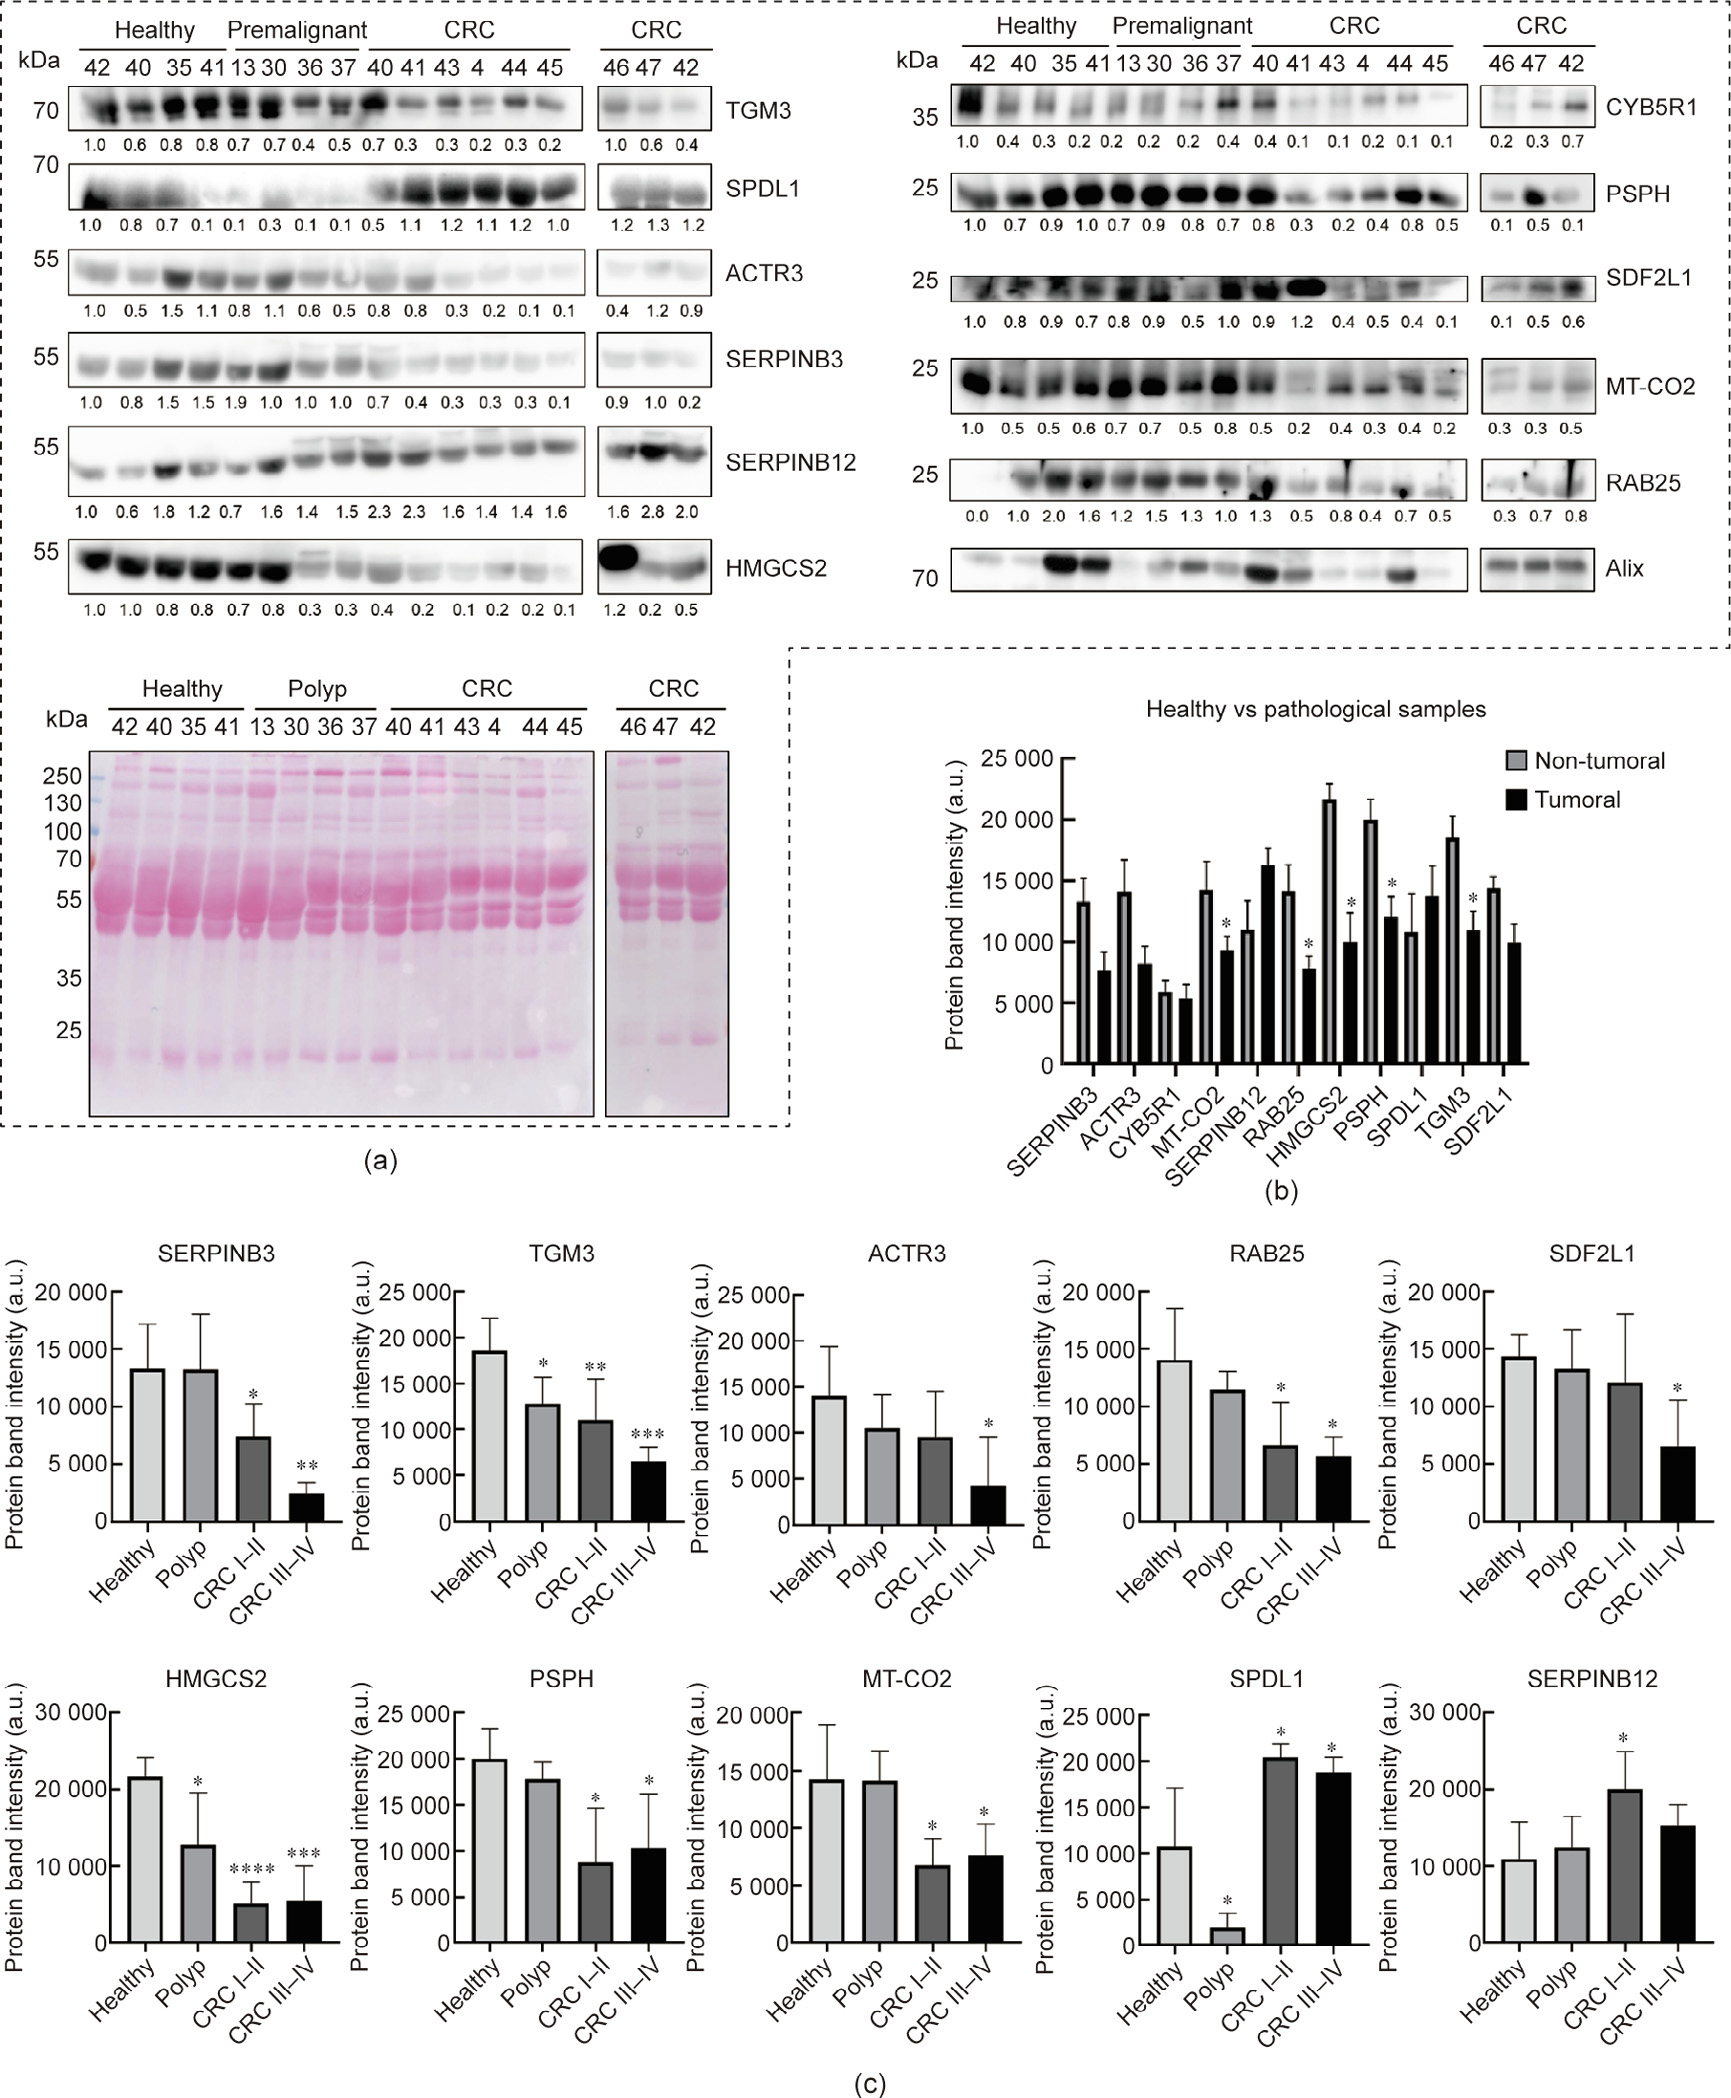
Fig. 6. Dysregulation analysis of potential TAAs in exosomes from human plasma samples. (a) WB of exosomes from CRC patients, from individuals with premalignant lesions, and from healthy individuals with the 12 potential TAAs analyzed and Ponceau red staining of nitrocellulose membranes. Alix was used in the assay as the control for extracellular vesicles. Protein bands quantified with ImageJ were normalized according to the total protein lane content based on their respective Ponceau red staining. (b) Differences at the protein level between pathological individuals (CRC patients and individuals with premalignant lesions) and controls (fold change ≥ 1.5) were found for ten of the 12 proteins analyzed, with SPDL1 and SERPINB12 being upregulated and SERPINB3, ACTR3, MT-CO2, RAB25, HMGCS2, PSPH, TGM3, and SDF2L1 being downregulated in pathological samples. (c) Dysregulation of proteins at different stages of the disease was found for ten of these proteins. TGM3, ACTR3, RAB25, and HMGCS2 protein levels decreased in parallel to the progression of the disease. SERPINB3, SDF2L1, PSPH, and MT-CO2 were overexpressed in CRC patients at early (CRC I–II) and late (CRC III–IV) stages. SPDL1 was downregulated in individuals with premalignant lesions and overexpressed in CRC patients, and SERPINB12 protein levels increased during the progression of the disease. Protein levels of CYB5R1 were similar in healthy individuals and patients, and FABP5 was not detected in exome samples. Outliers were not considered in the analysis. *: p < 0.05; **: p < 0.01; ***: p < 0.001; ****: p < 0.0001. Exosomes from CRC samples at stage I (40, 41, 46, and 47), stage II (43), stage III (4 and 42), and stage IV (44 and 45) were used in comparison with exosomes from healthy and premalignant individuals. Polyp: premaglinant lesions.
《3.4. Role of the identified CRC TAAs in CRC prognosis》
3.4. Role of the identified CRC TAAs in CRC prognosis
Next, we used IHC and meta-analysis to investigate the role of the 15 selected proteins as CRC prognosis markers. Due to antibody availability, we used IHC to analyze the association with CRC prognosis of SPDL1, ACTR3, and SDF2L1 at the protein level using four different tissue microarrays (TMAs) related to the metastasis or recurrence of CRC (Figs. 7(a) and (b)). ACTR3 and SPDL1 showed cytoplasmic staining, whereas SDF2L1 showed both cytoplasmic and nuclear staining (Fig. 7(a)). ACTR3 was significantly associated with CRC lymph node metastasis. In addition, SPDL1 could statistically differentiate the lymph nodes CRC metastatic patients from those CRC patients with no lymph node metastasis. No statistically significant differences were found between patients with and without lung or liver metastasis, but higher levels of SPDL1 were associated with liver and lung metastasis. Interestingly, nuclear SDF2L1 could statistically discriminate between CRC patients according to their recurrence status and survival, with lower levels of SDF2L1 being associated with the worst prognosis and recurrence (Fig. 7(b)).
《Fig. 7》

Fig. 7. Evaluation of the prognostic association of the identified TAAs target of autoantibodies in CRC. (a) Representative SPDL1, ACTR3, and SDF2L1 IHC staining images. (b) IHC analysis showed an association between ACTR3 and lymph node metastasis; between SDF2L1 and recurrence and survival status; and between nuclear SPDL1 and lymph node metastasis (*: p < 0.05). (c–e) Association of the combination of nine proteins (S100A8, MT-CO2, CYB5R1, FABP5, ACTR3, TGM3, SDF2L1, HMGCS2, and SPDL1) with CRC patients’ survival. The association of the signature with the prognosis of CRC and other cancers was investigated with GEPIA2. Colorectal adenocarcinoma TCGA dataset was surveyed in comparison with breast cancer, prostate adenocarcinoma, stomach-gastric adenocarcinoma, lung adenocarcinoma, esophageal cancer, liver adenocarcinoma, and pancreatic adenocarcinoma as controls for the specific association of the nine-gene signature with CRC prognosis.
To extend our study to the other 12 proteins, a Kaplan–Meier analysis of the overall survival of patients with colon cancer was performed, comparing differences between low and high mRNA expression levels. Interestingly, significant association with CRC prognosis in patients was found for S100A8, MT–CO2, CYB5R1, HMGCS2, FABP5, SDF2L1, ACTR3, SPDL1, and TGM3 with the logrank test. It was found that high mRNA levels of S100A8, MTCO2, and CYB5R1 were associated with a worse prognosis of CRC patients, whereas overexpression of FABP5, ACTR3, TGM3, SDF2L1, HMGCS2, and SPDL1 was associated with a higher probability of survival (Fig. S3 in Appendix A). Finally, the GEPIA2 tool was used to investigate the association of the gene signature with the prognosis of CRC patients and patients with other cancers. Remarkably, a strongly significant association at the mRNA level with higher survival was found by comparing differences between high- versus low-expression CRC groups with the log-rank test (p = 0.0069) (Fig. 7(c)). Importantly, this gene signature was also surveyed in other cancers under the same conditions to assess its association with CRC. Upon retrieving data from the other 31 cancer datasets of the TCGA project, the signature showed no significance for the association with overall survival for gastrointestinal (esophageal, liver, gastric, and pancreatic) and most prevalent (prostate, breast, and lung) cancers (Figs. 7(d) and (e)). On the other hand, a significant association with lower survival was found for glioblastoma, brain lower grade glioma, cervical squamous cell carcinoma, skin cutaneous melanoma, thyroid carcinoma, uterine carcinosarcoma, and uveal melanoma. No association was found for other cancers (Fig. S4 in Appendix A). These results suggest that the signature is associated with higher overall survival of CRC patients.
Because autoantigens are self-proteins that are altered during the course of the disease, the fact that many of these proteins were previously described as being altered or were here observed as being dysregulated in CRC at the mRNA level and at protein level by WB and IHC supports their potential role as actual TAAs specific to the disease.
《3.5. Seroreactivity luminescence assays of the potential TAAs》
3.5. Seroreactivity luminescence assays of the potential TAAs
Next, as the goal of this work was to identify proteins targeted by autoantibodies and with diagnostic ability for subsequent integration into POC devices, we investigated the seroreactivity of the selected 15 proteins as fusion proteins to Halotag (Table 2).
We analyzed the seroreactivity of these proteins against 112 individual plasma samples from CRC patients at stages I to IV (n = 38), from individuals with premalignant lesions (n = 36), and from healthy individuals with negative colonoscopy (n = 38) by luminescence Halotag-based beads immunoassays, including p53 and cHalo proteins as positive and negative controls, respectively. Proteins cloned into the pANT7_cHalo vector and expressed in vitro with HeLa extracts, as proteins fused to Halotag in their C-terminal end, were covalently anchored to MBs throughout the Halotag, individually incubated with each plasma sample and, subsequently, incubated with the secondary HRP-anti Human IgG antibody (Fig. 8(a)). First, we observed higher levels of autoantibodies against all these proteins in the pathological group (CRC patients and individuals with premalignant lesions) in comparison with the healthy individuals group, with 14 proteins being statistically significant (p < 0.05) out of 15 (Fig. 8(b)). In addition, all but SERPINB12, FABP5, SERPINB3, and DEFA1 were able to statistically discriminate (p < 0.04) between healthy controls and premalignant subjects, as was p53 (Fig. 8(c)). Furthermore, all but SERPINB12, RAB2A, and FABP5 were able to significantly discriminate (p < 0.04) between healthy controls and CRC patients (Fig. 8(d)), unlike p53 (p = 0.09).
《Fig. 8》
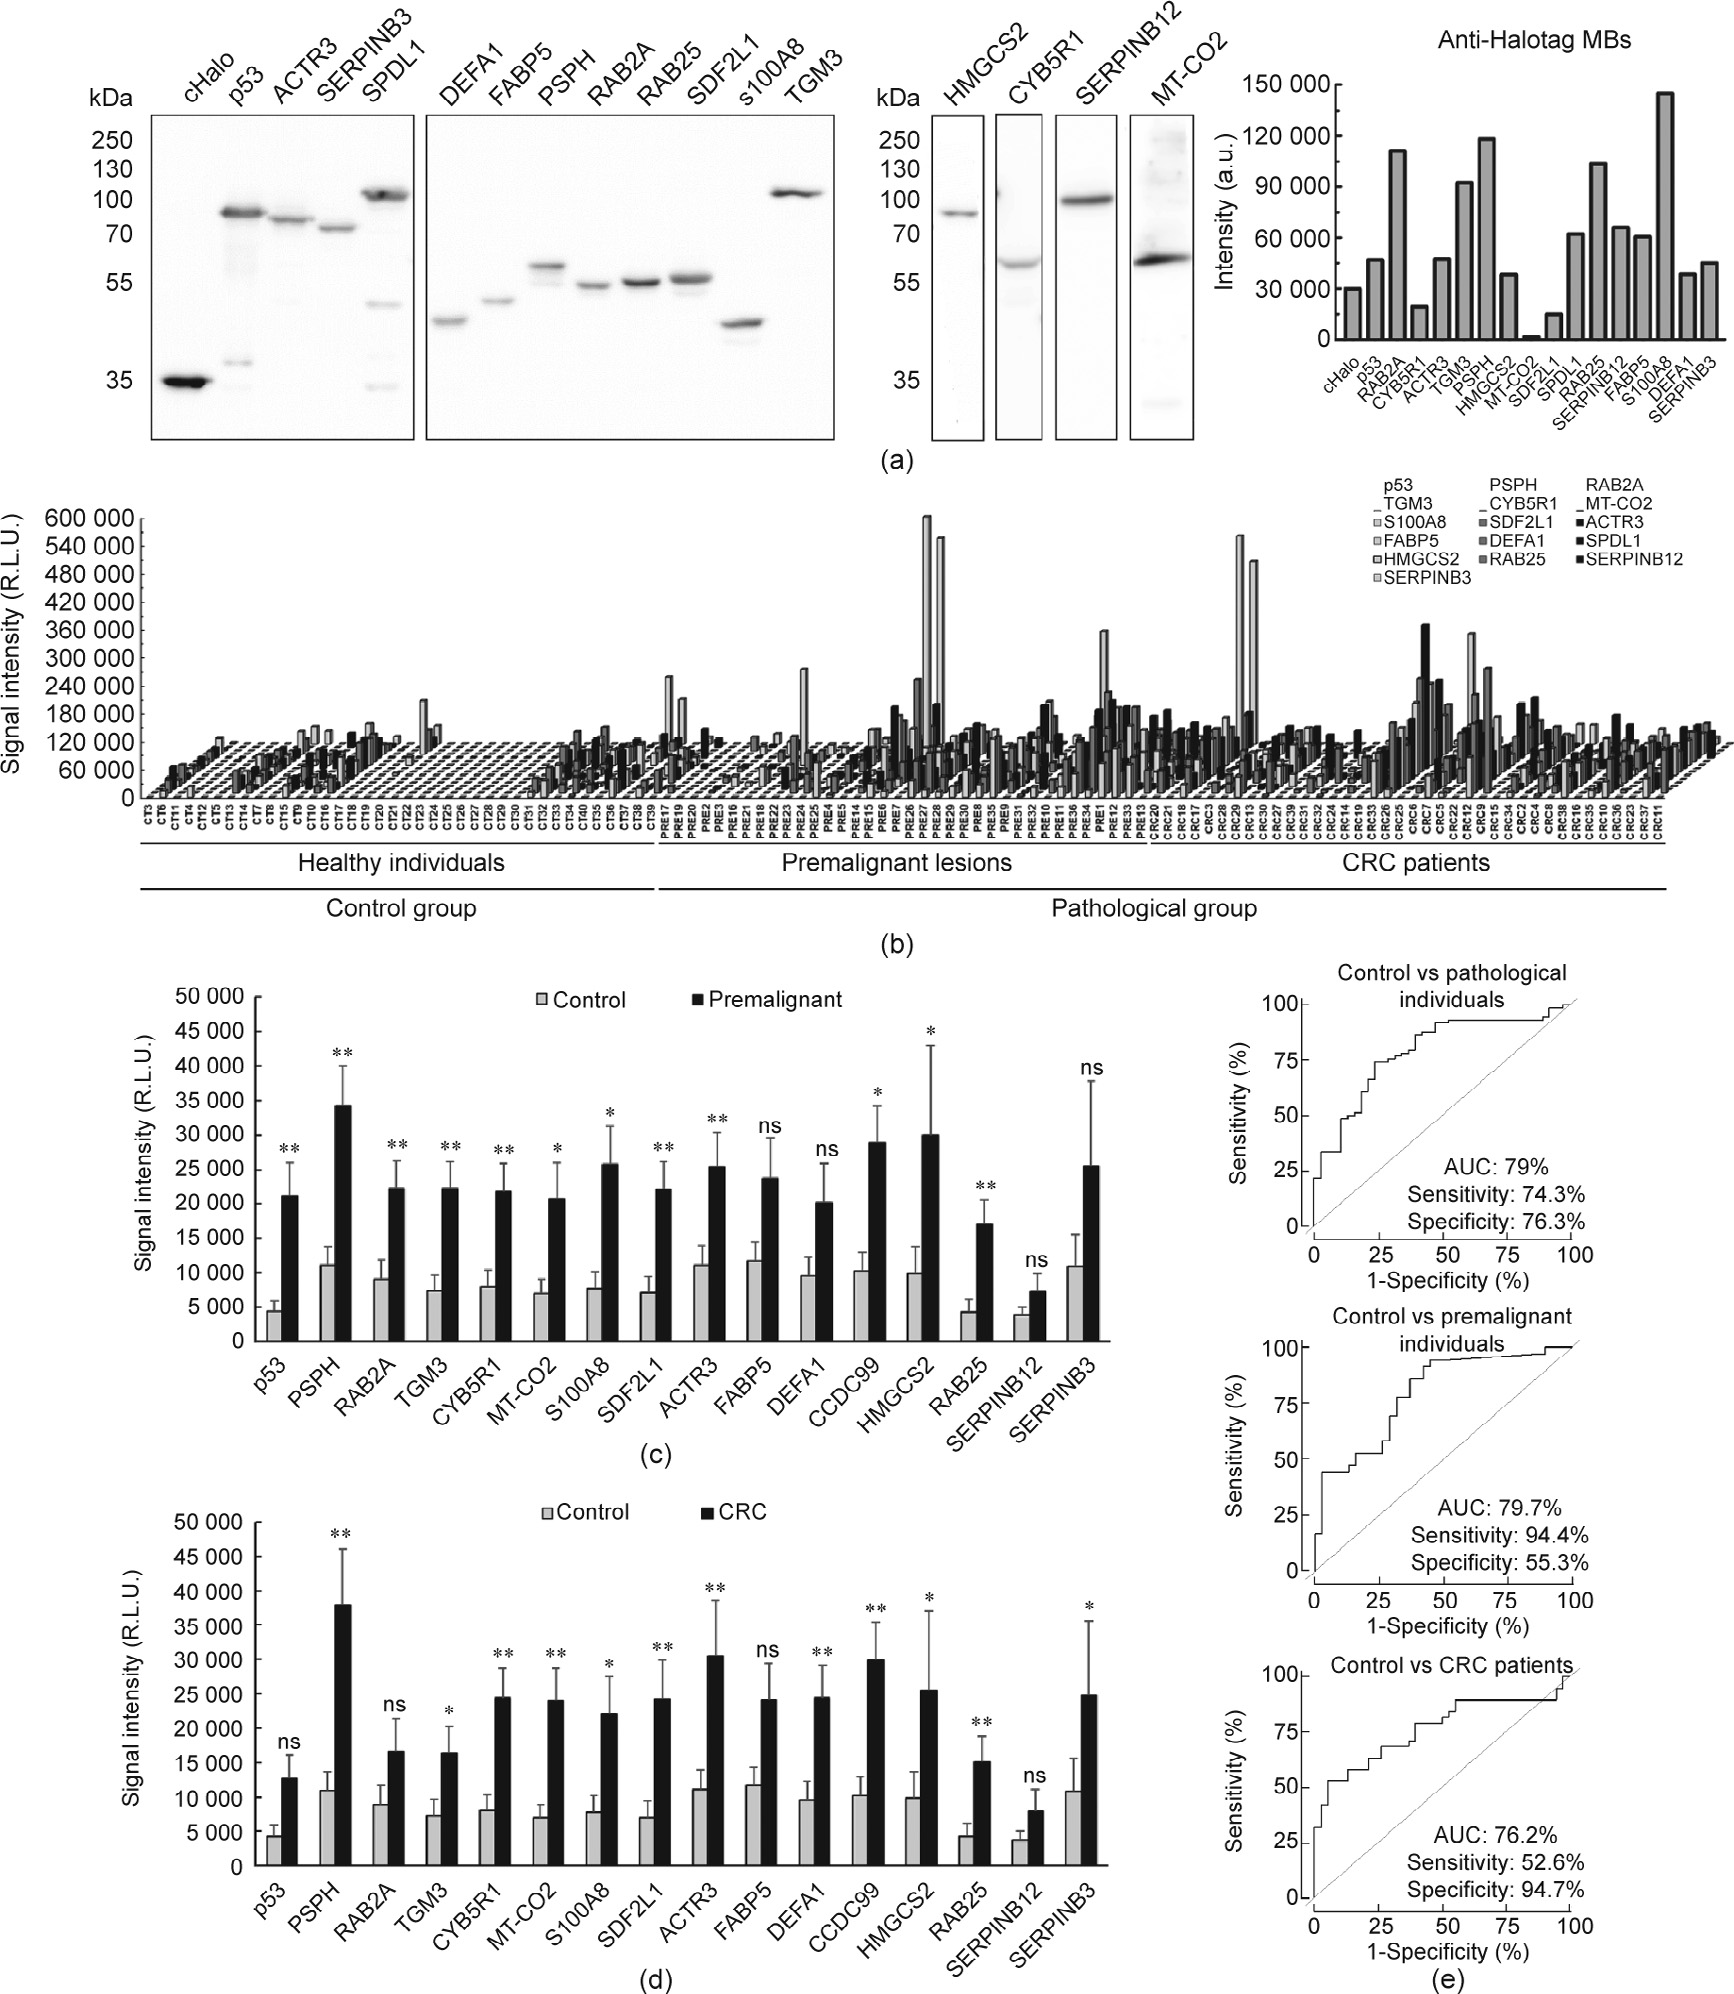
Fig. 8. Luminescence Halotag-based bead assays with the potential TAAs. (a) Confirmation of the proper cloning as Halotag fusion proteins and the in vitro expression of the 15 proteins investigated by luminescence assays was performed by WB. All proteins were recognized by the anti-Halotag antibody. (b) Differences in autoantibody levels among the 112 individual plasma samples from CRC patients, individuals with premalignant lesions, and healthy individuals (Table 1 and Table S1). All TAAs selected except for SERPINB12 could statistically differentiate between the pathological and control groups (p < 0.05), as could p53. (c) Seroreactivity against PSPH (p = 0.002), RAB2A (p = 0.008) , TGM3 (p = 0.005), CYB5R1 (p = 0.007), MT-CO2 (p = 0.019), S100A8 (p = 0.018), SDF2L1 (p = 0.002), ACTR3 (p = 0.009), SPDL1 (p = 0.010), HMGCS2 (p = 0.039), RAB25 (p = 0.009), and p53 (p = 0.004) could statistically discriminate between premalignant lesions and healthy individuals. (d) Autoantibody levels against PSPH (p = 0.001), TGM3 (p = 0.040), CYB5R1 (p = 0.003), MT-CO2 (p = 0.004), S100A8 (p = 0.040), SDF2L1 (p = 0.004), ACTR3 (p = 0.007), DEFA1 (p = 0.008), SPDL1 (p = 0.003), HMGCS2 (p = 0.043), RAB25 (p = 0.003), and SERPINB3 (p = 0.042) could statistically discriminate between healthy individuals and CRC patients. (e) Evaluation of the diagnostic value of 14 potential TAAs with differentially seroreactivity to patients than to healthy individuals. The combination of p53 and the 15 proteins except for SERPINB12 showed an AUC of 79% and a sensitivity and specificity of 74.3% and 76.3%, respectively, in discriminating between pathological individuals (individuals with premalignant lesions and CRC patients) and healthy individuals (upper panel). Combined detection of autoantibodies against PSPH, RAB2A, TGM3, CYB5R1, MT-CO2, S100A8, SDF2L1, ACTR3, SPDL1, HMGCS2, RAB25, and p53 showed an AUC, a sensitivity, and a specificity of 79.7%, 94.4%, and 55.3%, respectively, in discriminating between premalignant individuals and healthy individuals (middle panel). The combination of PSPH, TGM3, CYB5R1, MT-CO2, S100A8, SDF2L1, ACTR3, DEFA1, SPDL1, HMGCS2, RAB25, and SERPINB3 showed an AUC of 76.2%, and a sensitivity and specificity of 52.6% and 94.7%, respectively, in differentiating CRC patients from healthy individuals (lower panel). ns: not significant; R.L.U.: relative light unit; *: p < 0.05; **: p < 0.01.
Next, to further investigate the diagnostic value of these autoantibodies, the premalignant group was divided into lowand high-grade adenoma groups, in order to compare their seroreactivity with that of the healthy individuals and the CRC groups (Fig. S5(a) in Appendix A). First, both the low- and high-grade adenoma groups were more seroreactive than healthy individuals. p53, PSPH, RAB2A, TGM3, ACTR3, CYB5R1, MT-CO2, S100A8, SDF2L1, and SPDL1 were able to statistically distinguish low-grade adenomas from healthy individuals (p < 0.009), and p53, TGM3, S100A8, SDF2L1, and RAB25 were able to statistically distinguish high-grade adenomas from healthy individuals (p < 0.05). However, although differences in seroreactivity intensity were found between the low- and high-grade adenoma and CRC groups, none of these TAAs were able to statistically discriminate CRC patients from individuals with premalignant lesions.
Collectively, these results demonstrate that SPDL1, FABP5, SERPINB3, DEFA1, CYB5R1, TGM3, ACTR3, SDF2L1, S100A8, RAB25, RAB2A, PSPH, MT-CO2, and HMGCS2 are autoantigens whose seroreactivity can distinguish CRC patients and/or premalignant colorectal individuals from healthy individuals.
《3.6. Analysis of the diagnostic value of the identified CRC TAAs》
3.6. Analysis of the diagnostic value of the identified CRC TAAs
To evaluate the diagnostic value of the 15 TAAs, individual and combined ROC curves were obtained (Fig. 8(e) and Table S8 in Appendix A). All TAAs showed an area under the curve (AUC) higher than 60% in discriminating premalignant individuals from controls, with PSPH and SDF2L1 showing AUCs higher than 70% and a sensitivity and specificity of up to 72.2% and 78.9%, respectively. Moreover, the autoantibodies against all TAAs but p53 statistically discriminate between CRC patients and healthy individuals, showing the highest AUCs for PSPH and SPDL1 of up to 70.5%, with a sensitivity and specificity of up to 76.3% and 60.5%, respectively. Importantly, the TAAs showing statistically significant seroreactivity also showed: an AUC of 79% and a sensitivity and specificity of 74.3% and 76.3%, respectively, in discriminating between pathological colorectal individuals and controls; an AUC of 79.7% and a sensitivity and specificity of 94.4% and 55.3%, respectively, in discriminating between premalignant individuals and controls; and an AUC of 76.2% and a sensitivity and specificity of 52.6%, and 94.7%, respectively, in differentiating CRC patients from healthy individuals.
To further analyze the early diagnostic value of these TAAs, the individual and combined ROC curves of the proteins with differential seroreactivity to low- and high-grade adenoma in comparison with healthy individuals were obtained (Table S8 and Fig. S5(b) in Appendix A). The TAAs exhibited individual AUCs between 55.7% and 79.6% in discriminating between low- or high-grade adenomas and healthy individuals. In combination, the TAAs showed an AUC of 84.1% and a sensitivity and specificity of 73.7% and 81.6%, respectively, in discriminating between low-grade adenomas and healthy individuals; and an AUC of 75% and a sensitivity and specificity of 76.5% and 78.9%, respectively, in discriminating between high-grade adenomas and healthy individuals.
These results highlight the usefulness of the CRC TAAs identified here as blood-based biomarkers for the detection of either early colorectal lesions or CRC; thus, these TAAs should be part of diagnostic panels for CRC detection. Accordingly, we analyzed the TAAs on a multiplexed electrochemical immunosensing platform to determine which could be included in a POC device for use in a clinical setting for the detection of CRC.
《3.7. Analysis of the diagnostic value of the identified TAAs as targets of CRC autoantibodies in POC-like devices》
3.7. Analysis of the diagnostic value of the identified TAAs as targets of CRC autoantibodies in POC-like devices
Under previously optimized conditions [41,42], the ability of the developed biosensing platform to detect the presence of autoantibodies against the identified TAAs in human plasma was tested. Random plasma samples from two healthy individuals, two premalignant individuals, and two CRC patients were analyzed. Remarkably, the control individuals showed a significantly lower seroreactivity in comparison with the premalignant and CRC patients. More importantly, as previously observed via luminescence, most of the CRC and colorectal premalignant patients were reactive to > 8 TAAs, apart from p53. All premalignant and CRC individuals possessed autoantibodies for more than eight CRC autoantigens and showed a clear signal in comparison with healthy individuals and above the background (Fig. 9). Taken together, these results demonstrate the usefulness of this methodology as a potential clinical tool for the detection of CRC. More importantly, our results demonstrate that these TAAs should be included in signature panels for CRC detection by a simple blood test.
Collectively, these results highlight the usefulness of the followed approach not only to identify TAAs with significant diagnostic ability, but also to find proteins target of autoantibodies involved in the progression of CRC that are useful as CRC prognostic markers. Moreover, our results showed that the developed luminescence or biosensing approaches overcome drawbacks regarding the purification, degradation, and immobilization of proteins, and thus have excellent potential for use in the detection of CRC through a POC device.
《Fig. 9》

Fig. 9. Autoantibody measurement in plasma samples by the multiplexed electrochemical immunosensing platform. (a) The individual amperometric responses for the indicated proteins obtained for randomly selected plasma samples were visualized using the MultiExperiment Viewer (v4.9.0, Massachussetts, USA). Notably different amperometric responses were obtained among CRC patients (CRC), individuals with premalignant lesions (PRE), and healthy control individuals (CT). Green signal: absence or low amperometric responses; black signal: intermediate responses; red signal: high amperometric responses. (b) The actual amperometric responses obtained for the TAAs were larger for the premalignant and CRC patients in comparison with those for healthy individuals, in whom they were considerably lower or undetectable.
《4. Discussion》
4. Discussion
Longer life expectancy and the progressive aging of the global population are causing a marked increase in chronic diseases. According to the World Health Organization, chronic diseases are and will be—as the population ages—the main economic burden on health systems. Chronic diseases are the main cause of disability and are responsible for 63% of deaths around the world. CRC is one of the non-infectious chronic diseases with the highest prevalence. To reduce its impact on society and on healthcare costs, a comprehensive approach must be applied for CRC prevention and control. In this sense, the best cancer treatment strategy involves reinforcing CRC detection at the early stages for cancer prevention while identifying new specific diagnostic biomarkers, as this strategy would make it possible to treat individuals before the disease evolves and thereby improve both their survival and quality of life. Such a strategy would also reduce the healthcare costs associated with CRC, since it is much cheaper to treat patients at early stages, when the disease is curable, than at advanced stages, when the possibility of a cure is seriously compromised. To this end, it is necessary to identify and validate useful biomarkers for the early detection of CRC while developing new diagnostic tools that allow multiple and simultaneous detection of these biomarkers. These are the main objectives of this work, which focuses on the identification and validation of protein biomarkers based on the humoral response that can be used for the early diagnosis of CRC, as well as on the development of novel diagnostic platforms to integrate these biomarkers.
In this work, we employed an integral multilevel approach ranging from the identification and validation of TAAs from exosomes and CRC tissue samples to the construction of a POC device able to integrate the identified and validated TAAs into a signature for the detection of CRC patients and premalignant colorectal individuals. First, we used a recently developed approach involving IP directly coupled to LC-MS/MS and CRC cell protein extracts [14]. Second, this approach allowed us to identify novel autoantibodies and their protein targets associated with CRC by analyzing two poorly studied sources of autoantigens. We analyzed exosomes and frozen tissue samples to investigate the TME beyond cancer epithelial cells. This allowed us to obtain a global picture of CRC TAAs, in addition to previously identified TAAs from CRC cells via LC-MS/MS [14] or the screening of protein microarrays [11]. Third, we validated these results using orthogonal techniques and meta-analysis, and demonstrated that all but one of the identified proteins target of autoantibodies were dysregulated at the mRNA and/or protein level. Moreover, this dysregulation was associated with the prognosis of the CRC patients. In this sense, we have demonstrated that proteins target of the humoral immune response of CRC patients can be used for their diagnosis and prognosis. Remarkably, we have established a nine-gene signature associated with good CRC prognosis, which is not associated with any other gastrointestinal or highly prevalent cancer. Importantly, the autoantibodies against the TAAs identified herein were able to detect precancerous lesions as well as CRC. Thus, these TAAs meet the criteria for integration into diagnostic panels that can be used to detect early and advanced CRC lesions. This information would allow clinicians to monitor individuals who are at high risk of developing CRC. Clinicians could then detect potential lesions through liquid biopsy and remove premalignant lesions with colonoscopy, as well as detecting CRC in any stage of the disease.
Finally, and as the main goal of this work, we have not only validated the differential seroreactivity of 15 TAAs through recently developed self-assembled luminescence immunoassays [41,42] and further demonstrated their usefulness for CRC diagnosis, but also integrated them into a POC biosensing device platform. Such a platform could be incorporated into a clinical setting for the detection of CRC and colorectal premalignant individuals.
To identify the TAAs, we examined two complementary sources of TAAs: CRC exosomes and the CRC TME from frozen tumoral tissue. We hypothesized that, as the extracellular vesicles circulating in the blood and the lymphatic vessels are key mediators of intercellular communication with cells located in distal organs, tumorderived exosomes should be an interesting source for the discovery of TAAs target of the autoantibodies of CRC patients. In addition, since the TME contributes to regulating neoantigen expression and immune-cell infiltration [20], we hypothesized that an analysis of CRC tumor tissue encompassing cancer cells and tumor stroma should be an interesting source for identifying tumor stroma neoantigens that have been missed by the analysis of cancer cells in culture [14]. Importantly, these sources have been largely unexplored for the identification of CRC-specific TAAs. Here, eight out of 15 validated CRC TAAs were identified from exosomes, and 11 were identified from CRC tumoral tissue (with four TAAs being found in common). One of the interesting results from this study stemmed from the observation that KM12C and SW480 cells, which have low metastatic capacity, secreted a larger number of vesicles than their corresponding isogenic metastatic cells. SW480 cells showed the highest exosome secretion, while KM12SM and KM12L4a had the least concentrated exosome samples despite being isolated from the same volume of conditioned media. These findings may be associated with the metastatic role of these cells, which must prepare the metastatic niche for colonization, in contrast to the situation with non-metastatic cell lines [46].
One of the goals of this study was to identify the TAAs of proteins that showed dysregulation either at the mRNA or the protein level in CRC. We found that all the proteins target of autoantibodies, except for one, were dysregulated in CRC patients. Importantly, we observed that SERPINB12, SDF2L1, RAB25, ACTR3, TGM3, and PSPH showed an opposite dysregulation in tissue and exosomes. These results indicate potentially different roles of these proteins in tumoral dissemination. In this sense, proteins that are downregulated in exosomes and upregulated in tissue samples, such as SDF2L1, ACTR3, or TGM3, might be retained in the primary tumor because they are necessary for its maintenance. In contrast, proteins that are upregulated in exosomes and downregulated in tissue samples might be involved in the establishment or maintenance of the metastatic niche, due to the role of exosomes in mediating cell communication between distal cells. These findings also suggest that the dysregulation of proteins carried by exosomes can induce a humoral immune response in CRC patients, since these proteins are more exposed to the immune system of CRC and colorectal premalignant individuals than that the proteins of the tumoral tissue.
Regarding our validated CRC TAAs dataset, SPDL1, SDF2L1, SERPINB3, and MT-CO2 have not been previously described as cancer autoantigens, nor have they been identified as being related to CRC. In contrast, although PSPH has not been previously described as a cancer autoantigen, it has been previously associated with CRC, as it was described as a potential driver gene in chromosome 7p [47]. Similar findings were observed for FABP5, S100A8, RAB2A, ACTR3, CYB5R1, TGM3, HMGCS2, and DEFA1: These proteins have been described as being altered in CRC, without being described as cancer autoantigens target of autoantibodies. FABP5 has been described as promoting cell growth and the metastatic potential of CRC cells [48]. S100A8 contributes to CRC [49], and RAB25 and RAB2A have been described as a tumor suppressor and a novel oncogene in colon cancer [50,51], respectively. ACTR3 has been found to be altered in CRC and metastasis [52,53], and HMGCS2 has been described as enhancing invasion and metastasis in CRC [54]. CYB5R1 has been described as being associated with the epithelial-to-mesenchymal transition transition and as a poor prognosis of CRC [55]. TGM3 has been reported as acting as a tumor suppressor in the progression of CRC [56]. Moreover, DEFA1 was found to be overexpressed in colon carcinoma [57]. Remarkably, the results presented here demonstrate that all of the above-described proteins are CRC autoantigens target of autoantibodies, which can discriminate CRC patients from healthy individuals at early and advanced stages of the disease, including patients with premalignant lesions (low- and high-grade adenomas).
Finally, the main goal of this study was to identify and validate CRC TAAs for CRC diagnosis and integrate them into a POC device that is useful for clinical routine. The detection of multiple autoantibodies is needed for a more specific and sensitive diagnosis of CRC. The seroreactive luminescence and biosensing approaches demonstrated here could be successfully used to distinguish CRC patients and premalignant individuals from healthy controls. To the best of our knowledge, this is the first report investigating a specific autoantibody signature that comprises autoantibodies against TAAs from exosomes isolated from cell lines and/or directly from frozen patients’ tissue, and that has been integrated into electrochemical bio-platforms for autoantibody detection with the aim of enabling patient care.
Regarding the performance comparison of this signature, with the determination in blood of the circulating tumor DNA (ctDNA) markers (i.e., emerging markers) or CEA (an established clinical marker), it has been observed that although ctDNA markers and CEA can distinguish CRC with high AUCs, specificity, and sensitivity (especially at the late stages of the disease), they are not useful enough to detect premalignant or precancerous lesions, with AUCs and sensitivities lower than 60% and 50%, respectively [58,59]. These data reinforce the idea that apart from the simplicity of the final methodology, the continuous biological signal amplification function of the immune system gives autoantibody screening a unique advantage in the early diagnosis of tumors. In this sense, the TAA combination permitted the differentiation of CRC or premalignant individuals from healthy individuals with an AUC close to 80% in both cases. However, it should be emphasized that our aim is to integrate the TAAs identified here with previously identified CRC TAAs [11,13,14,60] in order to develop diagnostic platforms that can integrate all CRC-specific TAAs in order to attain a high diagnostic ability toward individuals with premalignant lesions and CRC patients. This would make it possible to detect CRC by means of a simple, noninvasive, fast, and cheap blood test.
Remarkably, although the sensitivity and specificity of ctDNA markers in the diagnosis of CRC patients have been demonstrated to be greater than the sensitivity and specificity obtained in this work by autoantibody detection, it should be emphasized that the procedures for the isolation, purification, and detection of these ctDNA are more complex, longer, and more expensive than Halotag-based electrochemical biosensing platforms. In addition, the amount of plasma sample required for the quantification of ctDNA is considerably larger (1.5 mL plasma per 10–15 ng of cfDNA) than that required for autoantibody detection (1–5 μL of plasma samples diluted 1:400 in the assays), due to the high specificity and affinity of the antigen–antibody interaction. It should also be mentioned that electrochemical bio-platforms have recently demonstrated preliminary potential—with a limited number of samples—to discriminate between the healthy and tumor tissues of patients with CRC, with sensitivities and specificities of 89% and 67%, respectively, by targeting 5-mC and 5-hmC at the global level without bisulfite treatment and polymerase chain reaction (PCR) amplification, but requiring genomic DNA extraction and denaturation [61]. Thus, the biosensing platforms used here could integrate markers with different characteristics to increase the sensitivity and specificity of the assay for the diagnosis of CRC at early and late stages.
《5. Conclusions》
5. Conclusions
In this work, we identified a CRC blood-based diagnostic signature based on the identification of non-previously investigated CRC sources (i.e., exosomes and the TME from CRC frozen tissue) via IP followed by LC-MS/MS analysis using IgGs isolated from the plasma of CRC patients. These candidate TAAs could be part of a multiplex biomarker panel for the blood-based diagnosis of CRC as integrated on the biosensor platforms described herein. The resulting platform would be ideal for CRC diagnosis, since it would permit simultaneous autoantibody detection using a minimal plasma sample volume. In conclusion, the novel and versatile electrochemical biosensing strategy presented here meets the requirements of clinical routine and POC testing, since it greatly reduces both assay time and production costs.
Although we reported the unbiased discovery of autoantibody biomarkers validated using individual plasma samples from CRC patients and colorectal premalignant subjects in comparison with healthy individuals, the diagnostic ability of these biomarkers should be further validated using a large number of samples and independent patient cohorts. Further research is sure to obtain a diagnostic panel by multiplexing the TAAs described here and previously validated CRC TAAs [14,41,42,44]. Such multiplexed bio(sensing) platforms—as demonstrated here by integrating 15 CRC TAAs—should achieve high enough sensitivity, specificity, and AUC for the blood-based clinical diagnosis of CRC, thereby demonstrating the potential to greatly increase patient survival and decrease the cost associated with CRC treatment by health systems.
《Acknowledgments》
Acknowledgments
This work was supported by the financial support of the PI17CIII/00045 and PI20CIII/00019 grants from the AES-ISCIII program to R.B. The financial support of the PID2019-103899RB-I00 (Ministerio de Ciencia e Innovación) Research Project and the TRANSNANOAVANSENS-CM Program from the Comunidad de Madrid (S2018/NMT-4349) to S.C. are gratefully acknowledged. G.D. acknowledges the financial support of PI15/00246 grant of the FIS and Cátedra UAM-Roche en Medicina de Innovación. The FPU predoctoral contract to A.M.-C. is supported by the Spanish Ministerio de Educación, Cultura y Deporte. G.S.-F. is recipient of a predoctoral contract (1193818 N) supported by The Flanders Research Foundation (FWO). M.A.-N. was supported by a contract of the Programa Operativo de Empleo Juvenily la Iniciativa de Empleo Juvenil (YEI) with the participation of the Consejería de Educación, Juventud y Deporte de la Comunidad de Madrid y del Fondo Social Europeo. The predoctoral contract from the Spanish Ministerio de Economía y Competitividad (BES-2016-076606, E.P.) and Talento-Contract from Comunidad de Madrid (2019-T2/IND-15965, R.M.T.-R.) are also gratefully acknowledged.
《Compliance with ethics guidelines》
Compliance with ethics guidelines
Ana Montero-Calle, Itziar Aranguren-Abeigon, María Garranzo-Asensio, Carmen Poves, María Jesús Fernández-Aceñer o, Javier Martínez-Useros, Rodrigo Sanz, Jana Dziaková, Javier Rodriguez-Cobos, Guillermo Solís-Fernández, Eloy Povedano, Maria Gamella, Rebeca Magnolia Torrente-Rodríguez, Miren Alonso-Navarro, Vivian de los Ríos, J. Ignacio Casal, Gemma Domínguez-Muñoz, Ana Guzmán-Aránguez, Alberto PeláezGarcía, José Manuel Pingarrón, Susana Campuzano, and Rodrigo Barderas declare that they have no conflict of interest or financial conflicts to disclose.
《Appendix A. Supplementary data》
Appendix A. Supplementary data
Supplementary data to this article can be found online at https://doi.org/10.1016/j.eng.2021.04.026.


 京公网安备 11010502051620号


