

《1. Introduction》
1. Introduction
The coronavirus disease 2019 (COVID-19) pandemic has caused major disruptions in nearly every aspect of life around the world. As of 29 September 2021, the number of confirmed cases is close to 232 million in over 220 countries and territories; furthermore, new cases have recently increased intensively to about 0.5 million per day [1]. The World Health Organization (WHO) has declared a global health emergency due to the outbreak of COVID-19. Very recently, authorities in the United Kingdom identified a new COVID-19 variant, and the initial analysis indicates that the variant may spread more readily between people than the original strain [2]. COVID-19 has become the biggest challenge to healthcare systems in many countries.
The use of face masks has become widely prevalent in response to the COVID-19 pandemic, as the virus can be transmitted via short-range aerosols and droplets, typically with a diameter of < 5 μm (fine) or > 5 μm (coarse) [3–11]. Certified face masks have thus become national essentials, causing a massive surge in demand that has led to a global shortage of supply and raw materials [12]. Meanwhile, most masks are designed for single-use, and the filtering layer uses polypropylene (PP), a thermoplastic that takes several decades to degrade in a landfill. Therefore, the massive production and disposal of single-use face masks not only pose a risk of secondary transmission that could jeopardize the effect of protection as pathogens accumulate on the masks, but are also leading to increasing concern about resources and the environment, since most mask components are made from petrochemicals [13–15].
To meet the critical and intensifying demand for masks, researchers and industry professionals have made great efforts to address the mask shortage and to enhance the protection afforded by existing masks [11,16–25]. These efforts include ① developing alternative materials with sufficient filtration efficiency [26–28]; ② developing and engineering multifunctional masks with hydrophobic, antimicrobial, and self-disinfecting properties [29– 31]; ③ optimizing the design of masks for better protection, breathability, and user comfort [32–35]; and ④ exploring new technologies for the efficient production and customization of masks, such as three-dimensional (3D) printing [36–41]. Even so, as newly reported cases of COVID-19 are increasing sharply to approximately 0.5 million per day [1], a huge demand for face masks and personal protective equipment (PPE) is expected for the winter in the northern hemisphere.
Increasing the reusability of the face masks that people already have on hand is a convenient, low-cost, and low-energy strategy that can partially address the shortage in face masks while simultaneously decreasing environmental concerns due to the massive consumption of single-use masks. Wang et al. [42] presented a method based on hot water decontamination followed by charge regeneration to recover masks’ particle filtration efficiency (PFE) and, therefore, to increase their reusability. Liao et al. [17] investigated several commonly used disinfection methods on N95 respirators and found that the PFE of N95 respirators remained almost unchanged after disinfection using heating at 85 °C and 30% relative humidity (RH) for 50 cycles, indicating the high reusability of the tested N95 respirators. Planar face masks, in general, have relatively weak structural stability and less fitness to the wearer (i.e., they do not fit tightly) in comparison with the characteristics of N95 masks [16]. However, since planar face masks are low-cost and have a PFE higher than 95%, they are massively consumed as single-use masks in many countries. This, then, raises the question of the reusability of planar face masks after disinfection. Here, using a new type of meltblown polypropylene (mb-PP) composites that integrate inorganic and organic electret, we fabricated highperformance planar face masks and investigated the effects of multiple commonly used disinfection methods and mask-wearing periods on the PFE and on the resistance of air pressure (RAP) of the masks. Although washable or biodegradable masks made with renewable biomass-based resources have been developed [16], the cost of such masks is high. Therefore, due to their low-cost and high-performance, mb-PP-based fabrics are still used.
《2. Experimental section》
2. Experimental section
《2.1. Materials and filtration fabric preparation》
2.1. Materials and filtration fabric preparation
Mb-PP pellets with a melt flow index (MFI) of 1500 g per 10 min were provided by Shandong Dawn Co., Ltd. (China). First, the mbPP pellets and additives, which included tourmaline, polytetrafluoroethylene (PTFE), zinc stearate, and antioxidants, were melt mixed using a co-rotation twin-screw extruder (Nanjing Rubber and Plastic Machinery Factory, China) with a screw diameter of 40 mm and a length to diameter (L/D) ratio of 52/1. The loading content of the electret masterbatch in the recipes for the preparation of meltblown fabrics was 2 wt%. The screw rate was set at 300 r∙min–1 . The barrel of the extruder had 12 temperature-control zones, and their temperatures were set at 160, 170, 220, 240, 250, 230, 210, 180, 170, 170, 160, and 160 °C (from hopper to die). Before mixing, the compositions were dried in a vacuum oven at 80 °C for 3 h and used immediately. The pelletized composites were dried and then used for the fabrication of the meltblown filtration fabrics using a laboratory-scale meltblowing setup.
The above-produced pellets were melted and pressurized using a single-screw extruder (Tianjin Shengruiyuan Machinery Co., Ltd., China), in which three independently controlled heaters melted the PP composites and maintained the desired temperatures. The temperatures were set at 150, 180, 180, 180, 200, and 250 °C (from hopper to die), and the screw rate was 15 r∙min–1 . Once the melted PP composites exited the extruder, they entered a melt pump that metered and delivered the polymer to the die assembly. The 40 cm long die had one row and 400 hole capillaries, each with a diameter of 350 μm. The fibers were collected as meltblown fabrics on a rotating drum collector. Meltblown fabrics from the collector were charged using a 60 kV voltage at a fabric speed of 6 m∙min–1 , and then wound onto rolls. Fig. 1 provides an illustration of the fabrication of meltblown fabrics.
《Fig. 1》
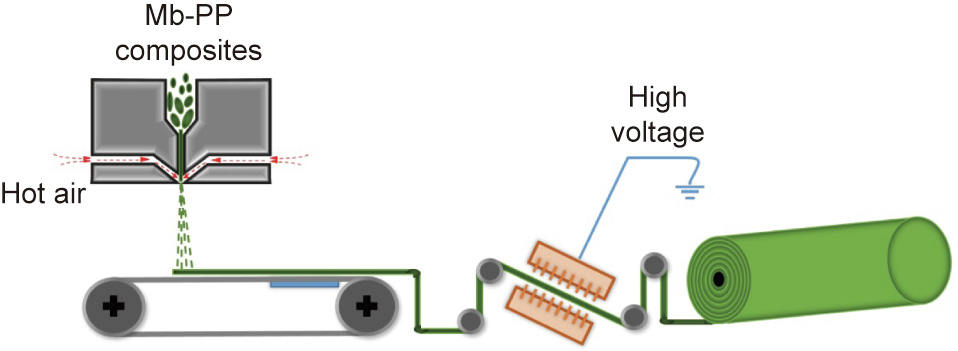
Fig. 1. Schematic illustration of the fabrication of meltblown fabrics.
The above-produced meltblown fabrics were then used to fabricate reusable face masks by means of a fully automatic face mask production line. The non-woven cloth and meltblown fabrics were driven by rollers and were folded and wrapped automatically, with fixed-length nose wires aligned in the non-woven cloth along the traction direction. The four sides of the overlapped non-woven cloth and meltblown fabrics were welded using an ultrasonic spot-welding machine and then cut into mask pieces. Each mask piece was then transported to the other assembly line, where the ear straps were assembled using ultrasonic spot welding.
《2.2. Scanning electron microscopy measurements》
2.2. Scanning electron microscopy measurements
Scanning electron microscopy (SEM) images were acquired on a field emission (FE)-SEM JSM-7800F, JEOL (Japan).
《2.3. Pore size and distribution measurements》
2.3. Pore size and distribution measurements
The pore sizes and distribution of the above-produced fabrics were measured using a mercury porosimeter, following the Washburn equation (AutoPore IV 9520, Micromeritics, USA). Pressure ranging from 1.38 kPa to 206.8 MPa was applied, and each fabric was equilibrated for 20 s at each pressure.
《2.4. Filtration performance measurements》
2.4. Filtration performance measurements
The PFE and RAP of the meltblown fabrics and masks were measured using an automated 8310A filter tester (TSI Inc., USA) at an air flow rate of (30 ± 2) L∙min–1 , following the Chinese group standard (T/BJFX 0001–2020) [43]. NaCl aerosols with a mass median particle size of 0.3 μm were used as the test particles. The reported PFE and RAP results are an average of at least five samples; furthermore, for each sample, three randomly chosen positions were tested. All data are presented as the mean ± standard deviation (SD). An independent sample t-test analysis was used to compare the PFE and RAP of the meltblown fabrics with and without charging. One-way analysis of variance (ANOVA) and Fisher’s least significant difference (LSD) test were used to determine whether significant differences existed between the different treatment groups. Statistical analyses were performed using SPSS 24.0 (SPSS Inc., USA). A p value of less than 0.05 was considered to be statistically significant.
《2.5. Microbiological testing》
2.5. Microbiological testing
The microbiological testing of the masks after disinfection was performed in a Class 100 clean room, following the procedures (GB 15979–2002). Ten grams mask samples were cut into small square pieces with an area of 0.5 cm2 , put into 200 mL sterile normal saline, and mixed manually. After the mask samples precipitated, the supernatant was taken out and added into petri dishes (1 mL each). Next, 15–20 mL of nutrient agar medium (for bacteria) and 15–25 mL of Sabouraud dextrose agar medium (for fungi), both at 45 °C, were respectively mixed with the supernatant. After the agar solidified, the petri dishes were turned over and cultured at (35 ± 2) °C for 48 h (for bacteria) and at (25 ± 2) °C for 7 d (for fungi). The bacterial and fungal colonies in the petri dishes were then calculated, and coliform and pyogenic bacteria were detected. Each result represents an average of at least five mask samples; in addition, ten cultures were performed for the results of each mask: five for fungi and five for bacteria.
《2.6. Schlieren photography measurements》
2.6. Schlieren photography measurements
A schlieren system is a nonintrusive experimental setup that indicates the variation in the index of refraction of light, thereby effectively depicting the density gradient variation in a fluid. A continuous light xenon lamp was used as the light source. The light beam was focused by a 25.4 mm-radius semispherical lens with a focal distance of 120 mm, and a horizontal slit was placed at its focal point, regulating the amount of light available for the flow visualization. The light beam was then reflected by a parabolic mirror with a diameter of 350 mm, which directed the light through the test section and reflected it onto a second parabolic mirror of the same size. The focal length of the parabolic mirrors was 3500 mm. A horizontal knife edge was placed at the focal point of the second parabolic mirror. The image was focused directly onto the mirror of a V1612 camera (Phantom, USA), which can acquire up to 1 000 000 frames per second. An experimental setup for schlieren photography is provided in Fig. 2, and more detailed information regarding the schlieren technique can be found in Ref. [44]. The schlieren measurements were performed at an RH of 60% at 23 °C, and the reported values are an average of at least five mask samples.
《Fig. 2》

Fig. 2. Experimental setup for schlieren photography.
《2.7. Disinfection methods》
2.7. Disinfection methods
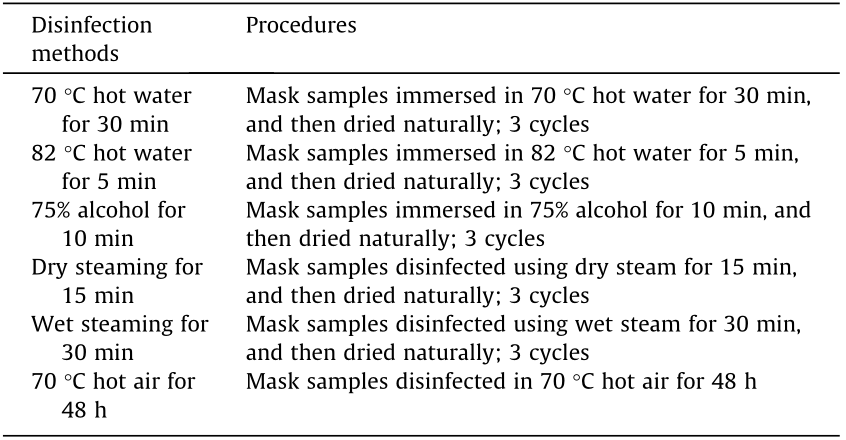
Heat, steam, and alcohol treatments for disinfection were performed following the procedures given in the literature [17]:
(1) Hot water treatment. Mask samples were immersed in hot water for different lengths of time, during which the water was kept at specific temperatures by continuously adding freshly boiled water. After a certain period of time, the mask samples were taken out and left to air dry (by hanging). Then, the mask samples were immersed in hot water again for the next cycle.
(2) Alcohol treatment. Mask samples were immersed in a 75% ethanol solution for 10 min. Then, the masks were taken out and left to air dry (by hanging). They were subsequently immersed into the alcohol solution again for the next cycle.
(3) Dry steam treatment. One mask sample was put into a plastic container and sealed. The container was placed on top of a beaker with boiling water inside (at around 15 cm above the water) and steamed for 15 min. The container was then removed; afterward, the samples were either placed back into the container for the next treatment cycle or tested.
(4) Wet steam treatment. Two mask samples were stacked in an unsealed plastic container. The container was placed on top of a beaker with boiling water inside (at ~15 cm above the water). The samples were steamed for 30 min, and then left to air dry completely. The as-treated samples were either placed back on top of the beaker for the next treatment cycle or tested.
(5) Heat treatment. Heat treatment was carried out in an oven at 70 °C for 48 h.
A summary of the disinfection methods used is provided in Table 1.
《Table 1》
Table 1 Summary of the disinfection methods.
《3. Results and discussion》
3. Results and discussion
Previous work has shown that the average fiber diameter is one of the key factors in the filtration performance of meltblown fabrics [45–47]. Fig. 3 shows the SEM morphologies of the produced PP fibers at different hot air pressures and the distribution of the fiber diameter. No ‘‘shots” are observed in the produced fibers. The fibers stack randomly, forming a complicated randomly oriented 3D network. The average diameters of the fibers are estimated to range from 5.5 to 10.4 μm with hot air flow rate decreases from 1.8 to 0.9 m3 ∙min–1 . A higher air flow rate results in a smaller fiber diameter and a narrower distribution, while a lower air flow rate yields a larger fiber diameter and a wider distribution. This dependence occurs because the drag force is higher with a higher air flow rate, so the air attenuates the polymer filaments better than with a lower air flow rate [26].
《Fig. 3》
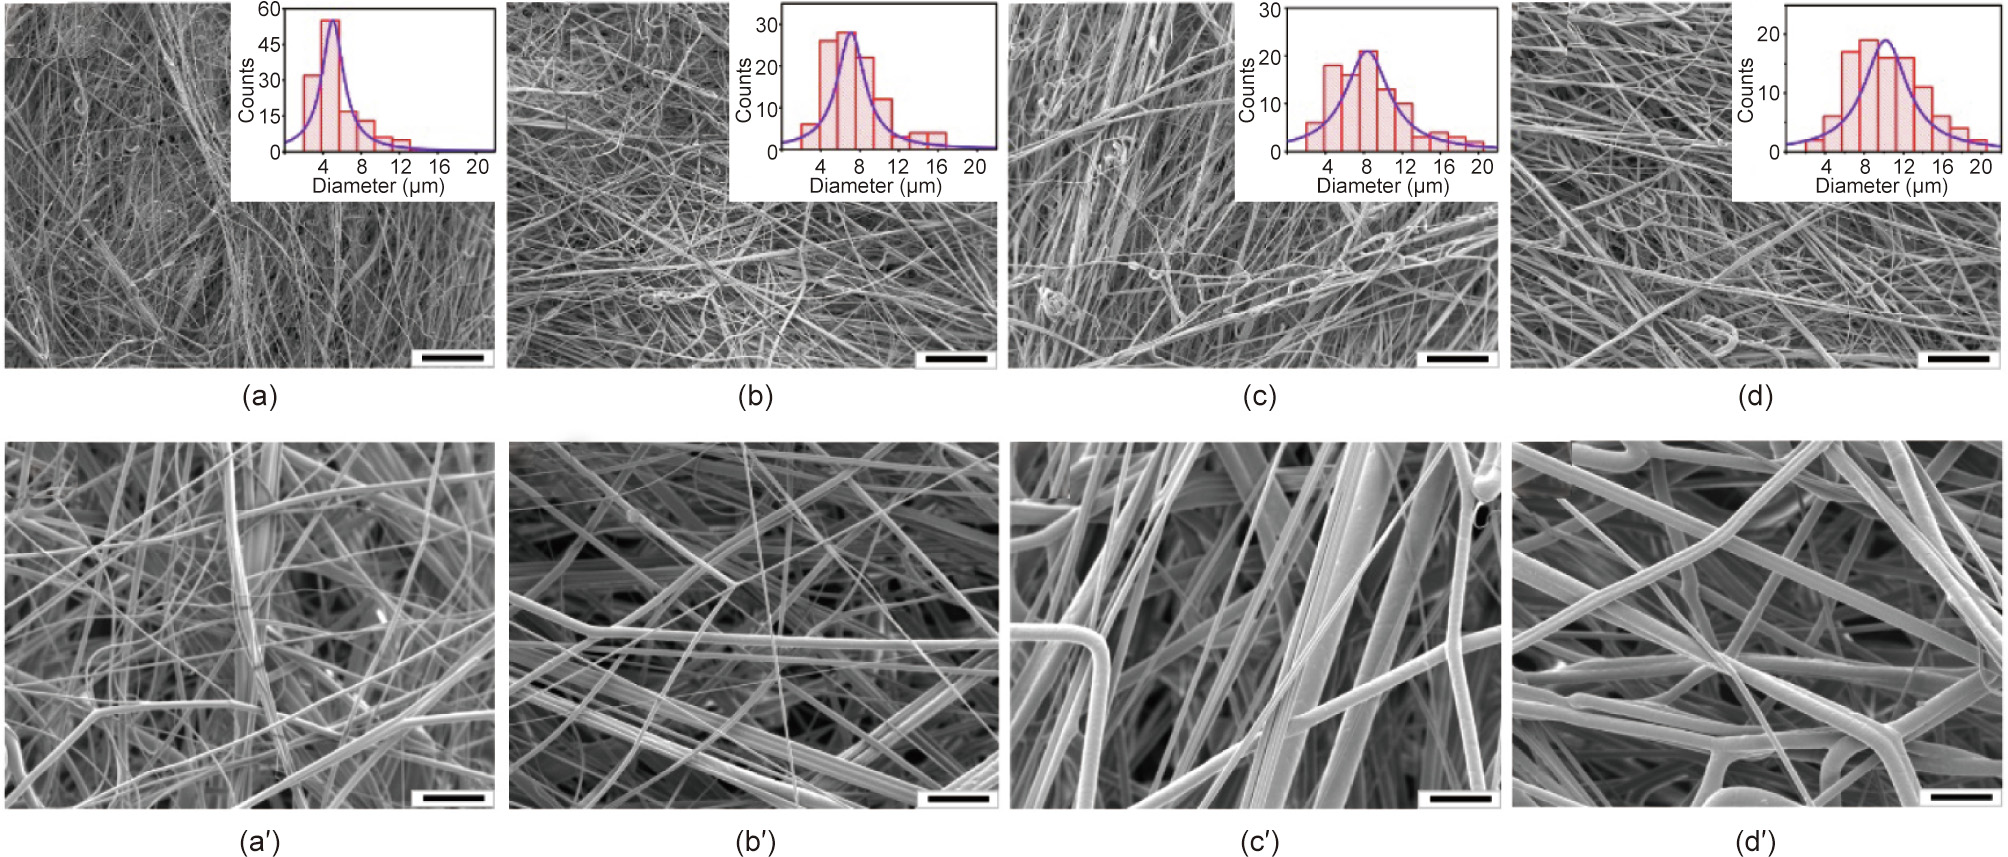
Fig. 3. SEM images of the produced PP microfibers at different hot air flow rates. (a) 1.8 m3 ∙min-1 ; (b) 1.5 m3 ∙min-1 ; (c) 1.2 m3 ∙min-1 ; (d) 0.9 m3 ∙min-1 . (a' –d' ) are corresponding enlarged images of (a–d). The insets in (a–d) are histograms of the fiber diameter. The scale bars in (a–d) and (a' –d' ) are 200 and 30 lm, respectively.
The properties of the as-produced meltblown fabrics are summarized in Table 2. As shown, the smaller the average fiber diameter is, the higher the PFE and RAP are, and the smaller the mean pore diameter is. However, the fiber diameter shows no relationship with the porosity. Since the thinner fibers stack more densely, an increased PFE and RAP would be expected for meltblown fabrics with thinner fibers. The as-produced fibers with a narrow distribution and average diameter of 5.5 μm were used to make fabrics with different grammages. As seen in Table 2, the PFE and RAP increase as the grammage increases.
《Table 2》
Table 2 Properties of the as-produced meltblown fabrics.
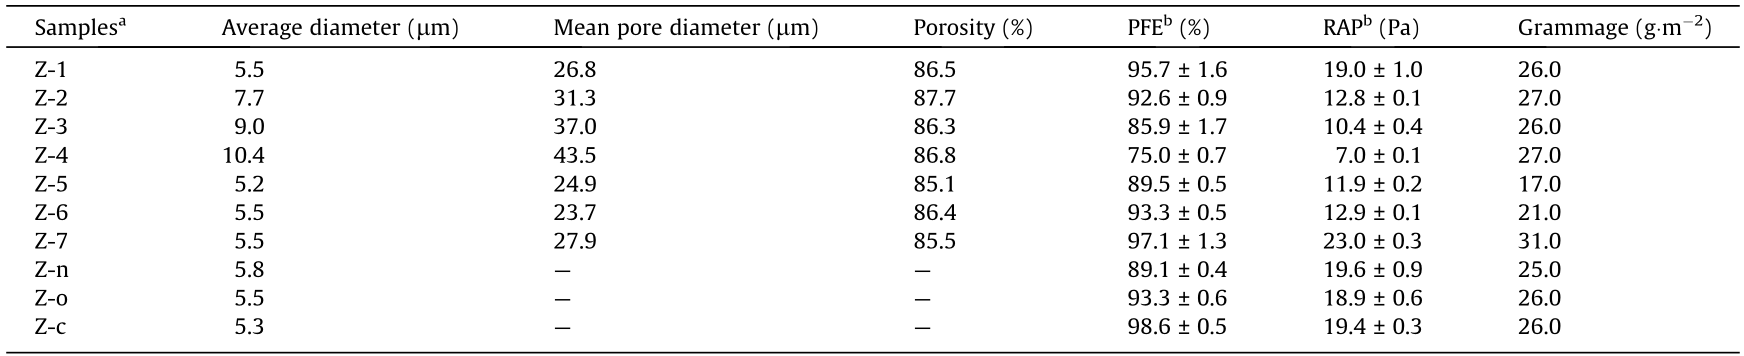
a The loading content of the electret masterbatch in the above samples was 2.0 wt%. All the electret masterbatches contained 75.0 wt% mb-PP and 10.0 wt% other ingredients, such as zinc stearate, antioxidants, etc. For the samples from Z-1 to Z-7, the electret masterbatch contained 15.0 wt% tourmaline. No electret masterbatch was loaded for Z-n. For the Z-o sample, the electret masterbatch contained 15.0 wt% PTFE powder with sizes of 0.2–0.4 μm. For the Z-c sample, the electret masterbatch contained a mixture of tourmaline and PTFE with 15.0 wt% loading.
b PFE and RAP were measured at an air flow rate of 30.0 L∙min-1 .
The electret appears to have little effect on the morphologies of the produced PP fibers (Fig. S1 in Appendix A and Fig. 3). However, it does affect the PFE of the produced fabrics (Table 2). For the Z-n sample without electret, the PFE is 89.1%, which is lower than that of Z-1, which has almost the same grammage but includes tourmaline electret. The Z-o sample with PTFE electret exhibits a similar PFE as the samples with tourmaline, when the average fiber diameter and grammage are similar. It is interesting that, when using an electret composite of PTFE and tourmaline, the Z-c sample shows the highest PFE; this finding could be attributed to the synergistic interactions between the PTFE and tourmaline, which increase the stability of the static charge on the fabrics. However, the electret has little effect on the RAP of the fabrics; as shown in Table 2, any effect is negligible.
The electret charging significantly increases the PFE of the meltblown fabrics. As shown in Fig. 4(a), for all four fabrics made with different fiber diameters, without electret charging, the PFE is 36.0% for fabrics made with a 10.4 μm-diameter fiber and 47.7% for fabrics made with a 5.5 μm-diameter fiber. After charging, the PFE increases to 75.0% (p < 0.001) and approximately 95.7% (p < 0.001), respectively, which is two times greater than the original PFE. Without electret charging, the PFE of the meltblown fabrics is low, since fine particles are able to pass through the fabrics to reach the user; however, with charging, these particles are electrostatically captured, and the PFE is greatly increased. The electret charging exhibits negligible effects on the RAP of the fabrics made with fibers with diameters of 5.5 μm (p = 0.59) and 7.7 μm (p = 0.30); however, electret charging slightly yet significantly decreases the RAP of the fabrics made with fibers with diameters of 9.0 μm (p < 0.05) and 10.4 μm (p < 0.05), respectively (Fig. 4(b)).
《Fig. 4》

Fig. 4. (a) PFE and (b) RAP of the as-produced meltblown fabrics before and after charging. The PFE and RAP were measured at an air flow rate of 30.0 L∙min-1 . *: p < 0.05; **: p < 0.001.
The as-produced fabrics with Z-1 fibers, which have an average diameter of 5.5 μm and contain tourmaline, were used to fabricate the planar face masks. To assess the performance of the masks after disinfection, several common and potentially scalable, userfriendly, and nondestructive disinfection methods were used: ① hot water (denaturation inactivates the virus with temperatures ≥ 70 °C for 5 min) [17,48]; ② 75% alcohol (denaturing of the virus); ③ steam (100 °C heat-based denaturing); and ④ hot air (heat-based denaturing) [17]. Details of various disinfection methods are shown in Table 1.
The initial PFE and RAP of the as-produced masks were 96.2% and 39.8 Pa, respectively (Figs. 5(a) and (b)). After three cycles of disinfection using hot water at 70 °C for 30 min, the PFE showed almost no degradation (96.2% ± 0.8% vs 94.9% ± 3.1%, p = 0.96), while the RAP decreased to 35.5 Pa ((39.8 ± 2.5) Pa vs (35.5 ± 1.1) Pa, p < 0.001). Disinfection using hot water at a higher temperature (82 °C) for a shorter period of time (5 min) did not change the PFE, but decreased the RAP to 35.7 Pa (Fig. S2 in Appendix A). An obvious decrease in PFE occurred for disinfection using 75% alcohol for 10 min (96.2% ± 0.8% vs 76.8% ± 1.6%, p < 0.001). This sharp decrease in PFE can be attributed to the decreased static charge on the fabrics, since small ethanol molecules or other solvent molecules can adsorb onto the fibers and either screen or possibly lift the frozen charges of the electret, which would decrease the PFE [17]. It has been shown that alcohol treatment can disrupt the structural integrity of the filtering layer of masks [49], as shown in Fig. 6. This may also lead to a decrease in PFE. In the case of disinfection using steam, it was interesting to find that the dry steam treatment had a more obvious effect on the decrease of both PFE (96.2% ± 0.8% vs 83.5% ± 1.5%, p < 0.001) and RAP ((39.8 ± 2.5) Pa vs (33.6 ± 1.0) Pa, p < 0.001) than the wet steam treatment (96. 2% ± 0.8% vs 92.5% ± 0.9%, p < 0.05; (39.8 ± 2.5) Pa vs (37.8 ± 0.3) Pa, p = 0.21). For the dry steam treatments, the masks were placed in a sealed plastic container. With an increase in treatment time, the temperature in the container increased, which might have induced a greater loss of the static charges on the fabrics, in comparison with that under wet steam treatment. For hot air treatment at 70 °C, the PFE showed almost no degradation (96.2% ± 0.8% vs 93.7% ± 0.5%, p = 0.23), but the RAP slightly decreased to 36.8 Pa (p < 0.05).
《Fig. 5》
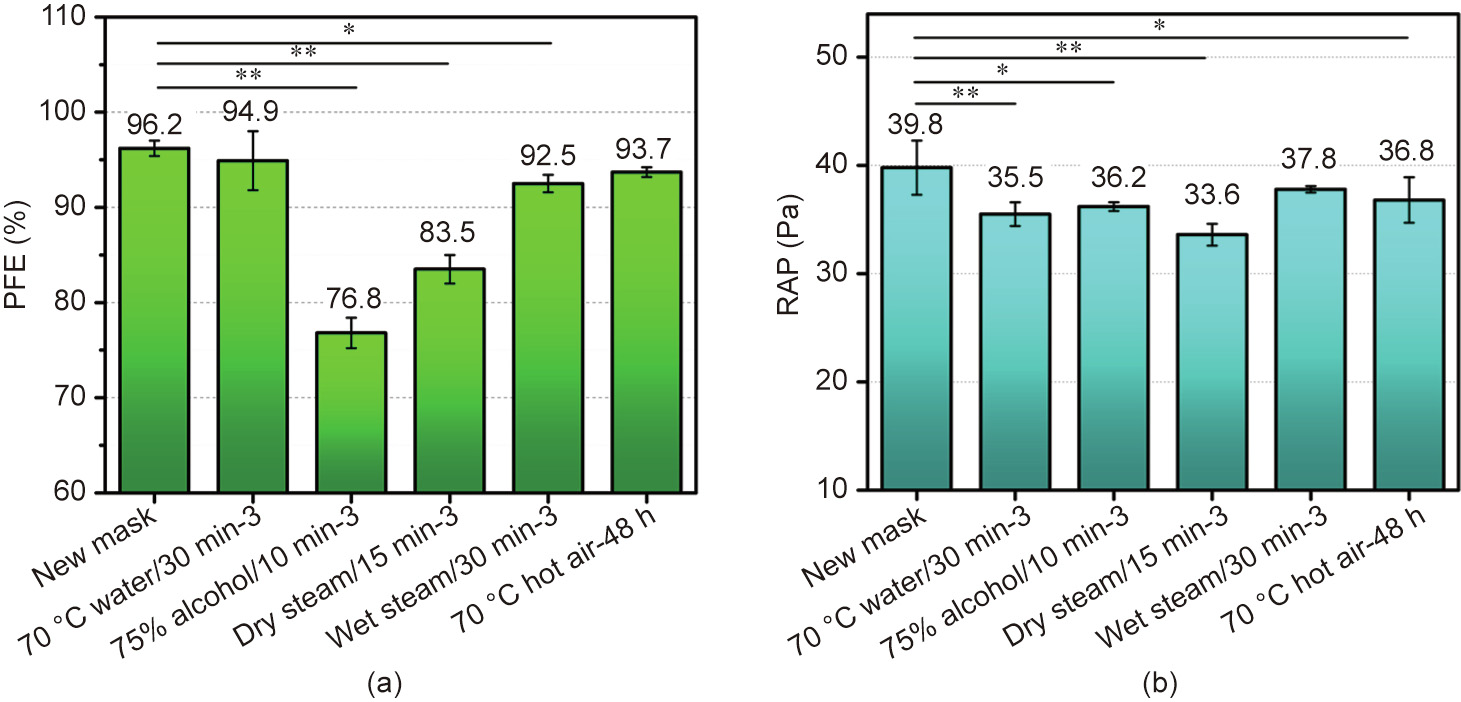
Fig. 5. (a) PFE and (b) RAP of the as-produced masks after different disinfection treatments. ‘‘-3” indicates the number of cycles of disinfection. PFE and RAP were measured at an air flow rate of 30 L∙min-1 . *: p < 0.05; **: p < 0.001.
The effect of disinfection by means of hot water, steam, or hot air on the morphology of the meltblown fabrics appeared to be less than the effect after treatment by means of 75% alcohol disinfection, as shown under SEM in Fig. 6 and Fig. S3 in Appendix A. These findings were consistent with the RAP results shown in Fig. 5.
《Fig. 6》
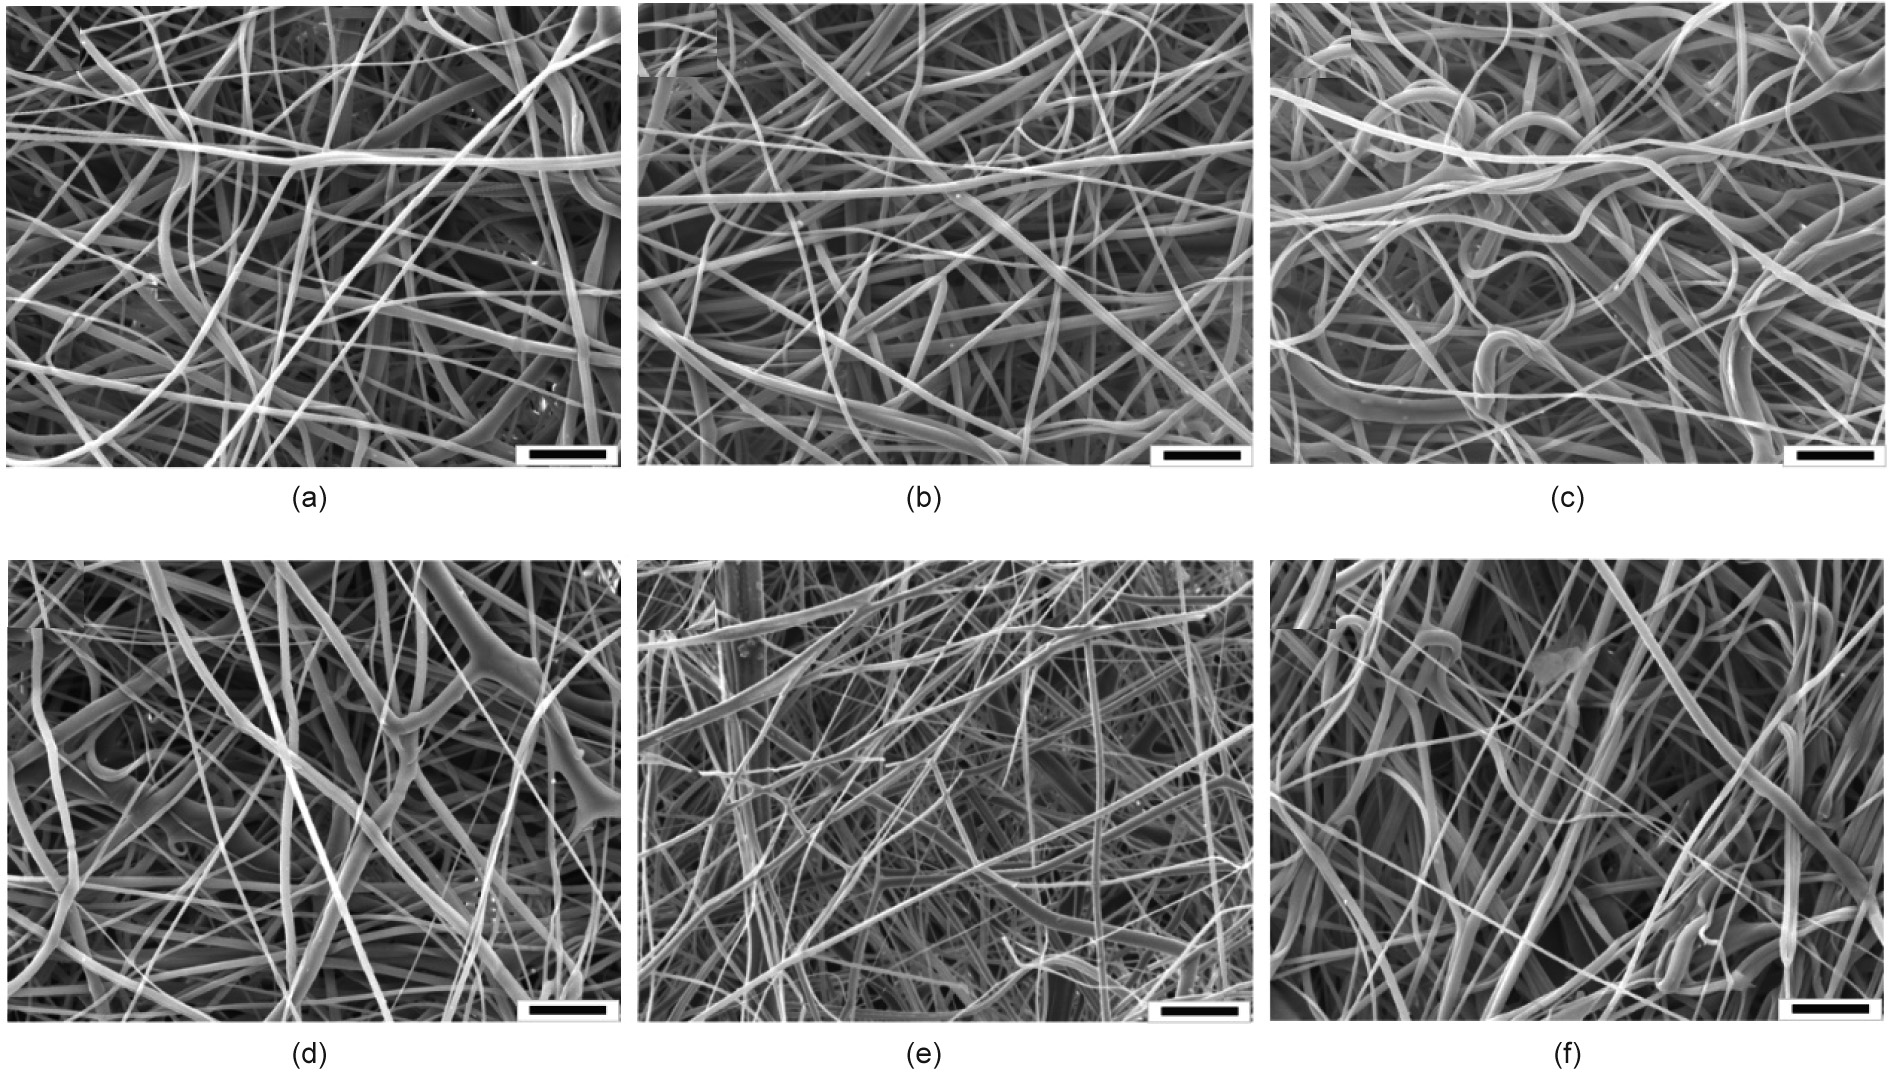
Fig. 6. SEM images of the meltblown fabrics (a) before and (b–f) after different disinfection treatments. (b) 70 °C hot water for 30 min, 3 cycles; (c) 75% alcohol for 10 min, 3 cycles; (d) dry steaming for 15 min, 3 cycles; (e) wet steaming for 30 min, 3 cycles; (f) 70 °C hot air for 48 h. The scale bars are 30 μm.
Fig. 5 clearly shows that the ethanol and dry steam disinfection methods drastically degraded the PFE to unacceptable levels (PFE < 90%). The RAP also decreased slightly but to a statistically significant degree. Hence, the resultant decrease in PFE could also be related to the decrease in RAP. Furthermore, it is evident that hot water disinfection is the most appropriate, as it best retains the PFE and 3D network of the meltblown fabrics, in comparison with the other treatment methods. These results are in agreement with the work of Liao et al. [17].
In order to investigate the effect of the wearing period on the degradation of the mask’s properties, over 40 volunteers were organized to perform a mask-wearing test. Fig. 7 shows the PFE and RAP of the masks after being worn for different periods of time, followed by disinfection. The initial PFE of a new mask was 96.2%; after 12 h of wear and three cycles of disinfection using hot water at 70 °C for 30 min, the PFE decreased to 88.7% (p < 0.05). After 16 h of wear and four cycles of disinfection using hot water at 70 °C for 30 min, the PFE decreased from the initial value of 96.2% to 82.0% (p < 0.001). After 20 h of wear and an increase to five disinfection cycles, the PFE decreased to 79.3% (p < 0.001). After 24 h of wear and six cycles of disinfection using hot water at 70 °C for 30 min, the PFE decreased further to 76.2% (p < 0.001)—a degradation of about 20%. For the RAP, the initial value of the new mask was 39.8 Pa; after 12 h of wear and three cycles of disinfection using hot water at 70 °C for 30 min, the RAP decreased to 30.7 Pa (p < 0.001). Further increases in the wearing period and number of disinfection cycles only decreased the RAP slightly. Thus, the results show that the PFE decreases significantly with an increase in the mask-wearing time period and the number of cycles of disinfection. However, for the RAP, after an initial drop due to 12 h of mask wearing and three cycles of hot water disinfection at 70 °C for 30 min, the RAP then remained at similar levels after a further increase in the wearing period and in the number of cycles of disinfection.
《Fig. 7》

Fig. 7. (a) PFE and (b) RAP of the face masks for wearing periods and number of cycles of disinfection treatment. The PFE and RAP were measured at an air flow rate of 30 L∙min-1 . *: p < 0.05; **: p < 0.001.
The decrease in the PFE and RAP of the masks for various wearing periods and number of cycles of disinfection can be correlated with the morphology changes in the meltblown fabrics. Fig. 8 shows the morphologies for different wearing periods and numbers of disinfection cycles. After 12 h of wear and subsequent disinfection using hot water at 70 °C for 30 min and three cycles, the stacking density of the microfibers seems to increase, while the surface becomes less smooth, and some curled thinner fibers appear (Fig. 8(b)). As the wearing period is increased to 16 h and the disinfection is four cycles, the stacking density and the number of curled fibers increase further (Fig. 8(c)). As confirmed in Fig. S3, hot water treatment at up to 82 °C did not change the morphology of the fabrics or deform the fibers. Therefore, the increased stacking density and curled fibers can be attributed to the wearing, which applies a tension force that increases the stacking density and physically damages some of the fibers. With an increase in the wearing period, wearing may also cause the distribution of the fibers to become poor (Fig. 8(c)), thereby decreasing the PFE, as shown in Fig. 7. As the wearing period is further increased to 24 h and the disinfection is six cycles, it is clear that the distribution of the fibers in the fabrics becomes very poor (Fig. 8(d)). Some dense and loose stacked areas appear, causing the PFE of the masks to decrease further. It is important to note that, as shown in Fig. 8, with an increase in the wearing period, some contamination of the fabric appears, due to sweat and/or oral droplets (i.e., dirt, salts, or other particles), which may impact the electrostatic ability of the fibers and therefore decrease the PFE.
《Fig. 8》

Fig. 8. SEM images of the meltblown fabrics for different wearing periods and numbers of disinfection treatment cycles. (a) No wear and no disinfection treatments; (b) worn for 12 h and subsequently disinfected using hot water at 70 °C for 30 min, 3 cycles; (c) worn for 16 h and subsequently disinfected using hot water at 70 °C for 30 min, 4 cycles; (d) worn for 24 h and subsequently disinfected using hot water at 70 °C for 30 min, 6 cycles. The scale bars are 30 μm.
Finally, schlieren photography was used to assess the travel distance of breathed air through the masks under normal breathing conditions.↑ Fig. 9 shows the schlieren images of the air outflow of one healthy volunteer with undisinfected and disinfected face masks. For masks with a PFE of 75.0% and an RAP of 7.0 Pa (Fig. 9 (a) and Video S1 in Appendix A), the air outflow coming out through the mask is large, and only a bit comes out from the upper part (nose bridge) and lower part of the mask. The travel distance of the breathed air can be seen over the range of camera capture, and is shown to be longer than 35 cm. Here, it should be noted that, since the exact quantification of the travel distance of breathed air is difficult, the obtained values are an estimation of the breathed air that can be observed visually (see red dashed line in Fig. 9). For the masks with a PFE and RAP of 93.0% and 12.8 Pa, respectively (Fig. 9(b) and Video S2 in Appendix A), the air outflow coming out through the mask decreases and the outflow coming out from the upper and lower parts of the mask increases. The travel distance of the breathed air is about 25 cm. However, for the masks with a similar PFE (98.3%) but a higher RAP (42.5 Pa) (Fig. 9(c) and Video S3 in Appendix A), the schlieren image clearly shows that the air outflow coming out through the mask is significantly decreased, and most of the breathed air comes out from the upper and lower parts of the mask. The travel distance of the breathed air is also shortened to about 17 cm. Thus, the schlieren results show that the travel distance of the breathed air is mainly dictated by the RAP, as would be expected.
↑ Due to the capability of the schlieren photography testing system, the assessment of travelling distance of droplet/aerosols in the breathed air outflow are now provided.
Due to limitations in the size of attached files, the videos are compressed, leading to image distortion and loss in resolution. Raw data are available from the corresponding authors upon request.
After disinfection using hot water at 70 °C for 30 min and three cycles, the PFE and RAP of the masks decreased to 94.9% and 35.5 Pa, respectively. The schlieren images in Fig. 9(d) and Video S4 (Appendix A) show that the air outflow coming out through the mask is also very limited, and most of the breathed air comes out from the upper and lower parts of the mask. The travel distance of the breathed air is within 18 cm. After disinfection using 75% alcohol for 10 min and three cycles, the PFE of the masks is significantly decreased to 76.8%, while the RAP is almost unchanged (36.2 Pa). The air outflow coming out through the mask and the travel distance of the breathed air (Fig. 9(e) and Video S5 in Appendix A) are similar to those of the mask after disinfection using hot water. The results show that, although 75% alcohol is an effective disinfection method with a significantly decrease in the PFE of the masks, the travel distance of the breathed air is almost unaffected by the alcohol disinfection.
After 12 h of wear followed by three cycles of disinfection using hot water at 70 °C for 30 min, the PFE and RAP of the masks decreased to 88.7% and 30.7 Pa, respectively. As shown in Fig. 9 (f) and Video S6 (Appendix A), even after 12 h of wear and hot water disinfection, the air outflow coming out through the mask is still very limited, and most of the breathed air comes out from the upper and lower parts of the mask. The travel distance of the breathed air in the horizontal direction is within 19 cm. After 24 h of wear followed by disinfection using hot water at 70 °C for 30 min and six cycles, the PFE and RAP of the masks decreased to 76.2% and 29.4 Pa, respectively. With such masks, the air outflow coming out through the mask increases, but most of the breathed air still comes out from the upper and lower parts of the mask (Fig. 9(g) and Video S7 in Appendix A). The travel distance of the breathed air also increases to a value of approximately 20 cm. These results show that, even after a long period of wear and several cycles of disinfection using hot water, the masks continued to exhibit a high performance in suppressing the spread of breathed air, indicating that the as-produced face masks are high performance and reusable.
《Fig. 9》

Fig. 9. Schlieren images of the air outflow with undisinfected and disinfected face masks. The dark region at the right of the image is the volunteer’s head. (a) Mask with a PFE of 75.0% and an RAP of 7.0 Pa; (b) mask with a PFE of 93.0% and an RAP of 12.8 Pa; (c) mask with a PFE of 98.3% and an RAP of 42.5 Pa; (d) mask disinfected using hot water at 70 °C for 30 min and 3 cycles, with a PFE of 94.9% and an RAP of 35.5 Pa; (e) mask disinfected using 75% alcohol for 10 min and 3 cycles, with a PFE of 76.8% and an RAP of 36.2 Pa; (f) mask after 12 h of wear followed by 3 cycles of disinfection using hot water at 70 °C for 30 min, with a PFE of 88.7% and an RAP of 30.7 Pa; (g) mask after 24 h of wear followed by 6 cycles of disinfection using hot water at 70 °C for 30 min, with a PFE of 76.2% and an RAP of 29.4 Pa. The scale bars for the mirror are 4 cm. (h) Travel distance of breathed air as a function of RAP.
The relationship between the travel distance of the breathed air and the RAP of the masks is summarized in Fig. 9(h). The results show that the smaller the RAP of the masks, the greater the travel distance of the breathed air. The travel distance is about 15 cm for masks with an RAP of 40 Pa, while it increases to more than 30 cm for masks with an RAP of 10 Pa—a travel distance two times greater. Therefore, in order to prevent the community transmission of respiratory infectious diseases, it is highly recommended to maintain a greater social distance when wearing a mask with a small RAP.
It should be noted that it is difficult to determine the exact travel distance of breathed air, since it highly depends on the individuals volunteering, the environmental conditions, and so forth. The travel distances of the breathed air that are estimated above are very rough values, and particular care needs to be taken in the interpretation of these results.
As shown in Table 2, the results show that the meltblown fabrics with Z-c fibers, which contain an electret composite of PTFE and tourmaline, exhibit the best PFE of 98.6%. Mask wearing and subsequent disinfection using hot water were also performed on these masks to assess their reusability. Fig. 10(a) shows that, after 24 h of wear and three cycles of disinfection using hot water at 70 °C for 30 min, the PFE decreased from the initial value of 98.6% to 91.3%, a PFE degradation of only approximately 7.3% (98.6% ± 0.5% vs 91.3% ± 3.6%, p < 0.001). For the masks fabricated with Z-1 fibers, which contain only tourmaline, after 12 h of wear and the same procedure of disinfection, the PFE decreased from 96.2% to 88.7% (p < 0.05), a PFE degradation of approximately 7.5%. The results show that, under the same disinfection procedures, the masks fabricated with fibers containing an electret composite can bear a longer mask-wearing period than the masks fabricated with fibers containing only tourmaline, indicating that masks with an electret composite exhibit better reusability.
《Fig. 10》
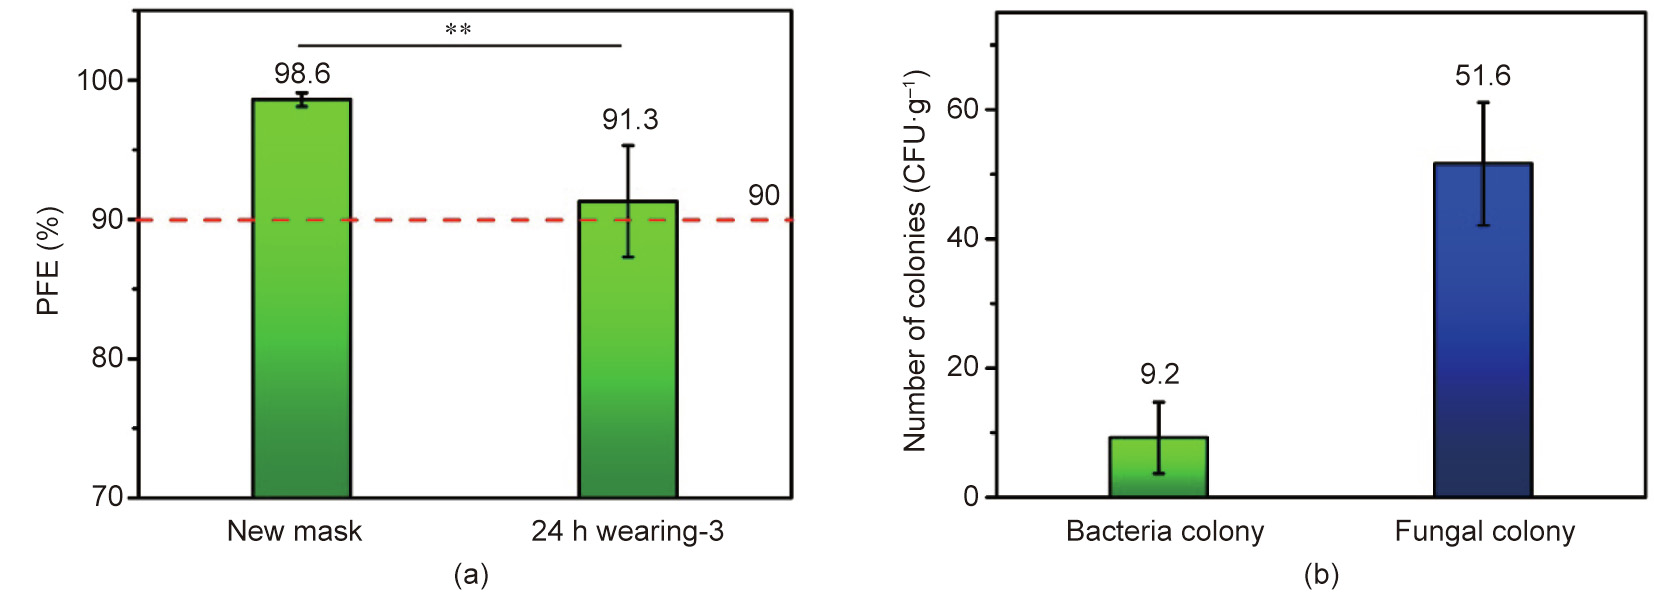
Fig. 10. (a) PFE and (b) microbial indicators of new and disinfected masks. (a) PFE of the masks before and after 24 h of wear followed by 3 cycles of disinfection using hot water at 70 °C for 30 min. The PFE was measured at an air flow rate of 30 L∙min-1 . (b) Microbial indicators of the disinfected masks (CFU: colony-forming unit). *: p < 0.05; **: p < 0.001.
The microbial indicators of the masks after disinfection are also important characteristics of a reusable face mask. For all ten examined mask samples (after 24 h of wear followed by three cycles of disinfection using hot water at 70 °C for 30 min), the average number of bacterial and fungal colonies was 9.2 and 51.6 colonyforming units per gram (CFU∙g-1 ) (Fig. 10(b) and Table S1 in Appendix A), respectively, while coliform and three kinds of pyogenic bacteria (Pseudomonas aeruginosa, Staphylococcus aureus, and Streptococcus hemolyticus) were not detected.
A Chinese group standard (T/BJFX 0001–2020) for Reusable civil masks was established on 7 April 2020 and implemented on 13 April 2020 [43]. Under this standard, the PFE of a reusable mask after disinfection should be ≥ 90%, and the total number of fungal colonies and bacterial colonies should be ≤ 100 and ≤ 200 CFU∙g-1 , respectively. Coliforms and pathogenic pyogenic bacteria should not be detected. In the present work, for the masks fabricated with fibers containing an electret composite, after 24 h of wear followed by three cycles of disinfection using hot water at 70 °C for 30 min, a PFE of 91.3% was retained, and the number of fungal colonies and bacterial colonies was in the range of 0–20 and 20–64 CFU∙g-1 , respectively. Furthermore, coliforms and three kinds of pathogenic pyogenic bacteria were not detected. These results fully meet the group standard (T/BJFX 0001–2020). Moreover, considering the masks’ performance in suppressing the spread of breathed air, it can be concluded that the developed reusable planar face masks exhibit a high performance.
《4. Conclusions》
4. Conclusions
In summary, high-performance, PP-based planar face masks were fabricated, and the effects of disinfection methods and wearing period on the properties of the masks were investigated. The results showed that, even after 24 h of mask wearing followed by three disinfection cycles using hot water at 70 °C for 30 min, the PFE and microbial indicators remained well above the standard for a reusable civil mask. Furthermore, the spreading of breathed air was still efficiently suppressed by the masks. Therefore, the as-produced face masks are high performance and reusable and, if used efficiently, would partially address the shortage in face masks while simultaneously decreasing the consumption of single-use masks. Among the six disinfection methods we investigated in terms of efficiency, scalability, and user friendliness, hot water treatment at 70 °C for 30 min exhibited the best results in preserving the filtration characteristics of the pristine planar face mask. However, we still stress that the use of the as-produced reusable planar face mask is not recommended for use as disposable surgical masks, especially among high-risk groups, such as persons with upper respiratory symptoms, or in high-risk areas, such as when attending a medical facility or institution. This is particularly the case during the COVID-19 pandemic or during other droplet- or aerosol-transmitted infection or disease outbreaks.
《Acknowledgments》
Acknowledgments
This work was supported by National Key Research and Development Program of China (2020YFC0844800) and the Science and Technology Planning Project of Beijing (Z201100007520006).
《Compliance with ethics guidelines》
Compliance with ethics guidelines
Shui Hu, Hongchi Tian, Shijia Zhang, Dan Wang, Guozhuo Gong, Weihua Yue, Keyang Liu, Song Hong, Rui Wang, Qingqing Yuan, Yonglai Lu, Dong Wang, Liqun Zhang, and Jianfeng Chen declare that they have no conflict of interest or financial conflicts to disclose.
《Appendix A. Supplementary data》
Appendix A. Supplementary data
Supplementary data to this article can be found online at https://doi.org/10.1016/j.eng.2021.07.022.


 京公网安备 11010502051620号


