
《1. Introduction》
1. Introduction
Emerging organic contaminants (EOCs), such as pharmaceuticals and personal care products (PPCPs), endocrine disrupting chemicals, flame retardants, per- and polyfluoroalkyl substances (PFASs), and pesticides, constitute increasing concerns in the aqueous environment of China; however, most of these EOCs are still unregulated [1]. These compounds are essential to and frequently used for a variety of domestic, industrial, agricultural, and personal purposes. EOCs enter the aquatic environment through various avenues, including wastewater effluent [2], landfill leachate [3,4], livestock wastewater [5], and agricultural runoff [6]. Because of their continuous consumption and use by humans and their ineffective removal by traditional wastewater treatment processes, EOCs have been ubiquitously detected in diverse water bodies at 10–9 to 10–6 g∙L–1 concentrations [7–11]. Even at 10–9 g∙L–1 concentrations, select EOCs can affect human and ecological health [12–15]. For example, alkylphenol surfactants, bisphenol and phthalate plasticizers, hormones, pesticides, and PFASs have been recognized as endocrine disrupting chemicals [16].
Given the vast number of organic pollutants that exist in the aquatic environment, efforts are needed to prioritize the chemicals of highest concern to ensure that resource-limited monitoring campaigns collect the most important data with respect to potential threats to environmental and human health. In 1977, the US Environmental Protection Agency (EPA) developed 129 priority pollutants for water monitoring and regulatory purposes; furthermore, the US EPA established the contaminant candidate list (CCL) in 1998 to identify unregulated environmental contaminants in drinking water and, to ensure incorporation of new concerns, the CCL is updated every five years↑ (↑https://www.epa.gov/ccl) (updated to CCL4). In the European Union (EU), 45 priority substances and environmental quality standards were established for surface water in Directive 2013/39/EU [17], and watch lists of substances were published in 2015 (Directive 2015/495/EU) and 2018 (Directive 2018/840/EU) for EU-wide monitoring [18]. To fill the gaps of conventional prioritization schemes that often exclude EOCs due to data deficiencies, the NORMAN network, which served as the interface between EOC science and policy for the European Commission, used a decision tree to classify EOCs into six categories. The priority within each category was evaluated using specific properties [19]. A similar approach has been used in China, where the first ‘‘Prioritized list of substances to be subject to control” was published by the Chinese Ministry of Environmental Protection (MEP) in 2017; this list covered 22 hazardous and persistent chemicals, including 17 organic pollutants and five heavy metals [20]; however, these chemicals were conventional pollutants and not EOCs.
To screen hazardous compounds, a variety of prioritization methodologies based on ecological or human health risks have been developed and employed [21–24]. The current prioritization system usually involves pollutant identification, exposure assessment, hazard characterization, and risk analysis. The pollutant identification step involves aggregation of all potential contaminants into a screening list. Exposure assessment encompasses qualitative and/or quantitative evaluation of the estimated contaminant uptake based on concentration and other parameters for each possible exposure route. The exposure concentration can be determined through environmental monitoring or estimated by predictive models. Hazard characterization related to intrinsic chemical properties, such as persistence, bioaccumulation, and toxicity (PBT), is used in chemical registration, evaluation, authorization, and restriction frameworks. These methods do not consider environmental occurrence [25]; therefore, the PBT approach is only suitable to screen chemicals according to hazard effects, and further risk assessments are required for confirmation of environmental relevance. Risk assessment, which integrates the results from exposure analysis and hazard characterization, involves calculation of risk quotients (RQs), which are defined as the ratio of exposure levels to predicted no effect concentrations (PNECs). In addition, the ratio of compound mass loadings to toxicity thresholds [26], frequency of exceedance of safety thresholds [24], and extent of exceedance of toxicity thresholds [27] have also been used as risk indicators. While previous studies have used these risk indicators for contaminant prioritization, PBT, concentration, detection frequency, and human health effects are not always considered in one unified framework. To improve prioritization strategies, several researchers have attempted to rank contaminants using multi-criteria analysis methods [21,28,29], in which quantitative/semi-quantitative values were assigned to each criterion and an empirical algorithm was used to calculate a single score. The most common approaches involve the weighted average method and the most-sensitive index. For example, the priority list from the EU Water Framework Directive (WFD) was established based on exposure and an effect index calculated as the weighted average of various effect scores (e.g., aquatic toxicity, bioaccumulation, and human health hazards) [30]. For the Comprehensive Environmental Response, Compensation, and Liability Act (CERCLA) priority list of hazardous substances, the most-sensitive value of five toxicity indicators (i.e., human chronic toxicity, carcinogenicity, aquatic toxicity, flammability, and radioactivity) was employed as the pollutant effect index [31]. Multi-criteria analysis methods take into account both the ecological risks and the human health risks of pollutants; nevertheless, the incorporation of multiple criteria involves subjective judgement on the relative importance of each criterion and ignores the inherent relationships between criteria. These models also tend to lack clear thresholds that distinguish whether contaminants pose risks to the environment or human health.
With the rapid development and growth in socioeconomic prosperity, the production, consumption, and emission of EOCs are increasing in China, raising serious concerns about environmental quality. This situation has advanced an urgent need to screen and evaluate priority EOCs in Chinese surface water. In fact, several studies have already been conducted to rank priority EOCs in the aquatic environment of China. Sui et al. [29] ranked 39 pharmaceuticals in surface water based on consumption, removal efficiency during wastewater treatment, and ecological effects. Bu et al. [32] ranked 593 pharmaceuticals based on consumption and ecotoxicity data. Using a similar strategy, Li et al. [33] ranked 100 pharmaceuticals in surface water based on their occurrence, exposure, and ecological effects, and subsequently, a new ranking method was employed to re-rank them [34]. Another study [35] ranked 151 organic contaminants in groundwater recharge scenarios. These previous studies have contributed important insight to prioritization of EOCs in Chinese surface water, but the following deficiencies still remain: ① narrowly defined contaminant lists (e.g., pharmaceuticals), ignoring other categories and multi-class EOCs; ② solely focused on environmental risk, ignoring potential human health effects; ③ only used estimated EOC concentrations in surface water, introducing considerable uncertainty compared to approaches that employ measured concentrations; ④ subjectively decided the relative importance of each criterion by individual or expert judgement; and ⑤ generally lacked uncertainty analysis. To address these shortcomings, an integrated prioritization scheme that involves environmental monitoring, ecological risk, human health risk, and uncertainty analysis for multi-class EOCs is urgently required for Chinese surface water. In the past five years, a wealth of monitoring data has been reported for surface waters in China, enabling the proposed prioritization strategy.
The purpose of present study was to develop a multi-criteria screening approach that not only addresses the aforementioned limitations of previous prioritization methodologies, but also identifies priority EOCs in Chinese surface water. To accomplish this objective, six criteria (i.e., concentration, detection frequency, persistence, bioaccumulation, ecotoxicity, and human health effects) were used as evaluation parameters. The relative importance of each criterion was determined by multivariate analysis, and priority levels and uncertainty categories were classified based on prioritization analysis and quantity of the available information, respectively. To the best of our knowledge, this report is the first to prioritize multi-class EOCs (e.g., flame retardants, hormones, PPCPs, pesticides, phenols, PFASs, plasticizers, sweeteners) based on analytical observations in Chinese surface water.
《2. Methodology》
2. Methodology
The criteria used to prioritize EOCs involved six primary factors: concentration and detection frequency in Chinese surface water; environmental persistence; bioaccumulation; ecotoxicity; and human health effects. The approach to collecting and parsing these data is described below in Section 2.1. The reported prioritization scheme involved the following steps.
(1) Collecting EOC occurrence data for Chinese surface water between 2013 and 2018 (the time range was expanded for some EOCs based on data availability);
(2) Aggregating and normalizing data for the six prioritization criteria (i.e., concentration, detection frequency, persistence, bioaccumulation, ecotoxicity, and human health effects);
(3) Screening contaminants according to hazard effects, namely persistence, bioaccumulation, ecotoxicity, and human health effects, using the hazard potential (HP) with principal component analysis (PCA);
(4) Reconciling the contaminants that passed Step 3 with the environmental occurrence data;
(5) Retaining compounds with RQs greater than 0.1 even if those contaminants were excluded by Step 3 or 4;
(6) Ranking compounds according to the priority index;
(7) Evaluating uncertainty in development of the priority list;
(8) Combining the results of priority groups and uncertainty categories to propose a priority control list.
The decision-making workflow for the EOC prioritization protocol is shown in Fig. 1 (the utility functions of criteria nomalization is in Table S1 in Appendix A).
《Fig. 1》
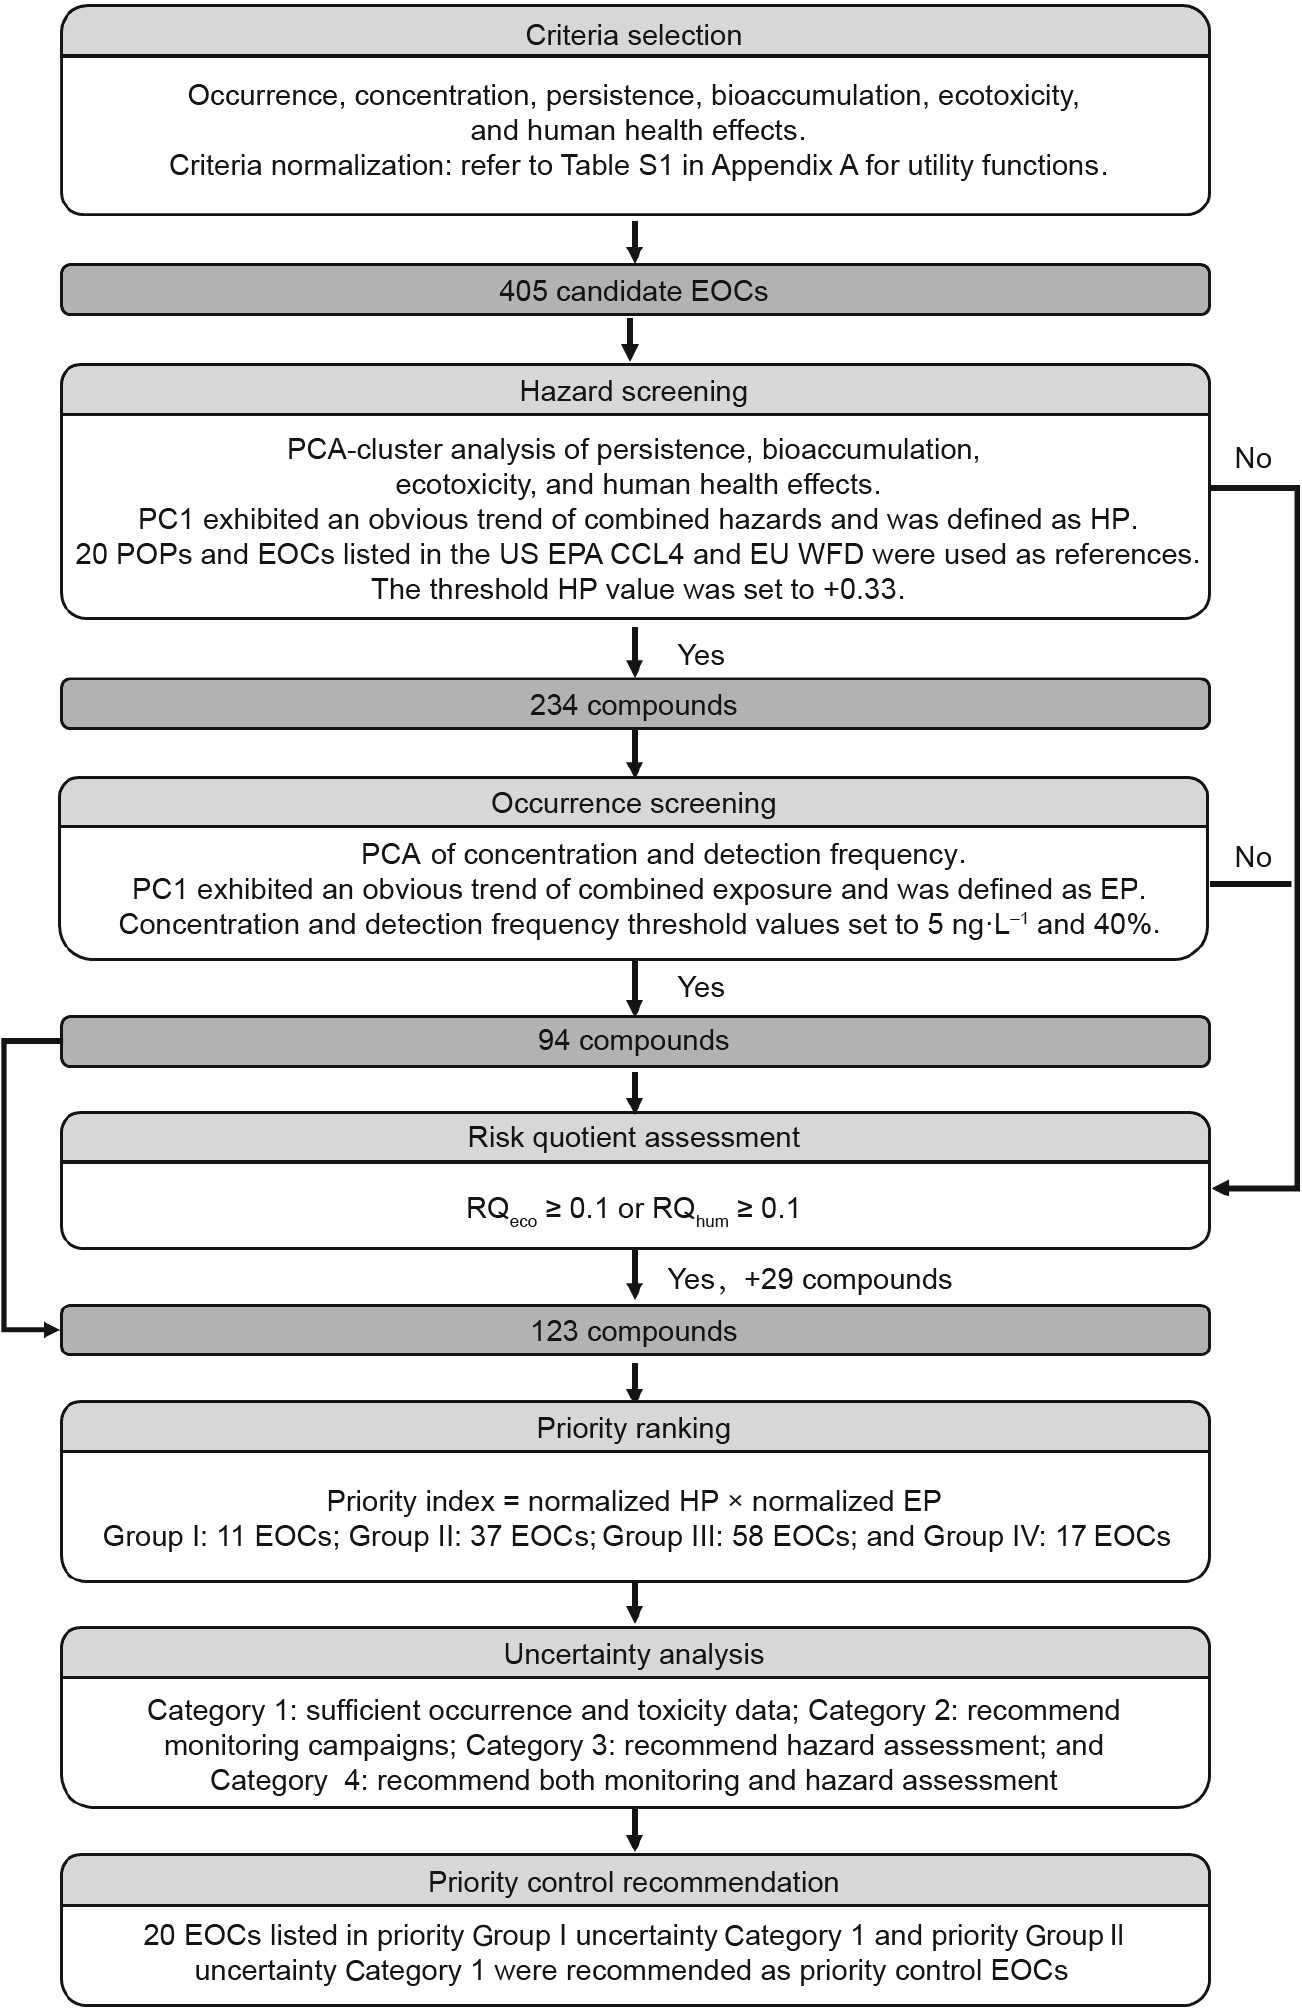
Fig. 1. The workflow of the multi-criteria analysis method for prioritizing EOCs according to occurrence and hazard criteria in this study. POPs: persistent organic pollutants; PC: principal component; PC1: first principal component; EP: exposure potential; RQeco: ecotoxicological risk quotient; RQhum: human health risk quotient. Groups I–IV: top, high, moderate, and low priority group; Category 1: compounds with sufficient occurrence and toxicity data; Category 2: compounds with gaps in occurrence data; Category 3: compounds with gaps in ecotoxicity or human health effects data; Category 4: compounds with gaps in both occurrence and toxicity data.
《2.1. Data collection》
2.1. Data collection
2.1.1. Occurrence
This study attempted to collect all EOC occurrence data (i.e., concentration and detection frequency) for surface water from Chinese mainland for 2013–2018. Some publications lacked explicit values for EOC concentration and detection frequency, and those reports were, therefore, excluded from the aggregate dataset. Overall, 225 references were collected and assessed (see Appendix A Table S2). This evaluation identified 433 EOCs, but 28 of those compounds are already routinely monitored or have been recently banned or restricted in China (Appendix A Table S3). Since those chemicals have already been prioritized for regulation, the remaining 405 EOCs were selected as primary candidate contaminants. The candidate EOCs included agricultural pesticides, industrial chemicals, and PPCPs that were assigned to nine categories: flame retardants; hormones; personal care products; pesticides; phenols; PFASs; pharmaceuticals; plasticizers; and sweeteners.
Data preprocessing efforts involved the following: ① using onehalf of the method detection limit (MDL) in cases where EOCs were not detected (ND); ② using median concentrations and detection frequencies, when available, since these values are less affected by outliers and ND responses; ③ using mean concentrations and detection frequencies when median values were not reported; and ④ calculating the 90th and 50th (median) percentiles for the documented EOC concentrations and detection frequencies for use in the prioritization scheme.
2.1.2. Persistence and bioaccumulation
Persistence was determined by the degradation half-life (DHL) estimated by the BIOWIN v4.1 module in the US EPA Estimation Programs Interface (EPI) Suite [36], and the ultimate biodegradability term was selected as the sole criterion. The units associated with the ultimate biodegradability parameter refer to semiquantitative bins corresponding to the time needed for complete mineralization of a compound: 5 for hours; 4 for days; 3 for weeks; 2 for months; and 1 for longer. Bioaccumulation was related to the octanol–water partition coefficient. As many EOCs undergo acid dissociation reactions, the logDow (Dow: the n-octanol/water distribution ratio) values at pH 7 were obtained from SciFinder [37] and used to correct for chemical speciation impacts on bioaccumulation. The collected EOC persistence and bioaccumulation data are presented in Appendix A Table S4.
2.1.3. Ecotoxicity
Ecological effects were estimated using ecotoxicological PNEC (PNECeco), which was calculated with the long-term/chronic no observed effect concentration (NOEC) or short-term/acute toxicity parameters, namely the half-maximal effective concentration (EC50) or median lethal concentration (LC50), and the assessment factor (AF). According to the European technical guidance for sublethal chronic toxicity [38], NOECs were used with AF values of 100, 50, and 10 based on data availability for the algae, crustacean, and fish trophic levels, respectively. If NOECs were not available, EC50 or LC50 values were employed, and the AF was set to 1000.
The NOECs and EC50/LC50 values were obtained from the US EPA ECOTOX knowledgebase [39], the US Department of Agriculture, Agriculture Research Service Pesticide Properties Database [40], and published studies [41–64]. When more than one NOEC was available, the lowest value was employed to best safeguard potential toxicity concerns during contaminant prioritization. For EOCs without experimentally-measured ecotoxicity data, NOECs were acquired for three trophic levels (i.e., algae, crustaceans, and fish) from the US EPA Ecological Structure Activity Relationships (ECOSAR) model of the EPI Suite program [36]. Detailed data sources for all ecotoxicity parameters are reported in Table S4.
2.1.4. Human health effects
Human health effects were evaluated with PNEChum (ng·L–1 ), which was determined using assumptions about exposure via drinking water and fish consumption for adults [65]. In particular, PNEChum values were based on the acceptable daily intake (ADI, μg·kg–1·d–1 ), reference dose (RfD), or minimal risk level (MRL) and calculated according to Eq. (1).

where 1000 was a conversion factor (ng·μg–1 ); if ADI was not available, RfD or MRL value was employed; BW was body weight and set to 63 kg for an average Chinese adult; AT was the averaging exposure time for adult and set to 10 950 d; IngRDW was the adult drinking water ingestion rate and set to 2 L·person–1·d–1 ; BCF was the bioconcentration factor for EOCs in fish (L·kg–1 ), and these values were obtained from the US EPA Chemistry Dashboard [66]; IngRF was the adult fish consumption rate and set to 0.0175 kg·person–1·d–1 ; EF was the exposure frequency and set to 350 d·a–1 ; and ED was the exposure duration and set to 30 years. For most EOCs, PNEChum was calculated using ADI in Eq. (1).
The ADI values for pesticides were compiled from the National Food Safety Standards of China (GB 2763–2019) [67], the Joint Food and Agriculture Organization of the United Nation and World Health Organization (FAO/WHO) Meeting on Pesticide Residues (JMPR) [68], and the International Programme on Chemical Safety INCHEM [69]. The ADIs for hormones, personal care products, pharmaceuticals, and phenols were provided by the Joint FAO/ WHO Expert Committee on Food Additives (JECFA) [70], the US Food and Drug Administration (FDA) [71], the Australian Pesticides and Veterinary Medicines Authority [72], the European Medicines Agency [73–75], and other sources [6,76–84]. The MRLs for flame retardants and PFASs were obtained from the US Department of Health and Human Services Agency for Toxic Substances and Disease Registry [85]. The RfD data were collected from the US EPA Integrated Risk Information System [86].
When ADI, RfD, and MRL data were unavailable, ADI values were derived from the no observed adverse effect level (NOAEL) or the lowest observed adverse effect level (LOAEL), and an uncertainty factor of 100 was applied. LOAEL was typically reported as the lowest published toxic dose (TDLo) or considered to be equivalent to the lowest therapeutic daily dose [26]. TDLo data were obtained from ChemIDplus [87], and the lowest therapeutic daily doses were collected from an online medical resource [88]. If experimental data were unavailable, LOAEL parameters were modeled using the Lazar toxicity prediction [89] with an uncertainty factor of 1000. In the absence of experimental toxicity data, the structure-based threshold of toxicological concern (TTC) algorithm was used to estimate ADI [90]. TTC represents a conservative generic exposure threshold for chemicals, below which no appreciable risk to human health is expected for a lifetime of exposure [91]. Three Cramer classes are generally applied to characterize TTC levels. The TTC cutoffs for Cramer classes I, II, and III are 1800, 540, and 90 μg·d–1 , respectively, and these criteria correspond to ADIs of 28.6, 8.6, and 1.4 μg·kg–1·d–1 for the average Chinese adult. The Cramer classification scheme was obtained from the ToxTree v3.1.0.185 software. The data sources for all human health effects parameters are detailed in Table S4.
《2.2. Prioritization》
2.2. Prioritization
2.2.1. Normalization of criteria-specific data
To facilitate data comparison, the utility functions in Table S1 were applied to normalize the criteria-specific data to dimensionless terms in the 0–1 range. The approach was adapted from previous utility functions reported by Kumar and Xagoraraki [28]. The environmental EOC concentrations, PNECeco values, and PNEChum terms ranged between six, fifteen, and nine orders of magnitude, respectively. Given these wide distributions, the concentration and PNEC values were log2- and log10-transformed, respectively, to avoid high cluster decentralization and poor parameter discrimination (Appendix A Fig. S1). To provide a reasonable distribution of scores for each specific criterion, the high and low values used in the utility functions were carefully selected to allow the calculated dimensionless utility function terms to span the 0 to 1 range for most EOCs (Fig. S1). Compound scores were calculated using the utility functions in Table S1; however, compounds with values higher than the selected maximum were given a score of 1, and compounds with a value lower than the selected minimum were given a score of 0. If required data were missing for specific criteria, the utility function value was set to 0.5 [28]. The dimensionless values for candidate EOCs are provided in Appendix A Table S5.
2.2.2. Multivariate analysis
PCA is a well-known and commonly used method for exploring the importance of multiple variables on a specific term. The first principal component (PC1) accounts for the largest variance and can be considered a new cumulative variable for screening and ranking of EOCs [92]. In previous studies, the PC1 term has been used to explain the degradability of volatile organic contaminants [93], combined aquatic toxicity for different trophic levels [94,95], and PBT characteristics of pollutants [96]. In the present study, the normalized criteria-specific data for four hazard factors (i.e., persistence, bioaccumulation, ecotoxicity, and human health effects) were analyzed using PCA. The PC1 term, PC1hazard, was defined as an HP that comprehensively evaluated the four hazard effects. Similarly, PC1exposure was used to describe the exposure potential (EP) as a function of contaminant concentration and detection frequency. For verification purposes, 20 persistent organic pollutants (POPs) were selected as reference substances to evaluate the use of the hazard potential to replace the four original hazard effects. The persistence, bioaccumulation, ecotoxicity, and human health effects data for the 20 POPs are reported in Table S4. A cluster analysis was used to group compounds with similar hazard characteristics. k-means clustering is easy to implement and insensitive to outliers, but the pre-assignment of an appropriate number of clusters (k) can influence outcomes. In this regard, the algorithm was run with k values increasing from 2 to a critical value that allowed the 20 POP reference compounds to cluster into one group. The critical value was then used in the algorithm for EOC analysis.
2.2.3. Calculation of RQs
To evaluate the potential risks of candidate EOCs to aquatic species and human health, RQeco and RQhum were calculated according to Eqs. (2) and (3), respectively.
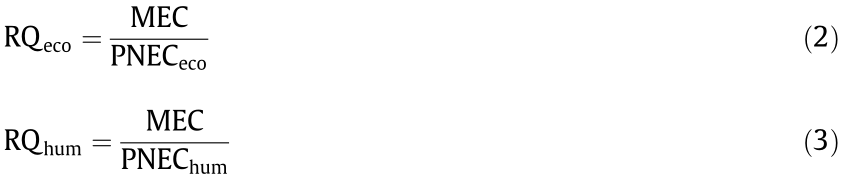
where MEC is the 90th percentile of the measured environmental concentration for each EOC. The PNECeco and PNEChum terms were detailed in Sections 2.1.3 and 2.1.4, respectively.
2.2.4. Scoring
The EP and HP variables were converted to dimensionless terms in the 0–1 range using the utility functions in Table S1. Then, the product of normalized EP and normalized HP was used as the priority index to rank contaminants.
《2.3. Uncertainty analysis》
2.3. Uncertainty analysis
Ideally, the occurrence data would be representative of all Chinese surface waters; however, due to resource constraints and the variable objectives of previous monitoring campaigns, the quantity of data points varied greatly for individual EOCs. For these reasons, uncertainty scores were assigned for occurrence based on the availability of monitoring data. The uncertainty scores for contaminant concentration and detection frequency were assigned to 0 if occurrence data were available in at least four provinces and 50 sites. If occurrence data were available for less than four provinces or 50 sites, the uncertainty score was set to 0.25. If occurrence data were absent, the uncertainty score was set to 0.5. These thresholds were selected to reference the cut-off values of the NORMAN prioritization framework. The model-based ecotoxicity and ADI values also contributed a high degree of uncertainty for EOCs without experimental data. Uncertainty scores for ecotoxicity and human health effects were assigned to 0 when PNEC calculations were based on experimental data, 0.25 when model-based estimates were used, and 0.5 when both experimental and estimated values were unavailable. For the other criteria, uncertainty scores were assigned to 0 or 0.5 based on whether chemical data were available or unavailable, respectively. The arithmetic average of the individual uncertainty scores for the six criteria was used as the final, aggregate uncertainty score.
《3. Results and discussion》
3. Results and discussion
《3.1. Hazard characterization》
3.1. Hazard characterization
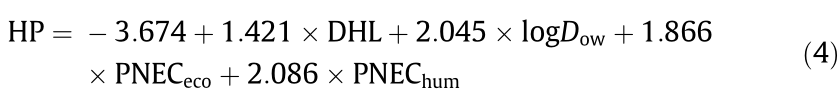
PCA was performed on the 405 compounds of concern and 20 POPs (Fig. 2(a)). PC1hazard explained 49.4% of the total variance, indicating that this component played a major role in the total variance. The four prioritization criteria, namely persistence, bioaccumulation, ecotoxicity, and human health effects, all increased with PC1hazard, highlighting expected trends of the HP parameter. The HP values for the 405 compounds ranged from –2.79 to 2.61 (Appendix A Table S6). As PC1hazard increased, the integrated hazard effects also increased. The POP reference substances generally exhibited the highest values of PC1hazard (i.e., the median value was 2.39), validating the approach to designate PC1hazard values as an integrated HP of persistence, bioaccumulation, ecotoxicity, and human health effects. Overall, PFASs showed relatively high HP with a median value of 1.09 followed by hormones (0.47) and pesticides (0.23). The median HP for the other categories decreased in the following order: flame retardants (–0.06); phenols (–0.08); pharmaceuticals (–0.39); and personal care products (–0.41). Sweeteners and plasticizers exhibited the lowest HP with median values lower than –0.73 (Appendix A Fig. S2). Multiple linear regression was carried out to study the relationship between HP and the four hazard parameters. The linear relationship (Eq. (4)) effectively quantified HP and exhibited a coefficient of determination (R2 ) greater than 0.999.
PC2hazard constituted 23.9% of the total variance; together, the first two components accounted for 73.3% of the cumulative variance. PC2hazard provided resolution of the different hazard parameters. For example, compounds with higher persistence and human health effects were situated in the upper-right section of the PCA score plot in Fig. 2(a), whereas EOCs with higher bioaccumulation potential and ecotoxicity were located in the bottomright section of Fig. 2(a).
《Fig. 2》

Fig. 2. (a) PCA of the four hazardous effect parameters, namely persistence, human health effects, bioaccumulation, and ecotoxicity (PC1hazard was the integrated hazard potential); (b) the percent of each chemical category grouped into the four clusters. Noting that the ‘‘Reference” label in (b) corresponds to compounds identified in the US EPA CCL4, EU WFD, and EU WFD watchlist, and the triangular shaded area in (a) corresponds to the location of reference chemicals.
To organize the POPs into one group, four clusters were needed to ensure suitable grouping of similar compounds. The EOCs were labeled according to cluster in the PCA score plot in Fig. 2(a). Cluster I was generally located at higher PC1hazard values, with POPs grouped at the extreme end of the cluster to represent the greatest hazard. Clusters II and III were located at mid-range PC1hazard values; however, Cluster II mostly consisted of compounds with positive PC2hazard values, and Cluster III generally included compounds with negative PC2hazard values. These results indicated higher persistence and human health effects for compounds in Cluster II and higher bioaccumulation potential and ecotoxicity for EOCs in Cluster III. Cluster IV was located at the lower PC1hazard values, suggesting the lowest hazard effects. The fraction of chemicals corresponding to these clusters is reported for each EOC category in Fig. 2(b). Due to their high representation in Cluster I, PFASs were considered to be the most concerning EOC category. On the contrary, sweeteners were completely distributed into Cluster IV, which makes sense as these chemicals do not represent toxicity concerns but are frequently used as wastewater indicators to inform the sources of more toxic EOCs. While PPCPs were more distributed than sweeteners across the four clusters, the large fraction of molecules in Cluster IV suggested an overall low toxicity; nevertheless, individual PPCPs may still represent primary concerns. Three EOC categories, namely pesticides, phenols, and plasticizers, were mostly present in Cluster III, indicating higher bioaccumulation and ecotoxicity concerns. Hormones were well-represented in Cluster II, suggesting relatively high persistence and human health effects.
To define a suitable HP threshold, the compounds listed in the US EPA CCL4, EU WFD, and EU WFD watchlists were employed. Following the above approach, 77% of these compounds were located in Clusters I and III and distributed in the triangular region shown in Fig. 2(a). To ensure that these chemicals of current regulatory interest were caught by the prioritization scheme, an HP threshold was set at a PC1hazard value of –0.33. This filter captured over 86% of the chemicals from the US EPA CCL4, EU WFD, and EU WFD watchlists and resulted in a list of 234 EOCs for further consideration.
《3.2. Exposure assessment》
3.2. Exposure assessment
The median concentrations of the 405 identified compounds ranged from ND to 3270 ng·L–1 , with 48 compounds exhibiting median concentrations greater than 100 ng·L–1 . The sweetener category, which included widely used compounds like acesulfame and sucralose, demonstrated a relatively high median concentration (438 ng·L–1 ). The next highest median concentrations were observed for plasticizers (46 ng·L–1 ) and phenols (29 ng·L–1 ). The flame retardant, personal care product, pesticide, and pharmaceutical categories exhibited low median concentrations in the range of 3–10 ng·L–1 (Appendix A Fig. S3). Hormones and PFASs had the lowest median concentrations, below 1 ng·L–1 . The average EOC detection frequency exceeded 40% for all categories except hormones (9%) (Appendix A Fig. S4).
The PCA distribution of the exposure parameters for the 405 EOCs is shown in Fig. 3 and Appendix A Table S7. PC1exposure and PC2exposure explained 82% and 18% of the total variance, respectively. Contaminant concentration and detection frequency both increased with PC1exposure, as expected for the EP parameter. As PC1exposure increased, the cumulative exposure potential also increased. The EP values for the 405 EOCs ranged from –2.22 to 1.89. EOC categories with a wide range of physicochemical characteristics, such as pharmaceuticals, pesticides, and personal care products, were broadly scattered across the PC1exposure range. Hormones and PFASs were mainly located at the lower PC1exposur range, indicating lower EP. Sweeteners, plasticizers, phenols, and flame retardants were generally located at higher PC1exposur values that correspond to higher EP. In fact, sweeteners had the highest EP with a median value of 1.5, followed by plasticizers (0.64) and phenols (0.62). The median EP values for the other categories decreased in the following order: flame retardants (0.46); personal care products (0.38); pharmaceuticals (0.24); pesticides (–0.16); PFASs (–0.75); and hormones (–1.59). Multiple linear regression was carried out to determine the relationship between EP and the two exposure factors. The linear relationship (Eq. (5)) effectively quantified the EP and exhibited an R2 greater than 0.999.

《Fig. 3》

Fig. 3. PCA of the two exposure parameters, namely concentration and frequency. PC1exposure was the integrated exposure potential. To facilitate inclusion of compounds with high concentrations and detection frequencies in the EOC prioritization scheme, threshold values were set at 5 ng·L–1 and 40% detection, respectively. Overall, 94 compounds passed these thresholds and were further evaluated (see Appendix A Table S7).
《3.3. Risk assessment》
3.3. Risk assessment
RQs were not calculated for ND compounds whose PNEC was below one-half of the MDL, because the substitution of one-half of the MDL for ND would overestimate the risk associated with these substances. In total, six EOCs exhibited a potential risk to human health with RQhum values greater than 0.1. Of these compounds, 17α-ethinylestradiol and perfluorooctanoate (PFOA) exhibited the highest human health risk with RQhum values of 43.41 and 1.92, respectively. Human health effects were also identified for estriol, 17α-estradiol, disulfoton, and estrone with RQhum values of 0.8, 0.2, 0.1, and 0.1, respectively. Four EOCs, namely 17α -ethinylestradiol, disulfoton, estriol, and estrone, posed risks to both human health and ecological systems. Ecotoxicity concerns were noted for 95 EOCs. The calculated RQeco values were greater than 1000 for 17α-ethinylestradiol, 17β-estradiol, caffeine, lambda-cyhalothrin, cypermethrin, estrone, and imidacloprid, and these EOCs were, therefore, considered to pose the highest risk to aquatic species. Bifenthrin, bisphenol A, bisphenol S, disulfoton, diuron, simazine, and tetracycline exhibited RQeco values greater than 100, representing high risks to ecosystem health. The RQeco values for another ten compounds, namely 4-tert-octylphenol, atrazine-2-hydroxy, bezafibrate, chlorpyrifos, estriol, ethion, fenpropathrin, ibuprofen, levofloxacin, and triazophos, were greater than ten. Another 71 EOCs exhibited RQeco values greater than 0.1. The aggregate results are detailed in Appendix A Table S8. Twenty-nine compounds with an RQ greater than 0.1 were filtered out by the exposure or hazard assessment results (Appendix A Table S9), but these EOCs were included on the priority list due to the risk assessment findings. In total, 123 compounds were considered for multi-criteria ranking.
《3.4. Priority index》
3.4. Priority index
The priority indices of the investigated EOCs are reported in Appendix A Table S10. According to the priority index distribution (Fig. 4), the 123 candidate EOCs were assigned to four groups: Group I (11 compounds with top priority); Group II (37 compounds with high priority); Group III (58 compounds with moderate priority); and Group IV (17 compounds with low priority). Note, the priority ranking was conducted on a relative scale, and so the thresholds for priority index are fluid. In this case, compounds in Groups I and II should be prioritized for future environmental monitoring and regulation. Depending on available resources, the compounds in Groups III and IV should also be considered for incorporation in monitoring campaigns and future efforts to investigate removal in drinking water and wastewater treatment plants.
《Fig. 4》
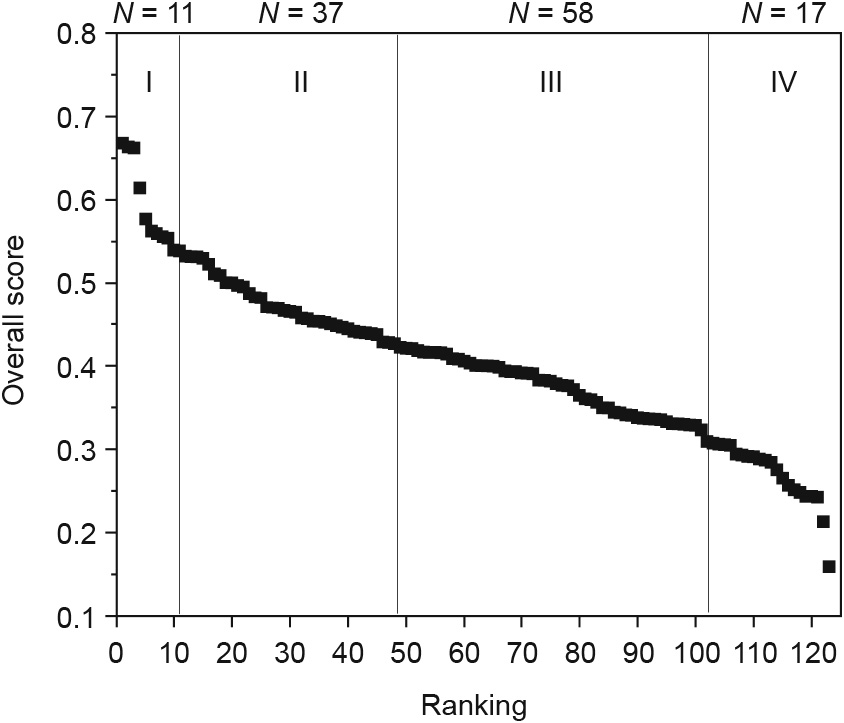
Fig. 4. Priority index and rankings for the investigated EOCs. The priority index cutoffs for inclusion in Groups I, II, and III were 0.54, 0.43, and 0.30, respectively.
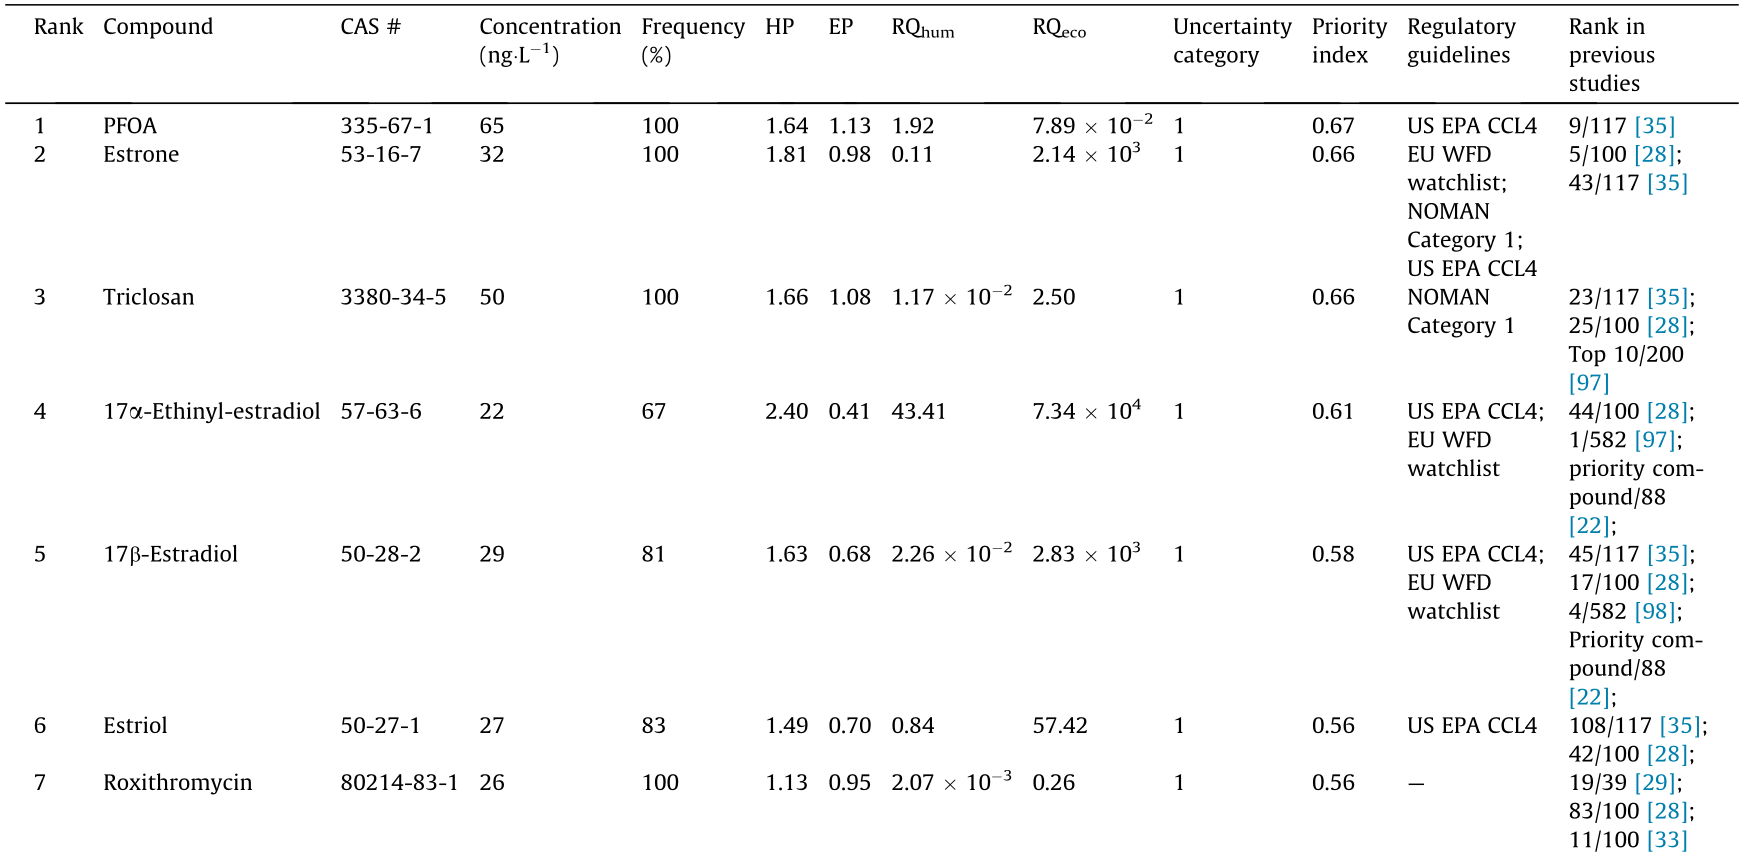
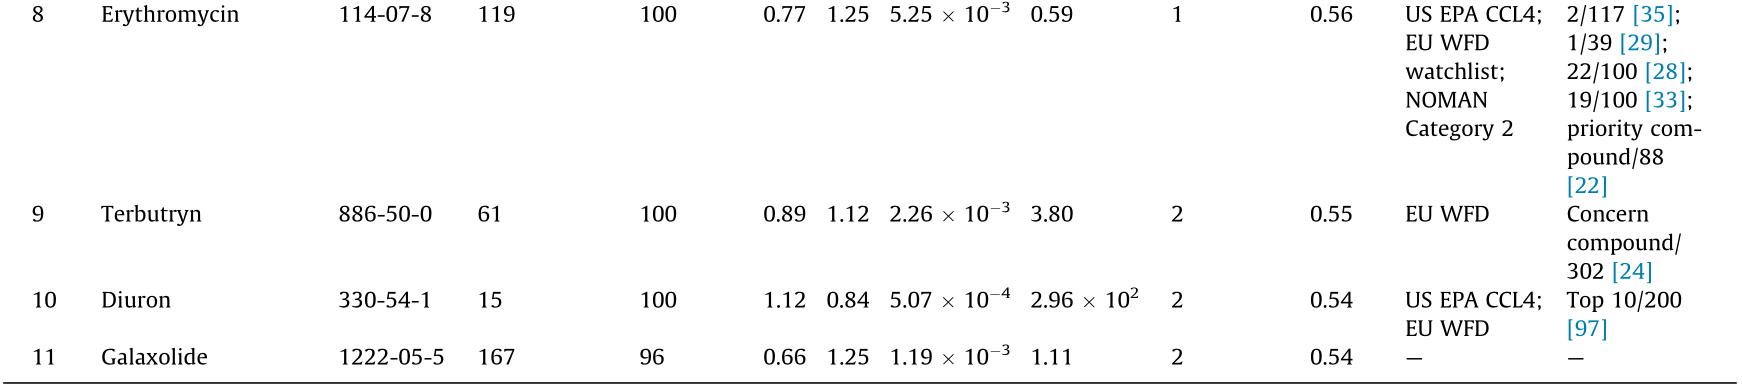
Antibiotics (i.e., erythromycin and roxithromycin), hormones (i.e., 17α-ethinylestradiol, 17β-estradiol, estriol, and estrone), herbicides (i.e., diuron and terbutryn), PFASs (i.e., PFOA), and personal care products (i.e., triclosan and galaxolide) were the toppriority compounds in Group I (Table 1) [22,24,28,29,33, 35,97,98]. Erythromycin has been identified as an antibiotic of particular concern for the aquatic environment due to its high consumption, persistence, and toxicity [99]; notably, erythromycin has already been included on the WFD watchlist (2018/840) and is the only antibiotic on the US EPA CCL4. Roxithromycin is a commonly used macrolide antibiotic that has been widely detected in the aquatic environment and poses a potential threat to aquatic organisms [100]. Four estrogenic hormones, namely 17α-ethinylestradiol, 17β-estradiol, estriol, and estrone, are primary contributors to estrogenic activity in the environment [101] and have been listed in either Directive 2013/39/EU or the US EPA CCL4. Diuron is a phenylurea herbicide commonly used in antifouling applications and weed control; furthermore, diuron is highly toxic to non-target organisms and classified as a possible carcinogen [102]. Terbutryn, a triazine herbicide used to control broadleaf weeds, free-floating weeds, and algae, was banned in EU agriculture in 2002 and recognized as a priority substance (Directive 2013/39/EU) due to its bioaccumulation potential [103,104]. Triclosan is a widely used antibacterial preservative, which undergoes biomagnification, exhibits potential endocrine disrupting effects, and poses acute and chronic toxicity to various organisms [105]. For these reasons, the use of triclosan in soap and other personal care products has been banned by the US FDA [106]; furthermore, triclosan has been identified as a priority substance (NORMAN Category 1)↑(↑ http://www.norman-network.net/) [19]. Galaxolide is a polycyclic musk that has been increasingly emphasized due to its high consumption, lipophilicity, persistence, and recalcitrance in biological processes [107]. PFOA is an industrial chemical with high chemical and thermal stability; however, this PFASs molecule exhibits persistence, bioaccumulation, toxicity, and the capacity for long-range transport. In fact, PFOA was recently listed in Annex A of the Stockholm Convention on Persistent Organic Pollutants [108].
《Table 1》
Table 1 Summary of the concentration, detection frequency, HP, EP, RQhum, RQeco, priority index, and uncertainty category for the 11 top-priority EOCs in Group I. The results are compared to findings from previous studies.
The 37 compounds included in the high-priority Group II are detailed in Table 2. Eight of these compounds, namely azithromycin, clarithromycin, cypermethrin, imidacloprid, isoproturon, permethrin, simazine, and tebuconazole, were listed in Directive 2013/39/EU, the EU WFD watchlists, or the US EPA CCL4. Bisphenol A, carbamazepine, and diclofenac were listed in NORMAN Category 1, and azithromycin, clarithromycin, and oxadiazon were included in NORMAN Category 2. A summary of the prioritization of the 83 EOCs included in regulatory guidelines from other countries (e.g., EU WFD, WFD watchlists, US EPA CCL4, NORMAN Categories 1 and 2) is presented in Appendix A Table S11. Overall, 36 EOCs were included in the priority list for China, and the other compounds were filtered according to the following criteria: did not pass the occurrence filters (five compounds); did not pass the hazard filters (three compounds); already banned or restricted in China (eight compounds); already routinely monitored (four compounds); not monitored in Chinese surface water (16 compounds); and unregistered in China (11 compounds).
《Table 2》
Table 2 Summary of the concentration, detection frequency, HP, EP, RQhum, RQeco, priority index, and uncertainty category for the 37 high-priority EOCs in Group II.


DEET: N,N-diethyl-3-methyl benzoyl amide.
Based on previous contaminant screening studies, Sui et al. [29] identified diclofenac (Group II), erythromycin (Group I), and ibuprofen (Group III) as high-priority pharmaceuticals in Chinese surface water. Li et al. [35] noted that the top three organic contaminants in Chinese groundwater were erythromycin (Group I), ibuprofen (Group III), and nonylphenol (already restricted in China). A more recent study recommended diclofenac (Group II), erythromycin (Group I), and penicillin G (Group III) as highpriority EOCs in Chinese surface water [33]. Additional reports have suggested prioritization of the following EOCs: 17α-ethinylestradiol (hormone); 17β-estradiol (hormone); diuron (herbicide); erythromycin (pharmaceutical); estrone (hormone); PFOA (PFASs); roxithromycin (pharmaceutical); terbutryn (herbicide); and triclosan (personal care product) [22,24,28,29,33,35,97,98] (Table 1). Galaxolide, which was not included on the other lists, was identified as a top-priority EOC in this study and should, therefore, be given special consideration.
《3.5. Characterization of priority categories》
3.5. Characterization of priority categories
Fig. 5(a) reports the number and category of chemicals in each priority ranking group. Hormones, personal care products, pesticides, and pharmaceuticals contributed 36%, 18%, 18%, and 14%, respectively, of the compounds in Group I. Pesticides and pharmaceuticals accounted for 45% and 29%, respectively, of the EOCs assigned to Group II. Given their contributions to Groups I and II, pesticides and pharmaceuticals were identified as top-priority categories. However, the number of pharmaceuticals and pesticides that were evaluated was higher than the number of compounds from other classes, potentially leading to their larger contributions to the top- and high-priority groups. To assess this possibility, the percentage of evaluated compounds from each specific category was calculated for each ranking group (Fig. 5(b)). In Group I, hormones ranked first with 15% representation, followed by PFASs (5%). Pharmaceutical inclusion in Group I was fairly low (1%) due to the large number of candidate compounds. Overall, hormones, pesticides, PFASs, and pharmaceuticals were selected for prioritization in future monitoring and treatment studies due to their inclusion in Groups I and II, which represent severe ecotoxicity and human health risks.
《Fig. 5》
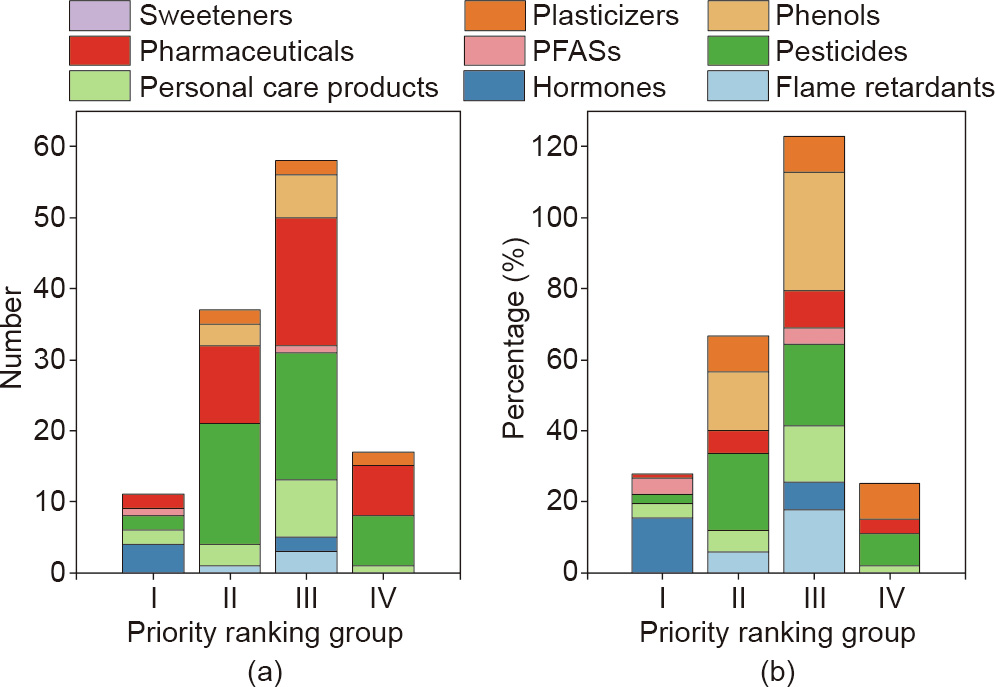
Fig. 5. (a) The number of chemicals from each category in each ranking group; (b) the percentage of chemicals from each category (based on the total number of considered EOCs) in each ranking group. Note that the summed percentages for a particular category do not add to 100% because some chemicals were not ranked.
Category-specific ranking lists for the 123 important EOCs were constructed using their priority index (Appendix A Table S12). The top-priority compounds from each category were as follows: bisphenol A (phenol); diisodecyl phthalate (plasticizer); estrone (hormone); terbutryn (pesticide); roxithromycin (pharmaceutical); PFOA (PFASs); triclosan (personal care product); and tris(1,3- dichloro-2-propyl) phosphate (flame retardant). These compounds represent one potential suite of EOCs to be incorporated into monitoring programs, evaluation plans for drinking water or wastewater treatment processes, or other studies involving environmentally-relevant mixtures of priority EOCs.
《3.6. Comparison between different ranking methods》
3.6. Comparison between different ranking methods
The top 50 EOCs determined by five separate prioritization schemes, namely EP, HP, RQhum, RQeco, and priority index, are presented in Table 3. The complete ranking lists are available in Appendix A Table S13. A Pearson’s correlation analysis (Appendix A Table S14) indicated that the correlation between the five ranking methods ranged from –0.25 (EP vs HP) to 0.72 (EP vs priority index). In fact, the priority index correlated well with EP and HP (0.43), confirming the above approach which considered both ecological and human health risks associated with EOCs. Four of the prioritization schemes identified 17α-ethinylestradiol, 17β-estradiol, atrazine-2-hydroxy, N,N-diethyl-3-methyl benzoyl amide (DEET), diazepam, disulfoton, estriol, estrone, metoprolol, oxadiazon, PFOA, quinalphos, terbutryn, and triclosan in the top 50 EOCs. Similarly, 4-tert-butylphenol, acetaminophen, bifenthrin, bisphenol A, carbamazepine, caffeine, clarithromycin, cyfluthrin, cypermethrin, diclofenac, diuron, erythromycin, galaxolide, isoproturon, lambda-cyhalothrin, permethrin, and roxithromycin were ranked in the top 50 compounds by three of the prioritization strategies. With the exception of, the priority index identified the 31 EOCs mentioned above as Groups I or II compounds, highlighting the effectiveness of the reported approach to account for both occurrence and toxicity factors.
《Table 3》
Table 3 Top 50 priority EOCs based on the five different prioritization schemes, namely EP, HP, RQhum, RQeco, and priority index.
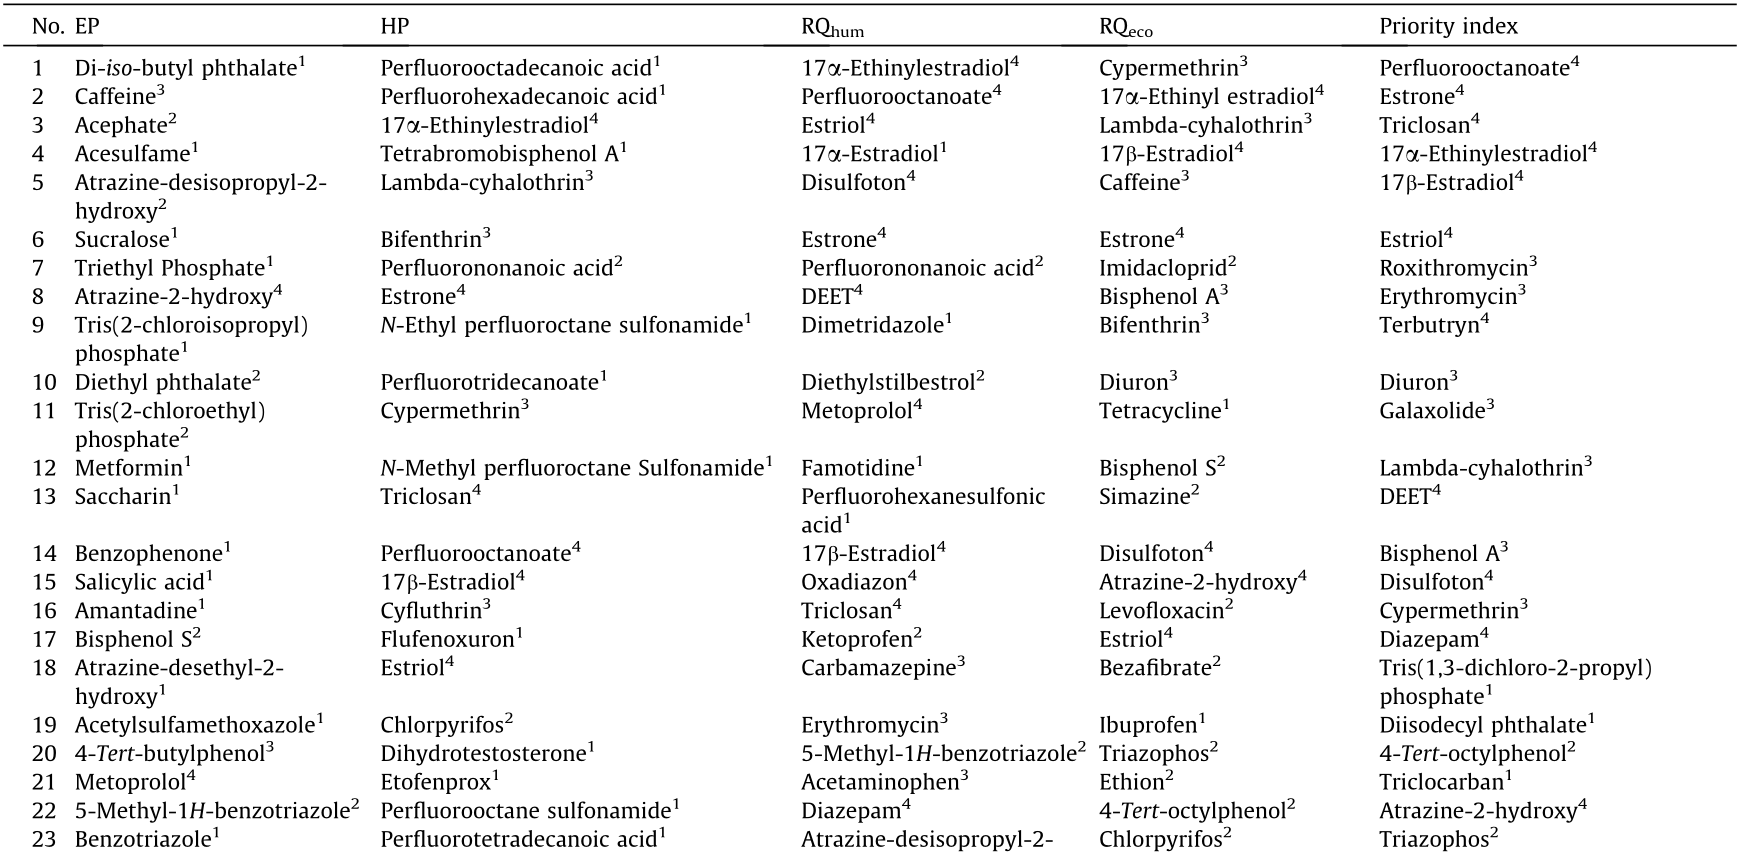

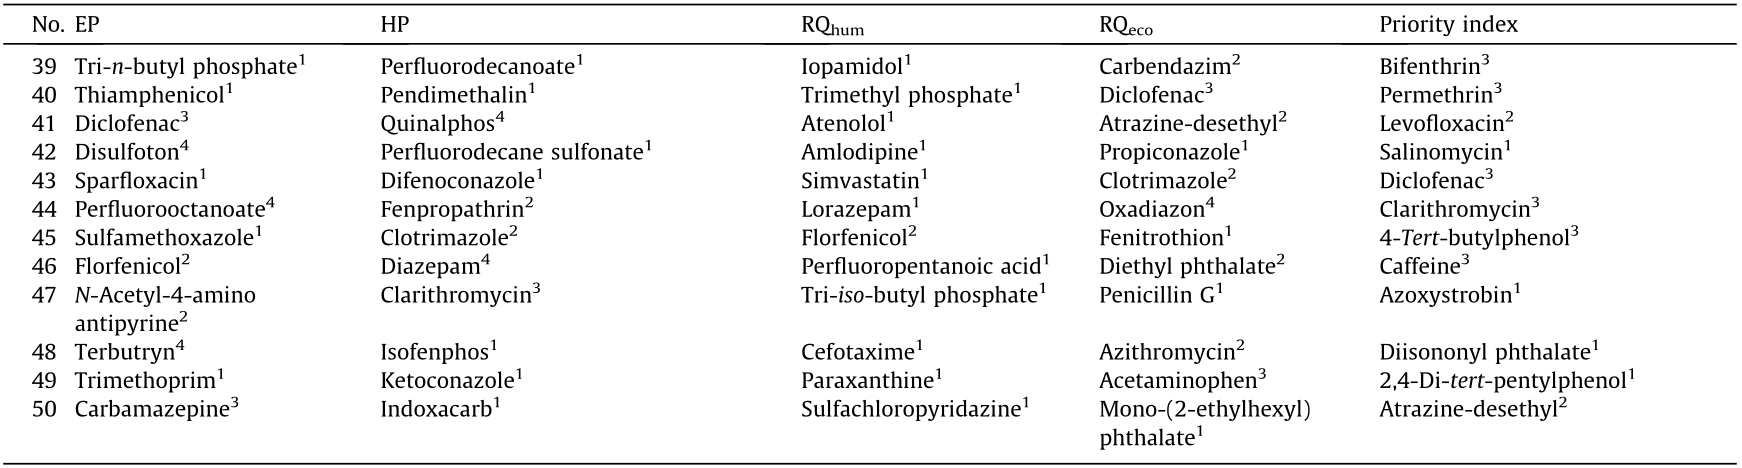
1-4 Compounds that are represented on 1–4 different lists, respectively.
《3.7. Uncertainty analysis》
3.7. Uncertainty analysis
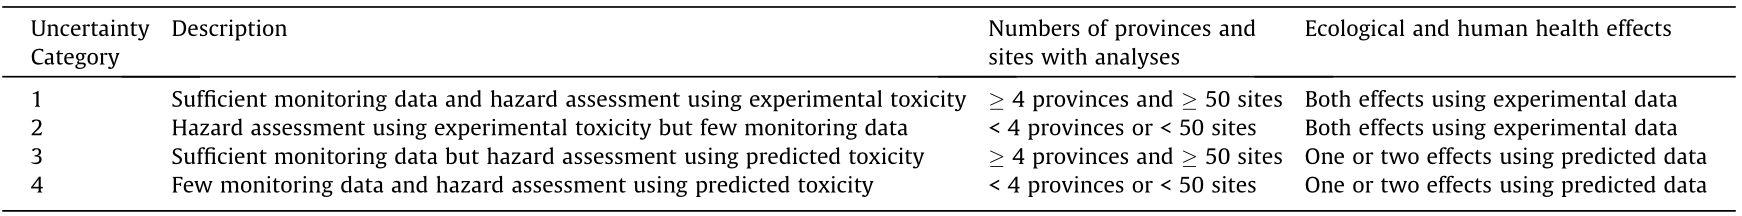
The overall uncertainty scores for candidate EOCs are shown in Appendix A Table S15. According to the source of uncertainty, chemicals were classified into four categories: Category 1 (83 compounds with sufficient occurrence and toxicity data); Category 2 (115 compounds with gaps in occurrence data); Category 3 (51 compounds with gaps in ecotoxicity or human health effects data); and Category 4 (156 compounds with gaps in both occurrence and toxicity data). The cut-off values for each uncertainty category are reported in Table 4. Increased monitoring is recommended for compounds in Category 2, while rigorous hazard assessments are needed for compounds in Category 3. More monitoring campaigns and hazard assessments are recommended for compounds in Category 4. Fig. 6 reports the quantity and percentage of chemicals from each EOC class in the four uncertainty categories. Pharmaceuticals and hormones were evenly distributed across the four uncertainty categories. Pesticides were generally classified in Category 2, suggesting the need for more monitoring campaigns in Chinese surface water. Most PFASs were included in Category 3, indicating data gaps related to hazard assessments. Flame retardants, personal care products, phenols, plasticizers, and sweeteners were well-represented in Category 4, suggesting the need for increased emphasis on both monitoring campaigns and hazard assessments. Overall, 38.5% of the EOCs were classified into Category 4, highlighting major knowledge gaps for occurrence and toxicity of EOCs in Chinese surface water. The compounds in each uncertainty category were ranked by priority index, and the results are listed in Appendix A Table S16.
《Table 4》
Table 4 Cut-off values assigned to uncertainty Categories 1–4 for EOCs in Chinese surface water.
《Fig. 6》
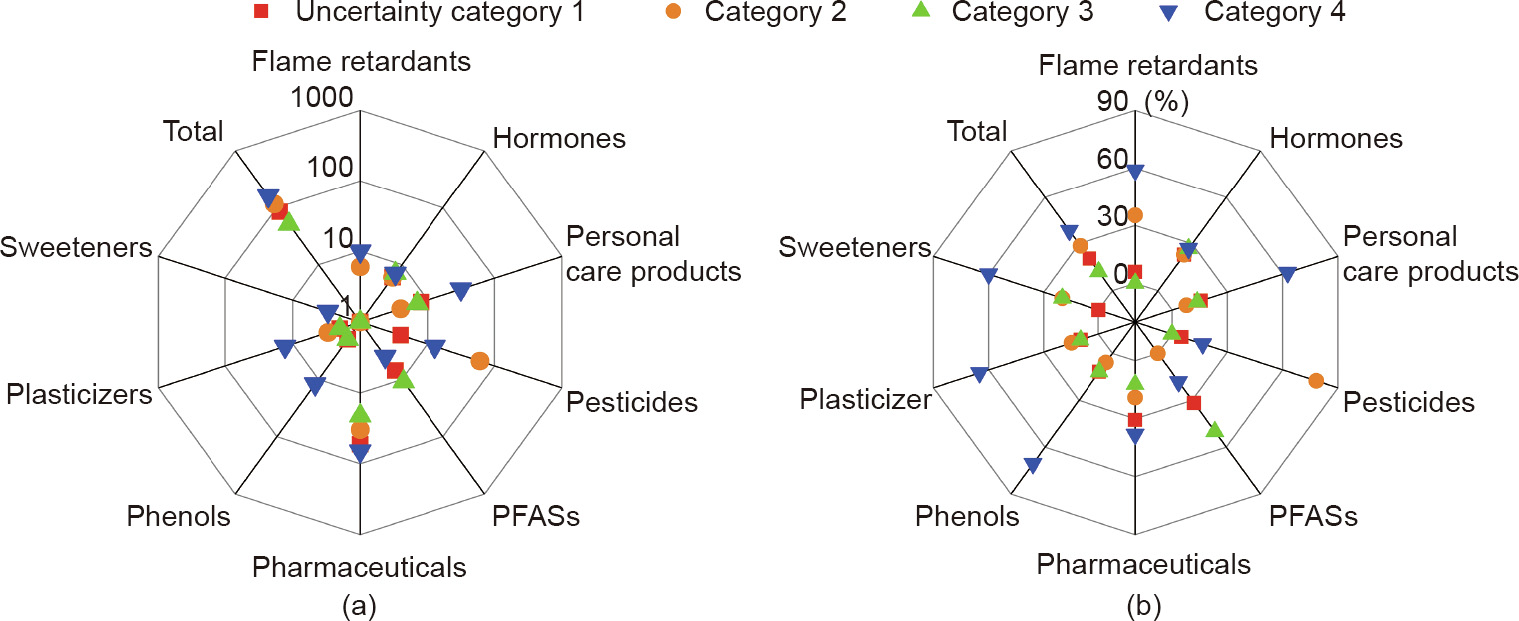
Fig. 6. The (a) number and (b) percentage of chemicals from each EOC category in each uncertainty category.
《3.8. Priority control recommendation》
3.8. Priority control recommendation
According to the four priority groups and four uncertainty categories, the EOCs were divided into 16 subgroups. The uncertainty categories for compounds listed in the priority groups are detailed in Table 5; overall, 47, 48, 9, and 19 substances were listed in uncertainty Categories 1, 2, 3, and 4, respectively. Routine monitoring, derivation of environmental quality standards, and development of control strategies are recommended for the 20 priority control EOCs listed in priority Group I/uncertainty Category 1 and priority group II/uncertainty Category 1. If feasible, special attention should be also paid to the 27 EOCs in priority Group III/ uncertainty Category 1 and priority Group IV/uncertainty Category 1. The compounds in other uncertainty categories were selected as candidates for routine monitoring, and different actions should be taken according to the recommendations in the previous section. As new exposure and toxicity data are collected, these EOCs should be reevaluated for inclusion in the priority control list.
《Table 5》
Table 5 The uncertainty categories for compounds listed in priority groups.

a Compounds with inadequacy of the analytical methods used in monitoring campaigns.
In addition, 17 substances (i.e., 17α-ethinylestradiol, 17β-estradiol, 17β-trenbolone, atorvastatin, bifenthrin, chlorpyrifos, cyfluthrin, cypermethrin, dihydrotestosterone, disulfoton, estrone, ethion, etofenprox, fenthion, imidacloprid, lambda-cyhalothrin, and triazophos) exhibited PNEC values lower than or close to the method quantitation limit (see Appendix A Table S8). This situation reveals the inadequacy of the analytical methods used in monitoring campaigns and suggests the need for continued improvement of analytical strategies. Moreover, several newly identified contaminants of emerging concern (e.g., metabolites) have been detected in water resources from other countries but have not been monitored in Chinese surface water. For this reason, analytical methods should be regularly maintained and updated to ensure collection of spatially- and temporally-resolved occurrence data for EOCs, especially those in Groups I, II, and III [109,110].
《4. Conclusions》
4. Conclusions
In the present work, a multi-criteria analysis method based on exposure potential and hazard potential was developed to prioritize 405 EOCs in Chinese surface water. Compounds were sequentially filtered by their hazard effects, occurrence, and risk assessment, and then an integrated priority index was calculated. The multivariate analysis approach provided an effective system for characterizing potentially hazardous compounds. PFASs and hormones exhibited a relatively high HP, while sweeteners and plasticizers demonstrated lower HP values. Exposure analysis indicated the relatively high EP of sweeteners and plasticizers and the low EP of hormones and PFASs. RQ analysis identified six EOCs with human health effects and 94 EOCs with ecotoxicity concerns. Four EOCs, namely 17α-ethinylestradiol, disulfoton, estriol, and estrone, posed risks to both human and ecological health. A list of 11 top-priority compounds and 37 high-priority compounds was generated from the priority index. Overall, hormones, pesticides, PFASs, and pharmaceuticals were identified as the categories with the largest number and percentage of compounds in the topand high-priority groups. Different ranking methods were evaluated to ensure that the priority index satisfactorily captured compounds identified from prioritization according to individual criteria, and a good correlation was confirmed. Based on the availability of occurrence and toxicity information, four uncertainty categories were established. Ultimately, 20 EOCs are recommended as priority compounds based on their classification in priority Group I/uncertainty Category 1 and priority Group II/uncertainty Category 1. EOCs in uncertainty Categories 2, 3, and 4 are recommended for increased monitoring, rigorous hazard assessments, and both environmental monitoring and toxicity assessments, respectively.
《Acknowledgments》
Acknowledgments
This work was supported by the Major Science and Technology Program for Water Pollution Control and Treatment in China (2017ZX07202) and Beijing Science and Technology Planning Project (Z191100006919003). The authors gratefully acknowledge Agilent Technologies for technical support.
《Compliance with ethics guidelines》
Compliance with ethics guidelines
Mengmeng Zhong, Tielong Wang, Wenxing Zhao, Jun Huang, Bin Wang, Lee Blaney, Qingwei Bu, and Gang Yu declare that they have no conflict of interest or financial conflicts to disclose.
《Appendix A. Supplementary data》
Appendix A. Supplementary data
Supplementary data to this article can be found online at https://doi.org/10.1016/j.eng.2020.12.023.


 京公网安备 11010502051620号


