

《1. Introduction》
1. Introduction
Laser polishing has attracted growing attention as a promising method to reduce surface roughness and enhance the surface quality of various components, thanks to its excellent adaptability, high precision, and high degree of automation in an environmentally friendly fashion [1–3]. Recently, additive manufacturing (AM) has attracted a great deal of attention for the rapid production of net-shaped or near-net-shaped complex components [4,5] and functional devices [6,7]. Unfortunately, the rough surfaces of such freeform-fabricated components, which have an average roughness  of 10–25 μm, limit their practical applications [8], making additional post-polishing necessary.
In particular, the laser polishing of additive manufactured surfaces has been developed as an effective solution to this issue. Laser polishing re-melts the surface with high efficiency, without altering or affecting the bulk properties [9–11]. However, for most existing laser equipment, high-precision large-area polishing is challenging due to the relatively limited stroke of the galvanometer scanner. To achieve large-area processing, the conventional step-scan method was developed, which involves a galvanometer scanner and a linear motion stage [12]. In this method, the stage moves to a specified position and then stops; subsequently, the scanner executes the processing and then stops. Next, the stage moves to the next position and repeats the cycle. Due to the repetitive start–stop motion of both the stage and the scanner, stitching errors are inevitable, resulting in poor surface quality at the boundary of the scanning areas. Furthermore, such discontinuities significantly reduce the efficiency during large-area processing.
To overcome this problem, considerable research efforts have been devoted to compensating for and/or eliminating stitching errors. For example, the chart-based compensation method is a straightforward approach in which distortion of the  lens (the focusing part of a scanner) is compensated for by an appropriate correction chart. Ref. [13] presents a cross-scale laser lithographic system using this method, and Ref. [14] proposes a calibration method to reduce lens distortion by means of a visual aid system, which requires fewer calibration routines. Although the calibration-based method can improve fabrication quality, it is not a systematic way to avoid stitching errors in principle. To avoid stitching errors, a synchronized motion-control architecture is necessary, such that the scanner and the motion stage can be in motion simultaneously. An ‘‘on-the-fly” concept was initiated in laser marking with high efficiency, and was adapted to large-area laser processing [15] and laser-hardening processing [16] by utilizing a one-axis stage and a galvanometer scanner. It is notable that, in this on-the-fly fashion, the motion stage usually moves along one direction and the boundary of the laser processing area is nonhomogeneous. Very recently, a combination of a motion stage and a galvanometer scanner was reported to produce integrated automation over standard industrial Ethernet networks [17]. The connection between each sub-motion system was based on two control boards; however, this system was not an open architecture platform, making it inconvenient for customized laser-processing applications.
Aside from laser polishing, there has been an increasing demand for continuous large-area precision processing, such as direct laser writing for electronics and biomedical devices [18,19], laser processing for functional surfaces [20,21], threedimensional (3D) direct laser fabrication [22,23], laser AM [24], and so forth. It should be noted that these large-area laser precision processing applications also require a scanner–stage system with synchronized motion.
In this paper, a scanner–stage synchronized system is proposed in order to achieve large-area precision laser polishing without stitching errors. Stainless steel was adopted as the polished surface to demonstrate the stitching-error-free feature of the proposed scanner–stage synchronized system. Furthermore, the large-area laser polishing of an additive manufactured component was successfully achieved with high polishing quality. The proposed scanner–stage synchronized system shows great potential for largearea laser material processing with both high quality and high efficiency.
《2. Experimental procedures》
2. Experimental procedures
《2.1. Materials》
2.1. Materials
AISI 304 stainless steel (China Baowu Steel Group, China) with dimensions of 200 mm × 200 mm × 1 mm was used to test the accuracy of the laser processing. The Inconel 718 (IN718) alloy blocks used in the laser-polishing experiment were fabricated by an EOSINT-M280 DMLS system (EOS Gmbh, Germany) equipped with a continuous ytterbium (Yb)-fiber laser in an inert atmosphere processing chamber (oxygen content ≤ 50 ppm). Prealloyed IN718 powder with particle sizes ranging from 30 to 50 μm was used as the printing material.
《2.2. Synchronized laser-polishing system》
2.2. Synchronized laser-polishing system
As shown in Fig. 1, a synchronized system was developed to achieve large-area laser polishing combining the motion of the galvanometer scanner and the linear motion stage. A continuous wave neodymium-doped yttrium aluminum garnet (Nd:YAG) laser source was used to generate a nanosecond laser beam with a maximum power of 100W and a central wavelength of 1064 nm for the scanner–stage synchronized processing and polishing experiment. An XY scanner head with an aperture of 10 mm and a focal length of 160 mm was used for high-speed scanning within the range of 100 mm × 100 mm. A direct drive linear motion stage with a range of 600 mm × 600 mm, a maximum speed of 800 mm∙s–1 , and a precision of ±3 μm was custom designed in order to achieve large area surface processing. The continuous force, peak force, and moving mass of the linear motor are 51 N, 240 N, and 0.19 kg, respectively, which were considered during the off-line path planning. Based on these components, we developed a scanner–stage synchronized laser-polishing system. In commercialized products, the galvanometer and motion stage are controlled by different servo systems; hence, it is difficult to synchronize them to achieve a fabrication process. This difficulty can be overcome by our selfdeveloped open-architecture-based fabrication system.
《Fig. 1》
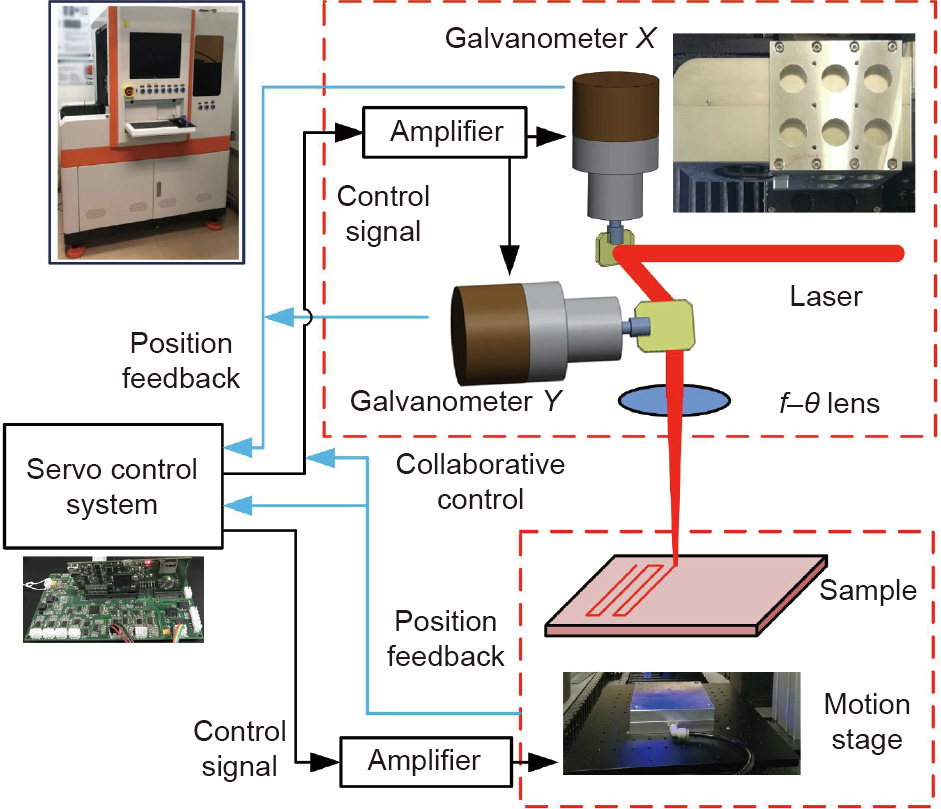
Fig. 1. Schematic diagram of a scanner–stage synchronized laser-polishing system.
In our self-developed system, the control signals generated by the servo control system are sent to the motion stage and the galvanometer scanners at the same time to achieve synchronized motion, which allows stitching errors to be avoided and maximizes the efficiency of the large-area laser processing. In order to achieve synchronized processing, it is necessary to have a control structure, which consists of a motion decomposition module and an error synthesis module. Below, we introduce the architecture of the synchronized motion system and its operation principle.
《2.3. Architecture of the synchronized motion system》
2.3. Architecture of the synchronized motion system
Fig. 2 provides a block diagram of the proposed scanner–stage synchronized system, in which r, rscanner, and rstage represent the reference signal, the reference pattern of the scanner, and the reference pattern of the stage, respectively; Cs, Cscanner, and Cstage represent the controllers of the synchronized system, the scanner, and the stage, respectively; Pscanner and Pstage represent the models of the scanner and stage, respectively; and θ, x, and e represent the angular displacement of the scanner, the displacement of the stage, and the feedback error of the synchronized system, respectively.
《Fig. 2》
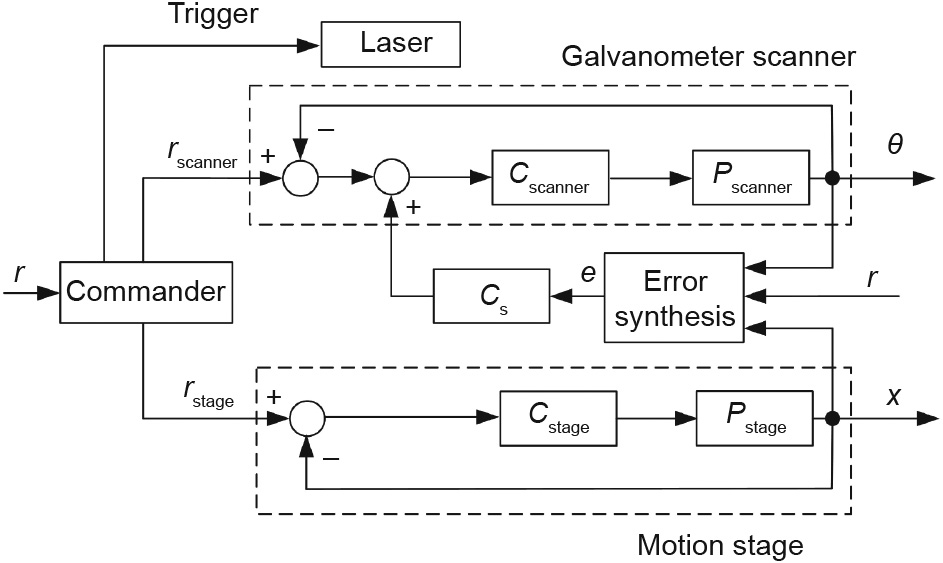
Fig. 2. Block diagram of the scanner–stage synchronized control structure.
The proposed control strategy is based on a master–slave control structure [25], and its working principle is briefly introduced as follows by considering the high speed but small stroke of the scanner, and the low speed but large stroke of the stage. The reference patterns of the stage and scanner are obtained by the commander with the given reference and a vector decomposition. In addition, instructions are sent to the laser controller by the commander to trigger the laser at the predetermined time. The input signals of the two sub-motion systems are then simultaneously sent by the commander, and the galvanometer scanner and the motion stage are synchronized to accomplish the desired motion. The two sub-motion systems execute their motions by tracking the corresponding decomposed reference trajectories separately. Besides the separate control loop of the two subsystems, the error of the synchronized system calculated by the error synthesis module is fed back to the scanner system at the same time to achieve a real-time adjustment, which ensures the performance of the synchronized system. It should be noted that, in this scheme, the motion stage system serves as the master subsystem and the galvanometer scanner serves as the slave subsystem.
Detailed descriptions of the motion decomposition and the error synthesis module are provided in Sections 2.4 and 2.5, respectively.
《2.4. Motion decomposition of the synchronized system》
2.4. Motion decomposition of the synchronized system
The motion decomposition principle was designed by considering the different features of the two sub-motion systems in order to make the best use of the high-speed scanning of the galvanometer and the large motion stroke of the stage. For the motion decomposition of the commander, the following criteria were considered, based on the specific parameters of the processing system.
(1) The scanning range of the galvanometer (xscanner) should be in the field of view (FoV) (xFoV) and should be as small as possible to avoid unnecessary field distortion; that is

(2) The acceleration of the motion stage  should be within an allowable range
  according to the motion stage and should be as small as possible to ensure the performance of the stage, which can be expressed as follows:

(3) Another inevitable restriction is the vector composition of the motion, which implies that the vector sum of the stage motion (xstage) and the scanner motion (xscanner) should be the reference target motion (xr); this can be expressed as follows:

From a practical standpoint, different methods can be used to achieve the motion decomposition, as long as they satisfy the above criteria. A common practice is to obtain the stage motion from the given reference, and then to conduct a vector composition. As a result, the sub-motions of both the scanner and the stage can be obtained.
In this paper, we provide a motion decomposition method by utilizing a moving average low-pass filter in the following form:
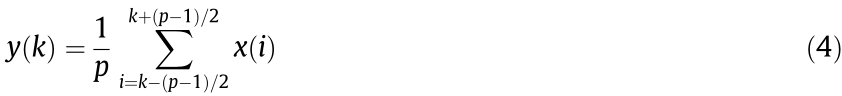
where y(k), x(i), and p respectively denote the displacement of the stage at the time instant kTs with a sampling time Ts, the displacement of the general reference input at the time instant iTs, and the parameter of the low-pass filter; k and i denote the kth sampling period of the displacement of the stage and the ith sampling period of the general reference input, respectively.
To better illustrate the above motion decomposition, an example is provided, as shown in Fig. 3. By appropriately choosing the filter parameters in both the X and Y directions, linear stage motion is generated (Fig. 3(a)). The displacement distributed to the scanner in the two axes is shown in Fig. 3(b), and is within the FoV of the scanner. Furthermore, the velocities distributed to the stage and the scanner are shown in Figs. 3(c) and (d), respectively; the velocity curve of the stage is relatively smooth within the allowed acceleration, while that of the scanner is very sharp.
《Fig. 3》

Fig. 3. Motion decomposition of the synchronized system: (a) planar trajectory distribution; (b) displacement of the scanner in two axes; (c) velocity of the stage in two axes; and (d) velocity of the galvanometer scanner in two axes.
《2.5. Error synthesis and feedback control》
2.5. Error synthesis and feedback control
An error synthesis module was developed in the synchronized motion system in order to further improve the synchronized performance (Fig. 4). Considering the inherent dynamic properties of the scanning and motion systems, the tracking error is weighted and then fed back to the scanner.
《Fig. 4》

Fig. 4. Error synthesis of the synchronized system.
In this module, the error of the synchronized system can be calculated with the angular displacement of the galvanometer scanner θ, the linear displacement of the motion stage x, and the reference signal r. In this process, the angular displacement of the galvanometer scanner is transformed into the linear displacement with respect to the workpiece, according to the parameters of the optical system. The transformed displacement is then added onto the displacement of the motion stage so that the output of the motion composition module (Fig. 4) can be obtained. Furthermore, by comparing the reference signal with the output of the motion composition module, the actual processing error can be calculated in real time. In addition, considering the limited stroke of the galvanometer scanning, a feedback protecting mechanism was developed by introducing the accumulative error (ea):

where  is the processing error without treatment of the protection mechanism and t is the system operating time. The protection mechanism can be expressed as follows: If
  , then the feedback error of the synchronized system
  , or else
  = 0, where elim is the error feedback limit by the FoV of the scanner. With this protection mechanism, damage to the scanner can be avoided by setting the feedback error = 0, allowing the galvanometer scanner motion loop to run independently for safety.
《2.6. Numerical simulation》
2.6. Numerical simulation
A 3D unsteady heat-transfer computational fluid dynamics (CFD) model was developed in ANSYS to numerically analyze the temperature field of the IN718 alloys during different laserpolishing methods. Calculation for the IN718 model was conducted on a rectangular substrate with the dimensions of 3 mm × 3 mm × 0.5 mm; the minimum differential volume element was a cube with the dimensions of 4 μm × 4 μm × 4 μm. In the simulation process, it was assumed that: ① The material was isotropic and homogeneous; ② the flow of the material during melting and solidification was neglected; and ③ the laser beam was characterized by a Gaussian distribution on the top surface of the specimen. The basic heat transfer equation can be expressed as follows [26]:

where x1, y1, and z1 are the spatial variables; and ρ, c, and k1 are the density, specific heat capacity, and thermal conductivity of the material, respectively; and T, q1, and t1 are the temperature, heat generated by heat transfer media per unit volume, and temporal variable, respectively. The temperature of the material under the initial conditions is assumed to be ambient temperature. The laser power remains constant, and its energy distribution is treated as a Gaussian distribution during the laser polishing. The governing equations, boundary conditions, and convergence criteria are set according to Ref. [27]. The governing equation is

where cp, u, and Q are the equivalent heat capacity, velocity vector, and volume source terms, respectively. The boundary condition is set as 1 atm (1 atm = 101 325 Pa) and the ambient temperature is set as 20 °C. The convergence criterion is force convergence.
《2.7. Surface characterization》
2.7. Surface characterization
Surface morphology was observed by optical microscope (OM; LV150N, Nikon, Japan) and scanning electron microscope (SEM; FEI Quanta 450, FEG, USA). 3D topography was measured by a laser-scanning confocal microscope (VK100, Keyence, Japan).
《3. Results and discussion》
3. Results and discussion
《3.1. Precision laser processing without stitching errors》
3.1. Precision laser processing without stitching errors
As shown in Fig. 5(a), a sinusoidal wave pattern in a large area was fabricated on AISI 304 stainless steel by means of both the step-scan method and the proposed synchronized method. As shown in Fig. 5(b), a stitching error with a distance gap of about 84.93 μm occurred, due to the discontinuous motion. Moreover, the laser ablation was very serious at the starting point of the laser processing, while slight thermal damage occurred at the ending point of the laser processing. These mainly occurred because the start and stop movements of the scanner were erratic and the scanner had a delay error at the starting and ending point, which significantly affected the laser-polishing quality. In comparison, the fabrication of a continuous waveform without stitching errors was achieved by the proposed synchronized method, as shown in Figs. 5(c) and (d). The laser-processing trajectory was decomposed to the motions of the stage and the scanner, and the input signals of the stage and scanner were sent by the commander at the same time, preventing stitching errors. The error synthesis module compared the reference signal with the output signal of the scanner and motion stage; next, the actual processing error was calculated and fed back to the scanner and stage, resulting in a more accurate synchronized motion.
《Fig. 5》

Fig. 5. A sinusoidal pattern fabricated by different methods: (a) the step-scan method; (b) a stitching area that occurs when using the step-scan method; (c) the scanner– stage synchronized method; and (d) no stitching area occurs when using the synchronized method.
A triangular wave pattern was then fabricated using the above two methods to compare the quality of the laser-processing boundary. With the step-scan method, serious heat accumulation was observed at the peak produced by the scanner, as shown in Figs. 6(a) and (b). During the processing of the peak portion, the scanner motor went through the processes of acceleration and deceleration, resulting in a decrease in the pulse processing interval. Meanwhile, the laser fluence was kept constant during the laser processing, so more laser energy was deposited within a unit area, leading to serious thermal damage. In contrast, when using the scanner–stage synchronized method, a homogeneous triangular wave was obtained and no serious laser ablation was observed at the peak, as shown in Figs. 6(c) and (d). By design, the stage trajectory of relatively low-frequency dynamics was generated by a low-pass filter and the scanner trajectory was obtained by vector decomposition; thus, the steps between each laser-processing point could be controlled almost constantly due to the continuous fabrication process. Hence, homogeneous laser energy was deposited within a unit area, resulting in a homogeneous processing pattern.
《Fig. 6》
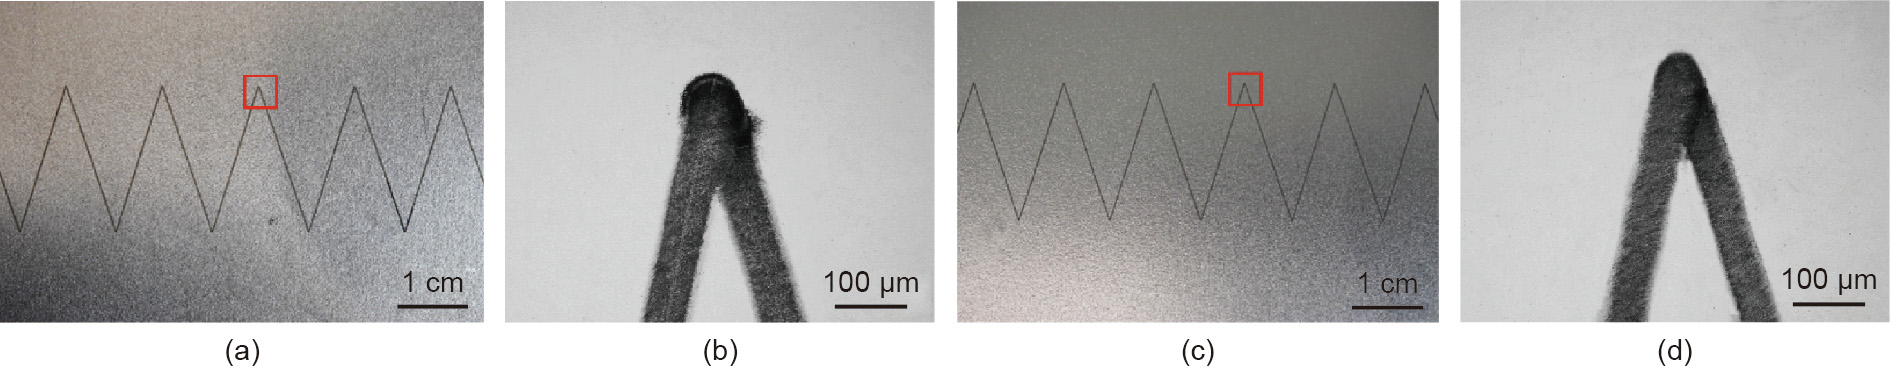
Fig. 6. A triangular wave fabricated by different methods: (a) the step-scan method; (b) the peak of the wave fabricated by the step-scan method; (c) the scanner–stage synchronized method; and (d) the peak of the wave fabricated by the scanner–stage synchronized method.
《3.2. Large-area laser polishing with synchronized motion》
3.2. Large-area laser polishing with synchronized motion
Large-area laser polishing was conducted at the original surface of an IN718 workpiece fabricated by selective laser melting by means of both the step-scan method and scanner–stage synchronized method (Fig. 7). The laser power was 100 W and the scanning speed was 100 mm∙s–1 . The surface roughness  of the IN718 workpiece was measured as 10 μm, and laser polishing by both methods effectively improved the surface finishing. The step-scan method resulted in errors at the stitching boundaries, as shown in Figs. 7(a) and (b). The smoothness of the polished surface by the two methods was similar, as shown in Figs. 7(c) and (d).
《Fig. 7》
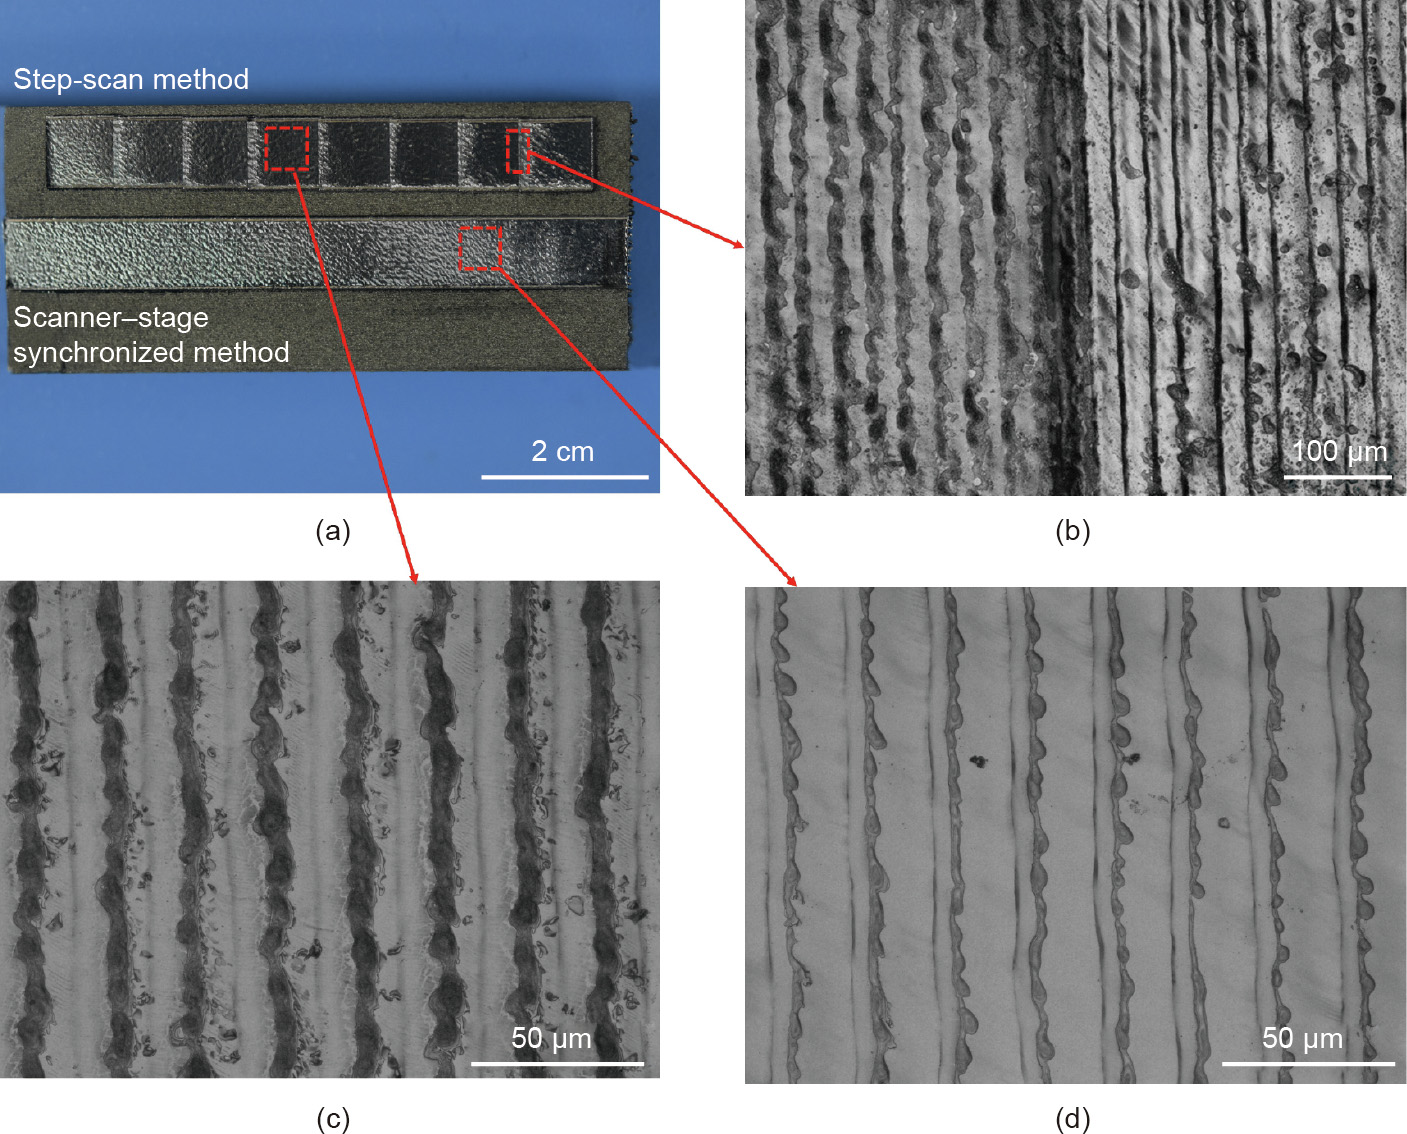
Fig. 7. (a) Laser polishing of an IN718 workpiece fabricated by selective laser melting using different methods; (b) the stitching area of the step-scan method; (c) the laserpolishing surface using the step-scan method; (d) the laser-polishing surface using the scanner–stage synchronized method.
The surface morphology of the surfaces in Figs. 7(b–d) was further investigated by means of SEM and a laser-scanning confocal microscope (Fig. 8). A stitching region with a width of 20 μm can be clearly observed in Figs. 8(a) and (d); this was mainly caused by poor alignment of the scanner boundaries due to the erratic start and stop movements of the stage and the inevitable motion errors of the stage. Hence, laser energy accumulated at the stitching regions, causing excessive heating. In the central comparison of the laser-polished area, Figs. 8(b) and (c) show that the scanner– stage synchronized polishing area was more homogeneous than the polishing area of the step-scan method, which was mainly attributed to stable energy distribution on the irradiated surface. Moreover, it is known that beam overlapping is essential for large-area polishing with good surface finishing. In comparison with the step-scan method, the synchronized method resulted in a significantly smoother surface profile of the beam-overlapping area, as shown in Figs. 8(e) and (f).
《Fig. 8》

Fig. 8. Surface topography of the laser-polishing surface: (a) a stitching area using the step-scan method; (b) the step-scan polishing surface; (c) the scanner–stage synchronized polishing surface; (d) 3D topography of image (a); (e) 3D topography of image (b); and (f) 3D topography of image (c).
Fig. 9 shows a comparison of the simulated temperature distributions at the stitching area using the two polishing methods. It should be noted that the stitching errors were simulated by reducing the distance between the two adjacent laser-scanning trajectories (scanning trajectories 1 and 2 in Figs. 9(a) and (b)). As it was located at both the overlap region of trajectories 1 and 2 (Fig. 9(a)) and the stitching error region of trajectory 2 (Fig. 9(b)) at the edge of the workpiece, point A was irradiated by the laser multiple times due to the stitching error. Hence, the temperature of point A was chosen to further analyze the effect of the stitching error on laser polishing.
It can be seen that a sharp thermal gradient occurred at the polished layer in Figs. 9(c) and (d) at the time when point A reached its maximum temperature; the peak temperatures of the molten pools are approximately 2002 and 2141 °C, respectively. Both are higher than the melting temperature, which is 1260 °C, yet lower than the boiling temperature of 2600 °C [28]. With the resulting molten pool, part of the molten peak flows into the basin, driven by the inhomogeneous temperature or concentration distribution [29]. In the scanned area, the thermally driven Marangoni flow leads to liquid surface deformation, and the molten material redistributes due to surface tension and gravity [30]. As a result, the surface roughness is reduced and a smooth surface is realized.
《Fig. 9》
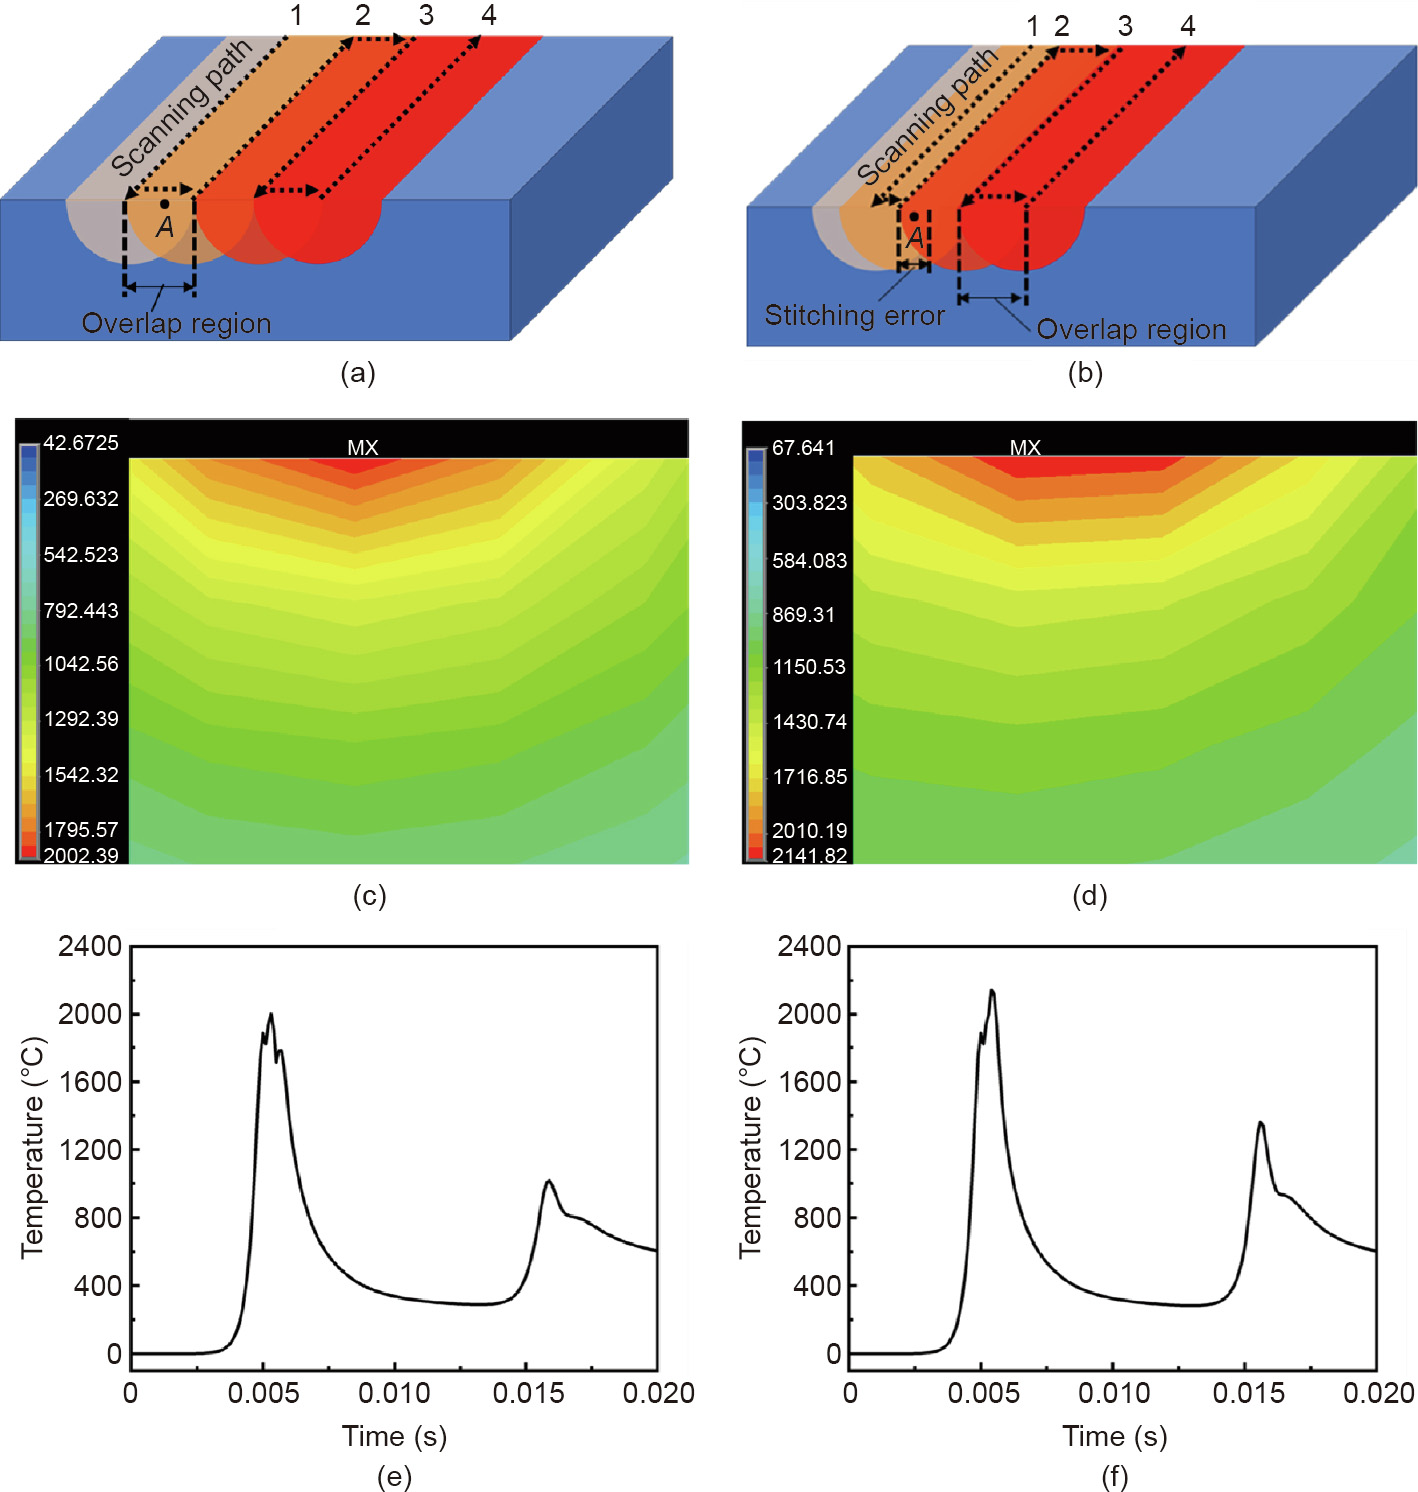
Fig. 9. Comparison of temperature distribution at the stitching region: (a) schematic of the laser-scanning path of the synchronized method; (b) schematic of the laser-scanning path of the step-scan method; (c) temperature distribution of the cross-section in image (a); (d) temperature distribution of cross-section in image (b); (e) temperature of point A in image (a); and (f) temperature of point A in image (b). The color legends in (c) and (d) stand for temperature (°C).
The temperature cycle of point A for both methods is shown in Figs. 9(e) and (f). It can be seen that only one peak temperature (2002 °C) exceeded the melting temperature when using the synchronized method, whereas two peak temperatures (2141 and 1360 °C) exceeded the melting temperature when using the stepscan method. Therefore, the stitching region was melted twice during the laser-polishing process when using the step-scan method. This occurred mainly because the inevitable motion errors of the stage lead to greater laser energy accumulation at the stitching area when using the step-scan method. During laser polishing, due to the radially outward Marangoni flow, the liquid surface at the center of the laser beam was depressed and ridges formed at the edge of the liquid surface [26]. Therefore, more ridges formed at the stitching area when using the step-scan method, resulting in an inhomogeneous polishing surface, as shown in Figs. 8(a) and (d).
Fig. 10 shows the surface topography of the laser-polishing boundary using the two methods. Figs. 10(a) and (c) show that a micro-groove occurs between the original surface and the laserpolished area at the stitching boundary when using the step-scan method. This is mainly caused by the accumulated laser energy at the boundary during large-area processing. When using the synchronized method, a homogeneous laser-polishing boundary was obtained, as shown in Figs. 10(b) and (d). In this fabrication result, the synchronized fabrication method leverages the advantages of both the motion stage and the scanner to achieve smooth trajectories and constant feed rates. Hence, homogeneous laser energy was obtained, resulting in a homogeneous laser-polishing boundary. This was mainly attributed to the synchronized motion of the scanner and stage, which resulted in a more stable distribution of laser energy within a unit area, as illustrated in Section 3.1.
《Fig. 10》

Fig. 10. Surface topography of the boundary of the polishing area using different methods: (a) the step-scan method; (b) the scanner–stage synchronized method; (c) 3D topography of image (a); and (d) 3D topography of image (b).
For these two methods, the average surface roughness and polishing time for a polishing area of 541.12 mm2 are summarized in Table 1. The  of the surface that was laser polished by the synchronized method was reduced by 28.07% in comparison with that of the step-scan method. The total laser-polishing time using the step-scan method (tscanner) can be estimated by the following formula:

《Table 1》
Table 1 Surface roughness of different areas and polishing time for different laser-polishing methods.

For the scanner–stage synchronized method, the total laserpolishing time (tscanner–stage) can be estimated by the following formula, without stitching errors:

where n, tmov, and tpolish are the stitching times, the time it takes for the stage to reach a specified position and stop, and the polishing time, respectively. In this case, n = 8, tmov = 3.71 s, and tpolish = 38.27 s. Hence, the total laser-polishing times by the step-scan method and the scanner–stage synchronized method were 67.95 and 41.98 s, respectively, which shows that the polishing efficiency was improved by 38.22% with the scanner–stage synchronized system. This improvement in efficiency is mainly due to the continuous motion of the stage. More specifically, in this continuous large-area polishing process, the additional time required for the deceleration and acceleration of both the scanner and stage was significantly reduced due to the synchronized motion of the scanner and stage.
《4. Conclusions》
4. Conclusions
A novel synchronized control structure with an error synthesis module was developed and successfully implemented for the large-area laser precision polishing of an additive manufactured metallic surface. The experimental results showed that the proposed scanner–stage synchronized method achieves stitchingfree laser precision polishing due to its continuous motion. The polishing efficiency was improved by 38.22% in comparison with the conventional step-scan method. The proposed scanner–stage synchronized method is capable of generating homogeneous laser energy distribution, which is crucial for high-quality laser polishing. The surface quality of the synchronized laser-polished area was significantly enhanced due to a lack of stitching areas and the homogeneous distribution of laser energy.
《Acknowledgments》
Acknowledgments
The authors would like to acknowledge support from the National Natural Science Foundation of China (51875313 and 51705013) and the Open Foundation of the State Key Laboratory of Tribology & Institute of Manufacturing Engineering (SKLT2019C09).
《Compliance with ethics guidelines》
Compliance with ethics guidelines
Mengjia Cui, Libin Lu, Zhen Zhang, and Yingchun Guan declare that they have no conflict of interest or financial conflicts to disclose.


 京公网安备 11010502051620号


