
《1. Introduction》
1. Introduction
Hay fever is a seasonal allergic rhinitis (AR) that primarily affects the upper respiratory system. It is caused by the inhalation of plant pollens and only occurs in a particular group of individuals [1]. Allergic reactions to both anemophilous and entomophilous pollens have been reported, and the manifestations vary in symptoms and severity depending on the specific health condition of the individual [2,3]. To date, more than 150 pollen allergens originating from grasses, weeds, and trees have been recognized worldwide [4]. The major sensitizing pollens in North America and Europe are those from Ambrosia and Gramineae, respectively. In China, especially in the northern part, Artemisia and Humulus pollens are the key contributors to autumnal hay fever [5,6].
The mainstream doctrine on hay fever pathology primarily focuses on an imbalanced immune system. Wambre et al. [7] first discovered a subset of type 2 helper T cells, named TH2A, which are the specific cells implicated in the pathogenesis of allergic diseases. Although studies on the immune components of allergic disorders have been conducted for more than two decades, there is still no effective strategy to reverse this allergy epidemic [8,9]. Researchers have begun to realize that allergies might not be simply characterized as immune system disorders. This is because genomewide association analysis allows the identification of dozens of loci associated with hay fever [10,11]. However, abnormal genes do not necessarily lead to phenotypic changes, thus reducing their ability to predict diseases. Other studies have revealed that lung epithelium defects are associated with a risk of hay fever [9]. However, to date, there is no comprehensive theory that can explain the pathological process of hay fever. Hence, a deeper understanding of disease onset mechanisms may contribute to improved disease monitoring and novel medication strategies [12,13].
Mammals harbor 10 trillion–100 trillion symbiotic bacteria, known as the microbiome [14]. This complex consortium of flora possesses hundreds of times the number of genes encoded in the human genome, resulting in a wide range of metabolic activities [15]. However, defining the functional status of host-associated gut microbiota is challenging because of the vast number of bacteria and relatively poor understanding of host–microbiota interactions [16]. The emergence of omics technologies, especially metabolomics, has opened up a new scenario for the study of intestinal bacterial function [17]. Metabolomics is the analysis of complete low-molecular-weight metabolites, namely metabolomes, under a given set of conditions in a living system [18]. In essence, the metabolome represents the overall physiological status in real time, which reflects the interaction of both genomic modification and environmental stimuli to a living system [19].
Gut microbiota dysbiosis has been implicated in the pathogenesis of immune-mediated disorders, such as allergic diseases. For example, children whose milk allergy has resolved show enrichment of Clostridia and Firmicutes compared to those whose milk allergy persists [17]. In this pilot study, we combined untargeted metabolomic profiling and microbiota diversity analysis in a rat model to better define internal changes associated with hay fever. This study aimed to identify both metabolites and intestinal bacteria that correlate with the presence of hay fever and to gain insight into the underlying pathophysiological mechanisms involved in hay fever.
《2. Materials and methods》
2. Materials and methods
《2.1. Chemical reagents》
2.1. Chemical reagents
High performance liquid chromatography (HPLC)-grade acetonitrile and methanol were purchased from Thermo Fisher Scientific Co., Ltd. (China). Ultrapure water was obtained from Hangzhou Wahaha Group Co. Ltd., (China). Chromatographic grade acetone was purchased from Sinopharm Chemical Reagent Co., Ltd. (China). N,O-Bis(trimethylsilyl)trifluoroacetamide with 1% trimethylchlorosilane, O-methoxyamine-hydrochloric acid, succinic-d4 acid, propionic acid, and butyric acid (99.9%) were purchased from Sigma-Aldrich (USA). Acetic acid (100%) was purchased from Merck (Germany). Sodium chloride, sodium bicarbonate and AL(OH)3 were obtained from Solarbio® Life Sciences (China). Phenol was purchased from Aladdin® (China).
《2.2. Animal experiments》
2.2. Animal experiments
Male Sprague-Dawley (SD) rats (weighing approximately 200 g) were purchased from the Institute of Laboratory Animal Science, Chinese Academy of Medical Sciences (China). The animals were housed in a controlled room with a regular 12-hour light–dark cycle and were allowed standard laboratory rodent chow and water ad libitum. All procedures were approved by the Animal Ethics Committee of the Experimental Animal Institute of the Chinese Academy of Medical Sciences and Peking Union Medical College and conducted in agreement with institutional guidelines and ethics.
The pollen of Artemisia was dissolved in Coca’s solution (5.00 g sodium chloride, 2.75 g sodium bicarbonate, and 4.00 g phenol in 1000 mL of ultrapure water) at a final concentration of 1 mg·mL–1 . The pollen extract was then mixed with Al(OH)3 at a 1:1 (v/v) ratio. The rats were randomly divided into control (n = 8) and model (n = 8) groups. After six days of adaptation, 1 mL of pollen-adjuvant mixture or saline-adjuvant mixture was administered to the animals on Days 7, 13, and 19 via intraperitoneal (i.p.) injection. Following sensitization, the animals received nasal applications of 20 μL (10 μL into each nostril) of either saline or pollen extract from Days 20 to 25. Plasma, urine, fecal, and intestinal samples were collected at the end of the experiments. The design of the experiment is shown in Fig. 1(a).
《Fig. 1》

Fig. 1. Animal model establishment and evaluation. (a) Experimental design of the study; (b) serum-specific immunoglobulin E (IgE) level; (c) density of granulocytes in the nasal mucosa. Data represent mean ± standard deviation (SD) of eight rats in each group. ***p < 0.001, using Mann–Whitney test.
《2.3. Model evaluation》
2.3. Model evaluation
Levels of pollen-specific immunoglobulin E (IgE) were determined using an enzyme-linked immunosorbent assay (ELISA). When using the ELISA kit, the manufacturer’s protocol was strictly followed (BioTSZ, USA). Tissue specimens of the nasal cavity were fixed in 4% paraformaldehyde solution and then immersed in ethylene diamine tetraacetic acid (EDTA) solution for decalcification for two weeks, with a change of fresh solution in between. Hematoxylin and eosin staining was used to stain the tissues.
《2.4. Metabolomics analysis》
2.4. Metabolomics analysis
Plasma, urine, fecal, and intestinal samples were immediately stored at –80 °C until analysis. For plasma and fecal metabolomics analysis, a Shimadzu (Japan) GC-2010 Plus gas chromatography system coupled to a GCMS-QP2020 single quadruple mass spectrometer was used. Both the sample treatment and gas chromatography–mass spectrometry (GC–MS) analysis followed an established protocol summarized in the supplementary methods.
《2.5. Measurement of markers of gut barrier functions》
2.5. Measurement of markers of gut barrier functions
Urine claudin-3, and liver- and intestinal-fatty acid binding protein (L-FABP and I-FABP) levels were measured using ELISA (urine claudin-3 (cat. KL-CLDN3-Ra; Shanghai Kanglang Biotech Co., Ltd., China); L-FABP (cat. ARB12324; Beijing BioRab Technology Co., Ltd., China); and I-FABP (cat. ARB14534; Beijing BioRab Technology Co., Ltd.)).
《2.6. Real-time quantitative polymerase chain reaction assessment of claudin-3 and L-FABP expression》
2.6. Real-time quantitative polymerase chain reaction assessment of claudin-3 and L-FABP expression
Real-time quantitative polymerase chain reaction (RT-qPCR) was used to examine the expression of claudin-3 and L-FABP in the intestine. Total RNA was isolated with NucleoZOL reagent (Machery-Nagel, Germany) at a ratio of 100 mg of tissue per 1 mL NucleoZOL, and reverse transcription into complementary DNA (cDNA) was performed using the QuantScript RT kit (TIANGEN, China). The resulting cDNA was used as a template. The RT-qPCR primers were obtained from published references and are shown in Table 1 [20,21]. Glyceraldehyde-3-phosphate dehydrogenase (GAPDH) was used as an internal reference. RT-qPCR was performed using an ABI 7500 real-time polymerase chain reaction (PCR) system (Applied Biosystems, USA). Reaction conditions were as follows: pre-denaturation at 95 °C for 30 s, followed by 40 cycles of melting (95 °C, 10 s) and annealing/ extension (60 °C for 30 s). PCR reactions for each template were performed in triplicates in 96-well plates. The cycle threshold (Ct) value was used to compare the gene expression levels between the control and model groups.
《Table 1》
Table 1 Sequences of primers used in this study.
《2.7. Microbial diversity analysis》
2.7. Microbial diversity analysis
Microbial DNA from fecal samples was isolated using the E.Z.N. A.® soil DNA kit (Omega Bio-tek, USA) according to the manufacturer’s instructions. The V3–V4 region of the bacterial 16S ribosomal RNA (rRNA) gene was amplified with primer pairs 338F (5' - ACTCCTACGGGAGGCAGCAG-3' ) and 806R (5' -GGACTACHVG GGTWTCTAAT-3' ). The PCR product was then extracted from a 2% agarose gel and purified using the AxyPrep DNA Gel Extraction kit (Axygen Biosciences, USA). The purified amplicons were then subjected to Illumina MiSeq sequencing analysis.
《2.8. Targeted analysis of short-chain fatty acids in fecal samples》
2.8. Targeted analysis of short-chain fatty acids in fecal samples
The procedure was adapted from a previously published protocol [22]. Stock solutions of the selected short-chain fatty acids (SCFAs) were dissolved in acetone at a concentration of 50 μg·mL–1 for acetic acid and 2 μg·mL–1 for propionic and butyric acids. Calibration curves (at concentrations of 50, 100, 250, 500, 1000, 2500, 5000, 12 500, 25 000, and 50 000 ng·mL–1 for acetic acid; 2, 4, 10, 20, 40, 100, 200, 500, 1000, and 2000 ng·mL–1 for propionic and butyric acids, respectively) for the quantification of SCFAs were prepared by mixing the three SCFA standards together. Each fecal sample was weighed and soaked in 8-fold (g·mL–1 ) acetone for 3 h at room temperature (20–25 °C). Samples were vortexed until the mixture was uniform before centrifugation at 2450 revolutions per minute (rpm) for 5 min at 4 °C. The supernatant was collected for gas chromatography (GC) analysis. A gas chromatograph (GC2014; Shimadzu Cooperation) equipped with a flame ionization detector was used to separate SCFAs, and the parameters were obtained from the literature [22].
《2.9. Statistical analyses》
2.9. Statistical analyses
The GC–MS data obtained were processed (peak picking and alignment) within the ‘‘XCMS” package in R Studio. After being normalized separately in R, features with relative standard deviation < 30% in quality control (QC) samples and present in 70% of the samples were included for subsequent multivariate analysis. Following log-transformation and pareto-scaling, data were subjected to orthogonal partial least squares-discriminant analysis (OPLS-DA). An S-plot derived from this OPLS-DA model was then applied to select features based on covariance P[1] and correlation Pcorr values (P[1] > 0.05, Pcorr > 0.8, or P[1] < –0.05, Pcorr < –0.6). All multivariate analyses were conducted using SIMCA version 14 (MKS Umetrics AB, Sweden) [23]. The most differentially expressed features selected were semi-quantified in the raw data. Feature levels were expressed as ratios of peak areas to the peak areas of the internal standards. Identification was performed by comparing the fragmentation patterns of the metabolites detected with the spectra from the National Institute of Standards and Technology (NIST). To compare the control and model groups, the levels of metabolic features or bacterial strains identified were examined using a univariate non-parametric Mann–Whitney test (2-sided).
To investigate the association of each metabolite and bacterial strains with hay fever biological variables, Spearman’s correlation was applied. Microbial diversity analysis was performed using the free online Majorbio cloud platform (Shanghai Majorbio BioPharm Technology Co., Ltd., China).
《3. Results》
3. Results
《3.1. Hay fever characteristics in SD rats》
3.1. Hay fever characteristics in SD rats
At the challenge stage (from Days 20 to 25), marked pollen antigen-induced nasal symptoms were observed in the model group. The rats started sneezing and scratching their noses shortly after being challenged with the pollen extract. To further confirm the development of hay fever, serum-specific IgE levels were measured after the rats were euthanized. As expected, the rats in the model group showed a significant increase in IgE levels at the end of the challenge period (increased by approximately 1.5-fold, p < 0.001), demonstrating the success of the model established. Moreover, at the end of the challenge period, the density of granulocytes in the nasal mucosa of the model group was also higher than that in the control group (Figs. 1(b) and (c), and Fig. S1 in Appendix A).
《3.2. Alterations in the plasma metabolic profile of rats with hay fever》
3.2. Alterations in the plasma metabolic profile of rats with hay fever
After confirming the utility of this model, we used metabolomics analysis of plasma samples to gain insight into any metabolic deviation associated with hay fever. A clear difference in plasma metabolic profiles between control and model groups was detected, as evidenced by the OPLS-DA model, indicating a biochemical alteration (Fig. 2(a)).
To identify which metabolic feature was the strongest discriminator between the control and model groups, the corresponding correlation S-plot (Fig. 2(b)) was used to generate a list of features of interest on the criteria stated in the Section 2. Fourteen features that contributed to the group discrimination were selected. After the raw data and NIST library were checked, 12 were putatively annotated with similarity indices over 85, namely valine, cholesterol, citrate, threonine, urea, isoleucine, aspartate, leucine, glutamate, glutamine, indole-propionate (IPA), and myo-inositol. Then, the peak areas of selected features were measured in the raw data (normalized to the internal standard) for univariate analysis. Cholesterol, citrate, threonine, and urea were excluded from the analysis because the differences were not statistically significant. The branched-chain amino acid leucine did not show a substantial alteration in the model group. Valine and isoleucine were both reduced greatly in the model group with fold changes of 0.57 and 0.52, respectively; hence, we did not exclude leucine. Plasma levels of aspartate, glutamate, glutamine, IPA, and myo-inositol declined in the model group (p < 0.05; Fig. 2(c)). Of these, IPA is a gut microbial-derived metabolite that is reduced by a factor of 1, as illustrated in Fig. 2(c).
《Fig. 2》

Fig. 2. Metabolic profiling of plasma samples from control and model rats. (a) OPLSDA model showing the group separation. (b) Corresponding S-plot for feature selection. Each dot represents for a feature and the dots in red are the selected ones based on criteria stated in the Section 2. (c) Violin plot showing metabolic feature levels between control and model groups. Data represent mean ± SD of eight rats in each group. *p < 0.05, **p < 0.01 using Mann–Whitney test. NS: no statistical significance.
《3.3. Ecological diversity of the fecal microbiota》
3.3. Ecological diversity of the fecal microbiota
As gut dysbiosis has been implicated in allergic diseases and changes in gut-derived metabolites have been observed in our study, the fecal microbiome composition was analyzed to explore compositional differences, and the extent to which the altered microbiome in the model group was associated with the circulating metabolites in the host.
Fecal samples were treated for 16S rRNA sequencing as explained above. A total of 998 342 reads were analyzed and clustered into 835 operational taxonomic units (OTUs). Model rats showed pronounced microbial alterations compared with those of control rats, as evidenced by the OPLS-DA of the OTUs observed (Fig. 3(a)).
To examine the specific changes in microbiota in pollen-allergic rats, we assessed the relative abundance of taxa between the model and control groups at different levels. Among the phyla identified in the fecal samples of rats, Verrucomicrobia only existed in the model group. Firmicutes and Bacteroidetes were the predominant phyla, and the ratio of Firmicutes to Bacteroidetes in the model group was lower than that in the control group, which was 0.67, indicating a lower abundance of organisms from the phylum Firmicutes (Fig. 3(b)). At the family level, the relative abundance of Ruminococcaceae and Lachnospiraceae decreased, whereas that of Prevotellaceae and Akkermansiaceae increased in the model group (Fig. 3(c)).
《Fig. 3》

Fig. 3. Microbiota diversity analysis at different levels. (a) OPLS-DA score plot; (b) community analysis based on the phylum level; (c) community analysis based on the family level; (d) heat map showing top 45 genera.
At the genus level, a significant shift was also observed between the model and control groups, with the model group containing fewer bacterial strains (Fig. 3(d)). The rats presented a significant reduction or disappearance in the relative abundance of several beneficial genera belonging to Ruminococcaceae, Lachnospiraceae (Blautia), and Clostridiales (Romboutsia, Clostridium), which may generate SCFAs. The proportions of Ruminococcaceae_UCG-005 decreased from 10% to 3%, Ruminococcaceae_UCG-009 decreased from 0.075% to 0.025%, and Ruminococcaceae_NK4A214_group decreased from 1.1% to 0.03%. In the Lachnospiraceae family, the relative abundance of Lachnospiraceae_FCS020_group and Blautia decreased from 0.05% and 2% to 0.02% and 0.1%, respectively. Unclassified_o_Clostridiales and Romboutsia decreased with the fold change of 0.85 and 0.74 (p < 0.05, Fig. 4). Clostridium_sensu_stricto_1 almost disappeared in the model group. Interestingly, Akkermansia, Prevotellaceae_Ga6A1_group, and Helicobacter were only detected in the model group, but not in the control group (Fig. 4). Apart from these differences, the level of taxa Eubacterium_nodatum_group was also enriched in the control group, which was 4-fold more abundant than the model group.
《Fig. 4》

Fig. 4. Univariate analysis of perturbed bacterial strains. Data represent mean ± SD of six rats in each group. *p < 0.05, **p < 0.01 using Mann–Whitney test. ND: not detected.
《3.4. Changes in SCFAs and integrity of epithelial cells》
3.4. Changes in SCFAs and integrity of epithelial cells
To support the findings of the reduced SCFA-generating microbiomes, we determined the fecal levels of three primary SCFAs (acetate, propionate, and butyrate). We also checked monosaccharides detected by fecal metabolomics, which are known to undergo bacterial fermentation to produce these SCFAs. The fecal concentrations of SCFAs and monosaccharides were substantially different. As illustrated in Figs. 5(a) and (b), acetate, propionate, and butyrate levels were significantly reduced. Accordingly, the two monosaccharides determined accumulated in the model group. This analysis demonstrated a partial reduction in the fermentation efficiency because of gut dysbiosis in the model group, which corroborated the difference in the abundance of SCFA-generating microbiomes between control and model rats.
As previous studies have suggested the role of SCFAs and other perturbed metabolites detected in our study in maintaining the epithelial barrier, we evaluated intestinal integrity. L-FABP and IFABP are biomarkers of the integrity of epithelial cells, and claudin-3 belongs to the group of tight junction proteins; therefore, we first measured them at the protein level. Results showed that urine claudin-3 and L-FABP levels were lower in the model group, whereas there was no detectable change in I-FABP levels (Fig. 5(c)). Claudin-3 and L-FABP decreased by 1.22- and 1.97-folds, respectively. We then investigated the amount of intestinal claudin-3 and L-FABP at the transcriptional level. Their expression was downregulated in the model group as expected, and the extent of reduction at the transcriptional level was even higher than the protein level, with 3.29-fold for claudin-3 and 1029.76-fold for L-FABP (Fig. 5(d)). These observations suggest that the gut integrity is damaged.
《Fig. 5》
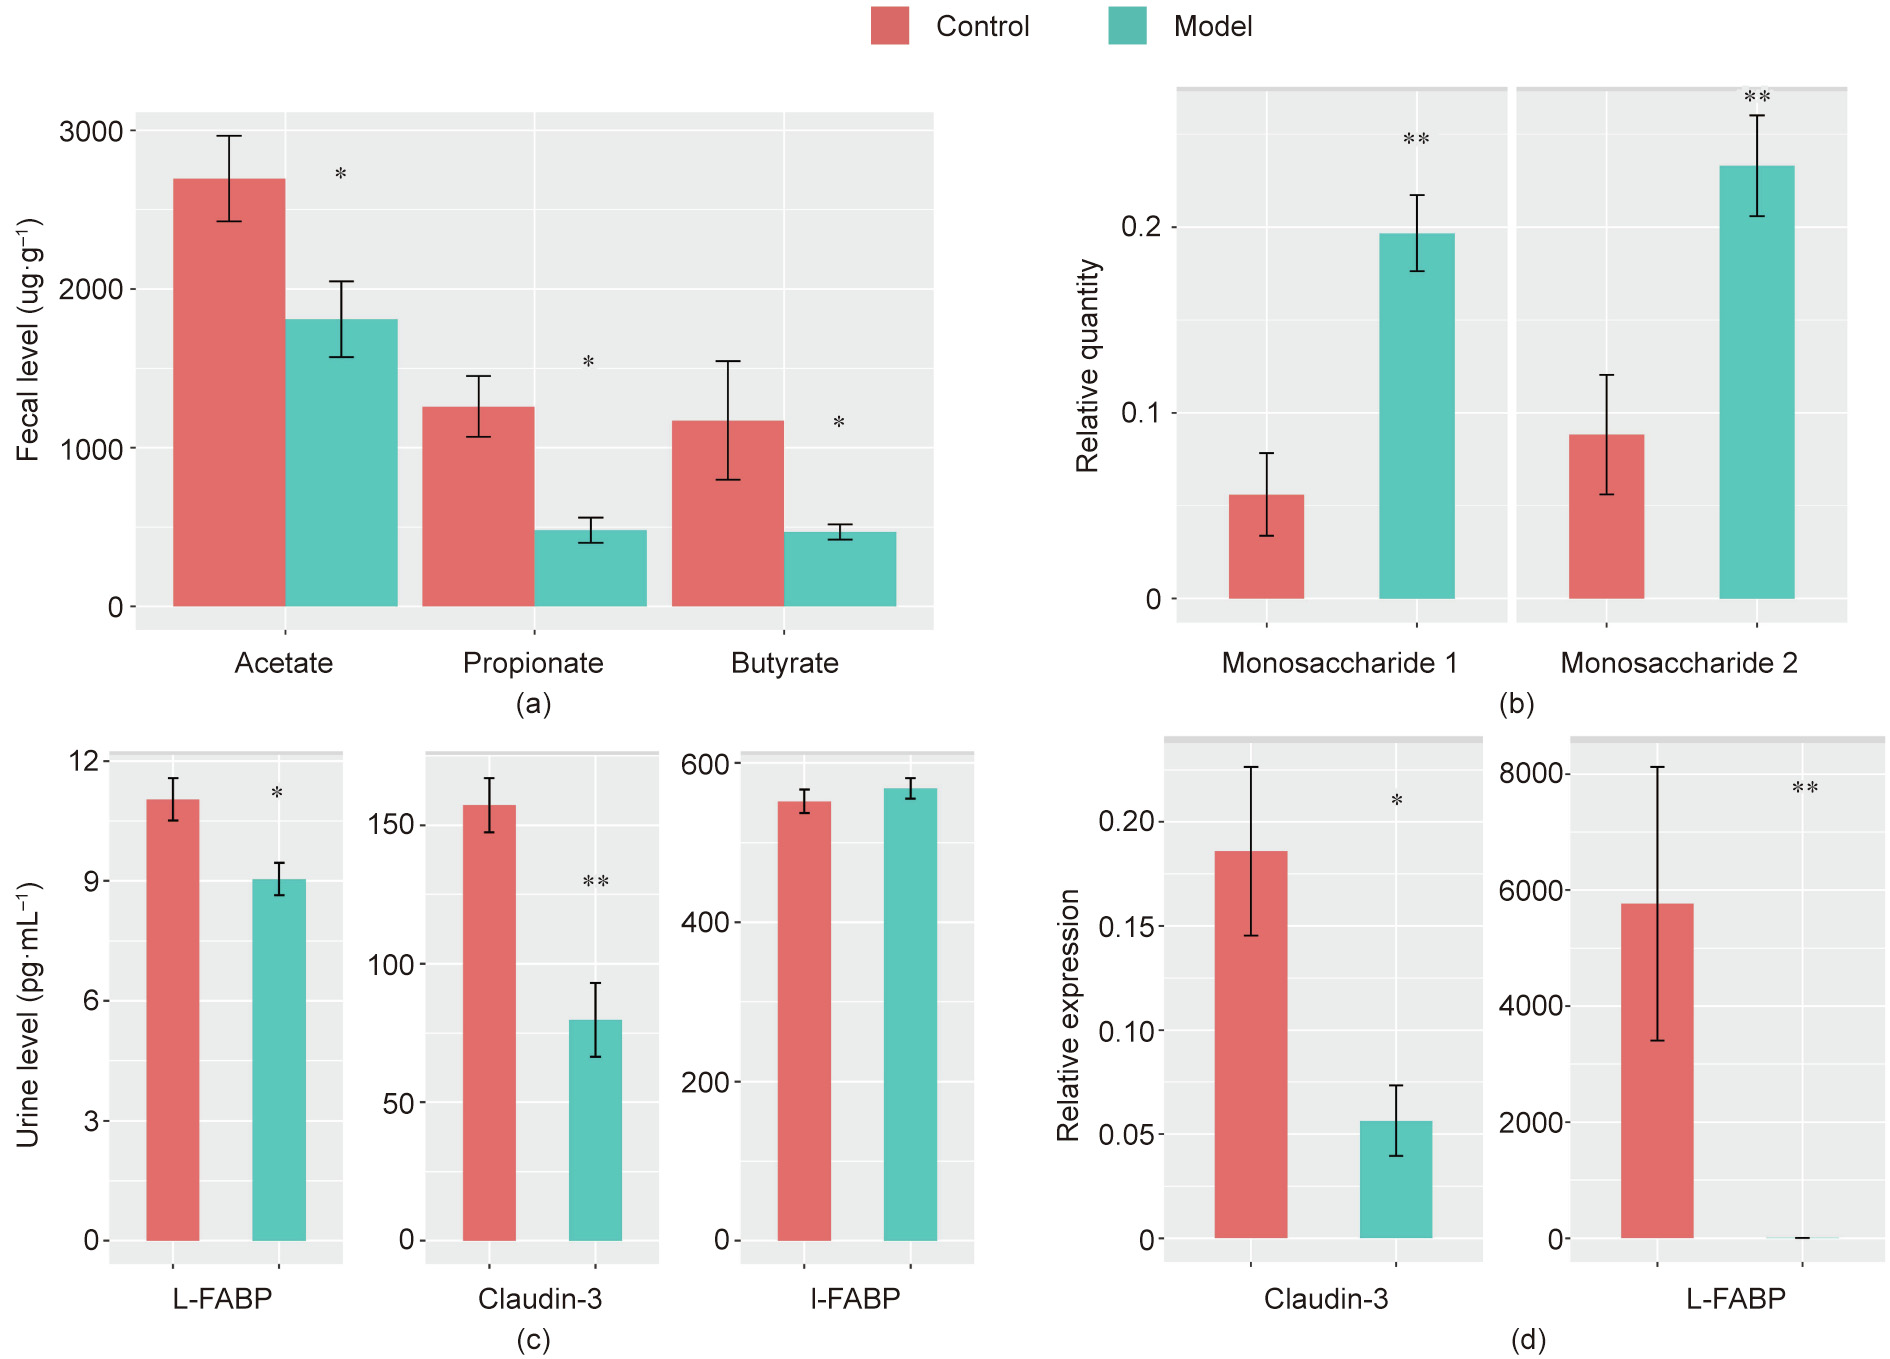
Fig. 5. Measurement of (a) fecal SCFAs, (b) fecal monosaccharides, (c) L-FABP, claudin-3, L-FABP, and I-FABP at the protein level, and (d) claudin-3 and L-FABP at the transcription level. *p < 0.05, **p < 0.01 using Mann–Whitney test.
《3.5. Metabolic profile, gut microbiome, and biological measurement》
3.5. Metabolic profile, gut microbiome, and biological measurement
To identify whether there was any correlation between relative quantities of metabolites, relative abundance of intestinal bacteria, and biological measurements, we calculated Spearman’s correlation coefficients. Three bacterial strains showed a significant correlation with serum IgE levels, namely Helicobacter, Eubacterium_nodatum_group, and Clostridium_sensu_stricto_1. Among the three bacterial strains, Helicobacter exhibited a strong association with almost all plasma metabolites. Although no association between Lachnospiraceae_FCS020_group and serum IgE was detected, it was positively correlated with isoleucine, IPA, and myo-inositol. As for metabolites, only IPA and serum IgE were negatively linked (Fig. 6).
《Fig. 6》
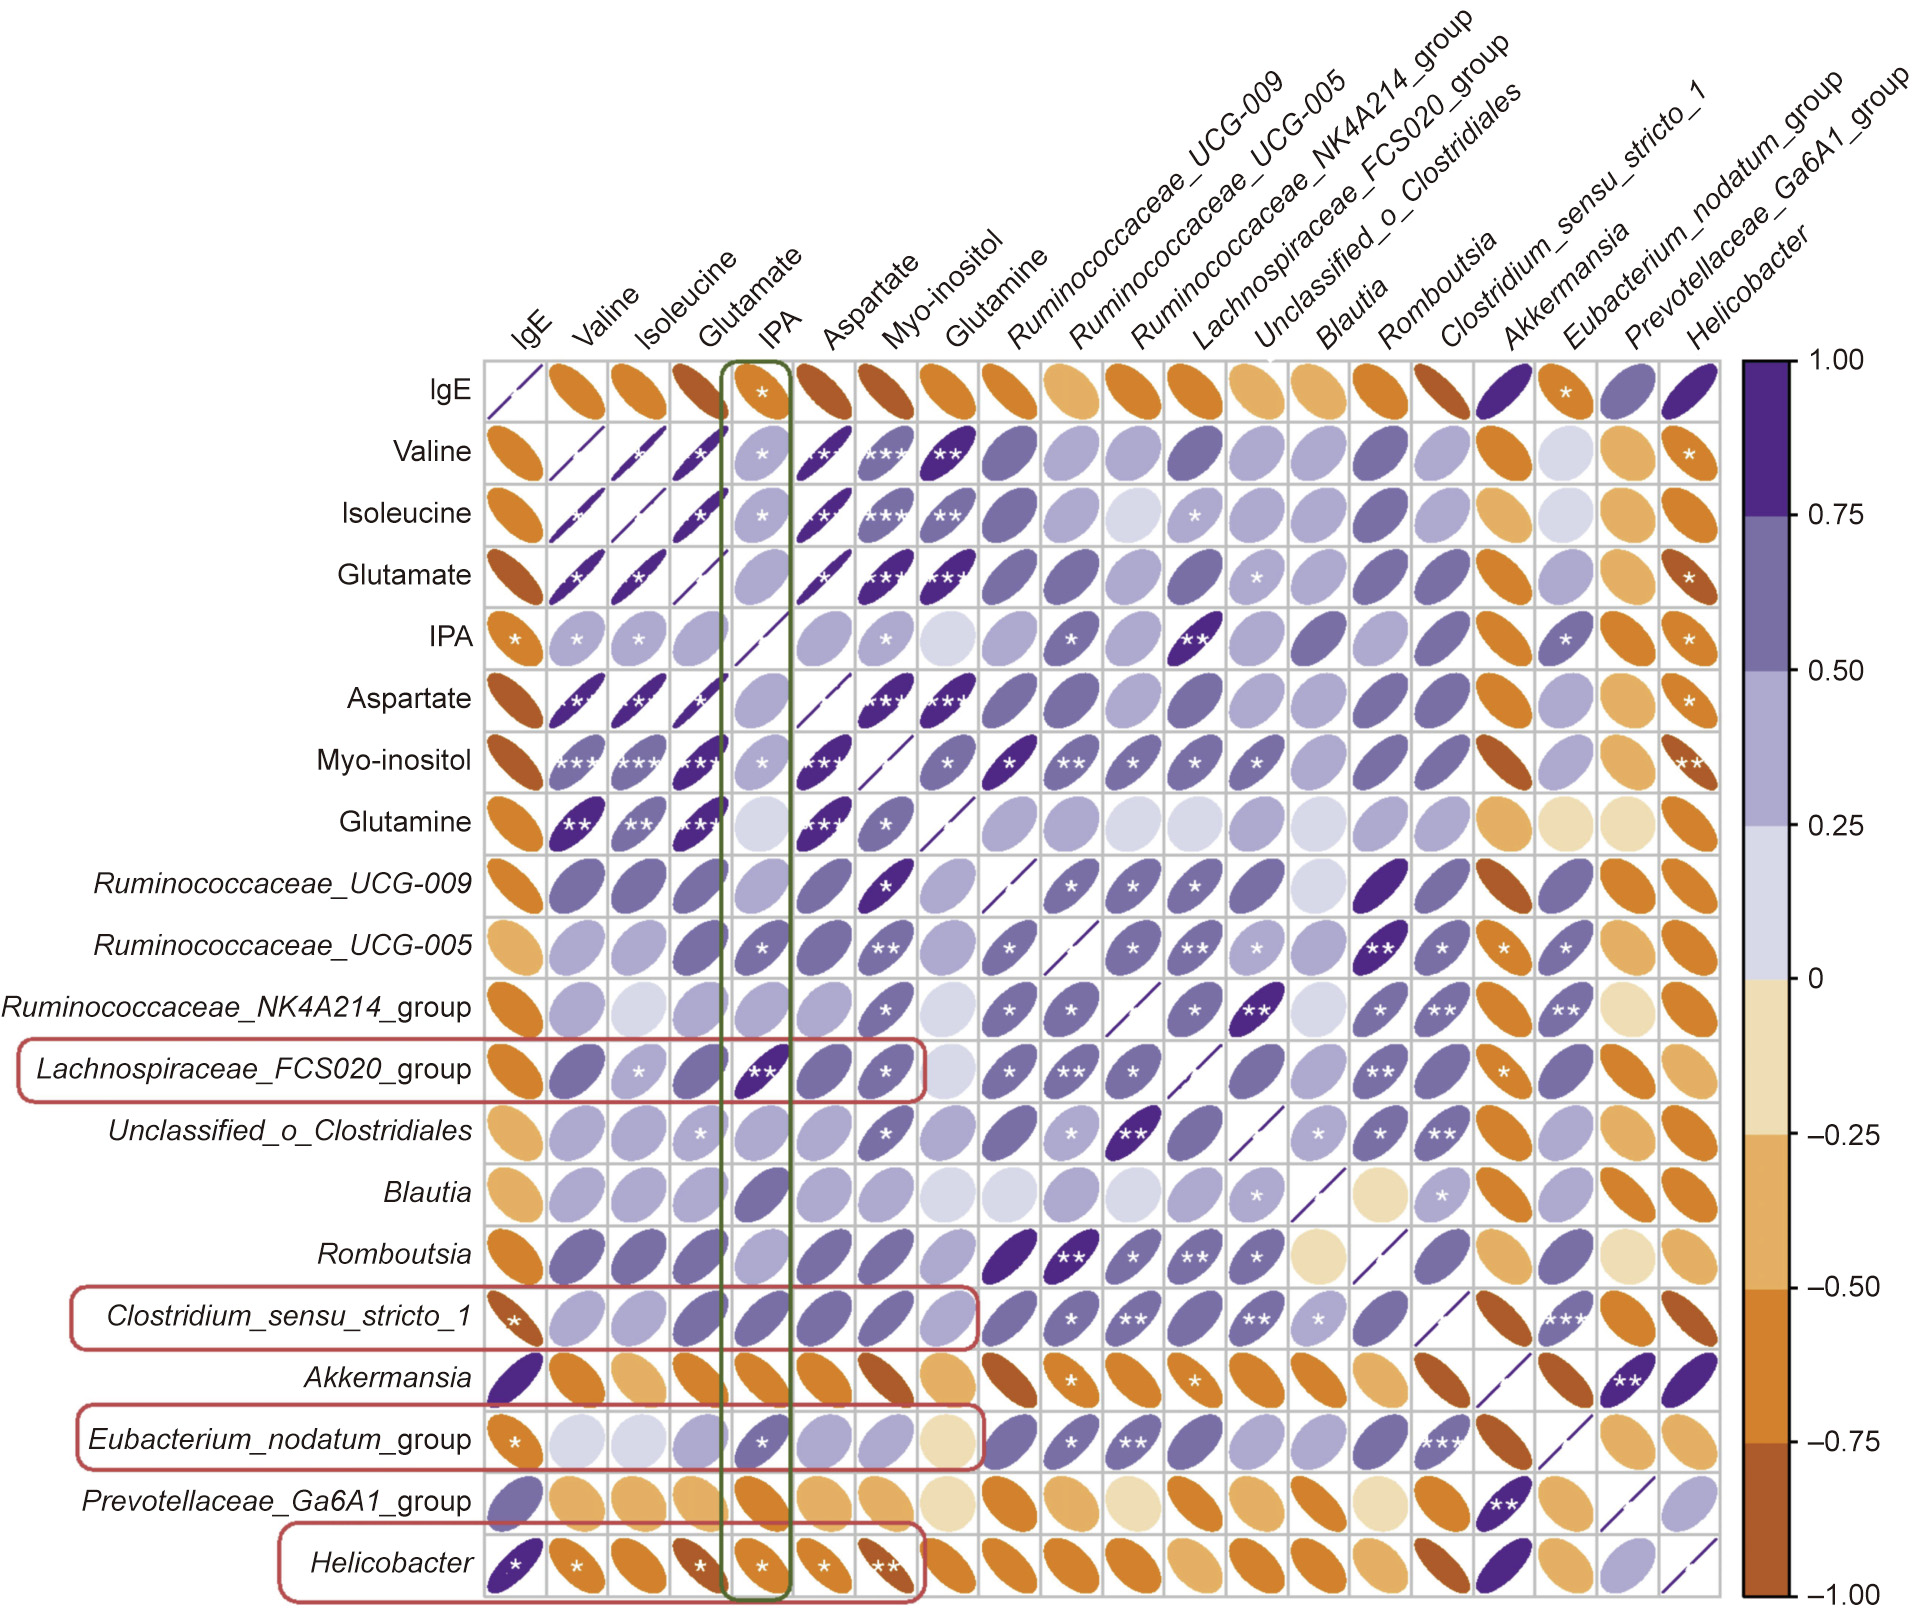
Fig. 6. Correlation analysis between plasma metabolites, IgE level, and gut bacterial strains.
Claudin-3 was negatively correlated with serum IgE levels (r = –0.77, p = 0.013, Fig. 7(a)) and positively correlated with valine, glutamate, IPA, aspartate, and myo-inositol (Fig. 7(b)). It is noteworthy that there was a strong association between claudin3 and Helicobacter, and Helicobacter was the only genus that correlated significantly with claudin-3 (r = –0.79, p = 0.009, Fig. 7(c)). LFABP was positively correlated with Blautia and negatively correlated with Akkermansia and Prevotellaceae_Ga6A1_group. There was no association between L-FABP levels and serum IgE or plasma metabolite levels.
《Fig. 7》

Fig. 7. Correlation analysis between (a) claudin-3 and IgE level, (b) claudin-3 and plasma metabolites, (c) claudin-3 and Helicobacter, and (d) L-FABP and gut bacterial strains.
《4. Discussion》
4. Discussion
Among the seven downregulated amino acids or their derivatives, the branched-chain amino acids (BCAAs) valine, leucine, and isoleucine are essential and cannot be synthesized by humans and therefore, originate from ingested food or gut microbial synthesis. Since both rats from the control and model groups received the same chow, the declining trend of BCAAs is likely attributed to abnormal protein fermentation by the gut microbiota resulting from pollen sensitization. We then compared the data with the results obtained from patients with AR due to spring pollen. All the BCAAs demonstrated a similar reduction trend at the seizure stage with leucine reducing significantly by 1.14-fold [24]. IPA is a bacterial-derived metabolite of tryptophan [25]. Tryptophan is also an essential amino acid. Similar to BCAAs, the different levels of IPA might also be the result of altered metabolic ability of intestinal microbes. These changes were corroborated by the dysbiosis of gut microbiota detected through 16S rRNA sequencing, with isoleucine positively correlated with the Lachnospiraceae_FCS020_group, whereas valine was inversely associated with Helicobacter. Some bacterial strains have been reported to produce IPA. In our case, we did not find the reported bacterial strains; instead, we discovered that IPA was strongly correlated with the relative abundance of Ruminococcaceae_UCG-005, Helicobacter, Lachnospiraceae_FCS020_group, and Eubacterium_ nodatum_group. Among them, Ruminococcaceae_UCG-005, Lachnospiraceae_FCS020_group, and Eubacterium_nodatum_group all belong to the order Clostridiales, which can metabolize tryptophan to IPA [26]. In addition, a similar positive correlation between IPA serum levels and strains from Ruminococcaceae was reported in human samples [27]. Therefore, the decreased abundance of these gut bacteria might be attributed to the decreased level of IPA.
IPA has been found to regulate intestinal barrier function in mice by activating the pregnane X receptor, which further upregulates the expression of tight junction proteins, such as claudins and occludins [28]. IPA is the only metabolite that correlated significantly with IgE levels and was positively correlated with claudin-3. This might explain, to some extent, the inhibited expression of claudin-3 in the model group. Glutamine, an abundant non-essential amino acid in mammalian biofluids, has been proven to be an important nutrient for intestinal mucosal barrier function [29,30]. As the primary substrate for rapidly dividing cells, it can modulate the expression of tight junction proteins, including claudin-1, occludin, and zonula occludens-1 (ZO-1). Deprivation of glutamine may cause a reduction in these proteins and atrophy of the intestinal villus [29–31]. Glutamine supplementation may ameliorate this loss of integrity primarily through the activation of the Ca2+/calmodulin-dependent protein kinase kinase 2-adenosine 5' -monophosphate-activated protein kinase signaling pathway, which increases the level of tight junction proteins [30].
BCAAs also contribute to the intestinal barrier function. The deficiency of BCAAs, especially isoleucine, may result in impaired immune function and increased pathogen susceptibility [32,33]. Isoleucine may induce the expression of β-defensins in epithelial and immune cells, which play a role in mammalian innate immunity [34]. In addition, isoleucine may provide nitrogen for the synthesis of glutamine in animal tissues, the lack of which depresses tight junction protein expression as mentioned above [35]. This interaction between isoleucine and glutamine was proven to some extent by a significant positive correlation between them, as observed in our study. A deficiency in valine also impairs the immune barrier of the intestine through propelling proinflammatory cytokines while preventing anti-inflammatory cytokines. Meanwhile, the lack of valine disturbs the physical barrier by restraining the transcription of occludin, claudin-3, and ZO-1, thus reducing the barrier function of the intestine [36]. Hence, the decreased level of valine might also contribute to the suppressed expression of claudin-3 due to a strong positive correlation between valine and claudin-3 as observed in our study. The disruption of the barrier integrity may result in increased gut permeability, allowing bacterial translocation and increased penetration of allergens and proteins [29,37,38]. Therefore, these results suggest that the intestinal barrier dysfunction is likely to be involved in hay fever pathology.
Coincidently, the gut dysbiosis observed may also lead to an abnormal barrier function of the gut. Compared to the control group, the relative abundance of microbes from the Firmicutes phylum was lower in the model group. This reduction has also been reported in children with airway allergies [39]. Among the diminished bacteria from the Firmicutes phylum, most of them are strains that can metabolize dietary fibers to SCFAs, including Eubacterium_nodatum_group, bacterial strains from Ruminococcaceae and Lachnospiraceae families, and species from the Clostridium genus. Ruminococcaceae and Lachnospiraceae families are predominant producers of butyrate [40]. Clostridium species mainly produce propionate [41]. This shift in the gut microbial community was in agreement with the declined levels of acetate, propionate, and butyrate, the three most abundant SCFAs, and the accumulated levels of monosaccharides. Species from Ruminococcaceae and Lachnospiraceae families have been shown to be discriminant for egg allergy, but in those studies, increased abundance of genera from Lachnospiraceae and Ruminococcaceae were associated with egg sensitization in children, which is different from our observations [42].
SCFAs act as important fuels for intestinal epithelial cells, especially butyrate, which is a preferred energy source for colonic epithelial cells and is essential for the maintenance of a healthy gut [43,44]. SCFAs are also crucial mediators of the intestinal immune response as well as epithelial protective function [45,46]. SCFAs stimulate the expression of tight junction proteins in the intestine, increase the expression of mucins, and improve gut morphology. They can also decrease the percentage of apoptotic cells, attenuate the increased paracellular permeability induced by lipopolysaccharide, and ultimately promote the integrity and repair of epithelial cells [47,48]. Specifically, microbialderived butyrate primarily performs critical functions within the gut. It increases epithelial consumption of O2, leading to a stabilized hypoxia-inducible factor, which is involved in coordinating the barrier protection function [44,49,50]. Acetic acid has antiinflammatory effects by decreasing the synthesis of inflammatory cytokines [51]. Besides producing SCFAs, these bacterial strains play a role in sustaining intestinal and systemic immune homeostasis. Clostridia strains from healthy human samples were found to enhance regulatory T cell abundance, and the administration of these strains blocks sensitization to food allergens and attenuate allergic diarrhea [52,53].
In addition to SCFA-producing bacteria, Helicobacter also caught our attention because it presented a strong negative correlation with both IgE and claudin-3 levels. Studies have shown that Helicobacter pylori (H. pylori) has a negative impact on the expression of claudin molecules and claudin composition at tight junctions in gastric epithelial cells, resulting in an increased passage of both small and large molecules across the digestive epithelium [54]. H. pylori also alters the gastric epithelial architecture, leading to impaired gastric barrier function, and many other Helicobacter species cause diseases in humans [55,56]. Given that the gut mucosa is the natural habitat of the Helicobacter genus, the Helicobacter strain that appeared in the model group in our study possibly has a negative effect on claudin-3 expression in intestinal epithelial cells, leading to increased intestinal permeability to allergens [57]. Recently, several reports have revealed that H. pylori might be linked to the development of allergic diseases. For example, Dautriche et al. [58] described a unique case in which an association between persistent dermal hypersensitivity reactions and H. pylori infection was observed.
Another notable genus is Akkermansia, which was only detected in the model group and negatively correlated with L-FABP. Akkermansia muciniphila is regarded as a promising ‘‘next-generation probiotic.” Studies have shown that loss of Akkermansia muciniphila is associated with age-induced gut permeability, and its administration may regulate gut barrier function by increasing the intestinal levels of endocannabinoids [59,60]. In addition, Akkermansia muciniphila-derived extracellular vesicles have been shown to be functional moieties for controlling gut permeability [61]. However, in our study, there were more Akkermansia muciniphila in the model group. A recent meta-analysis based on the data sets from five countries revealed that the overexpression of the Akkermansia genus in the human intestine was associated with Parkinson’s disease progression by increasing gut permeability and predisposing the intestinal neural plexus to oxidative stress [62]. Akkermansia muciniphila is a mucin-degrading bacterium, and its increase has been detected in type 2 diabetes patients [63]. Mucin is an integral part of the mucus layer that forms the first physical barrier of the intestinal defense system and protects epithelial cells from chemical, enzymatic, and microbial insults [64]. Thus, the enriched Akkermansia genus in the model group might have caused the loss of epithelial integrity by degrading the mucus layer and rendering the epithelium accessible to allergens. This type of impaired intestinal function caused by disrupted mucin has also been observed in rats with intestinal ischemia [65]. Since results vary, the relationship between Akkermansia muciniphila and gut integrity needs further investigation.
Prevotellaceae_Ga6A1_group is a mucus-associated bacterial strain in the Prevotellaceae family, which has a higher transcriptional activity in the inflamed mucosa [66]. It has been reported that some unknown members of the Prevotellaceae family are associated with high inflammatory disease susceptibility, and the Prevotella genus may exacerbate intestinal inflammation [67,68]. The expanded representation of Prevotellaceae_Ga6A1_group might be related to allergic inflammation.
Claudin proteins are the major components of tight junctions that form tight junction strands to seal the paracellular pathway in the epithelium, preventing luminal antigen uptake [69]. Among the claudin proteins, claudin-3 is a core component of tight junctions that can serve as a marker of gut barrier integrity [70]. Therefore, the significantly reduced expression of claudin-3 (the ‘‘tightening” claudin) at the intestinal site indicates that the animals in the model group developed disrupted intestinal epithelial integrity after challenge with pollen. In addition, the decline observed in claudin-3 level was also strongly linked with the increased level of serum IgE, suggesting that the change in claudin-3 may have an impact on hay fever development. Claudins have been proven to be a biomarker for airway epithelial barrier dysfunction in asthma patients, but the precise mechanisms of this leakage require further studies [71]. In patients with atopic dermatitis (AD), perturbed expression of claudins was detected. Yamaga et al. [72] described the role of abnormally decreased claudin-3 expression in the pathogenesis of AD. L-FABP is principally localized in the small intestine and is expressed in intestinal enterocytes. Its circulating level has been proven to be a noninvasive biomarker for intestinal mucosal damage [73,74]. In addition, data showed that L-FABP contributes to membrane integrity and preservation of cell morphology, and fatty acid binding proteins are associated with enterocyte mass loss [75]. Our results, along with relevant research, demonstrate that it is likely that the Helicobacter and Akkermansia detected might increase the susceptibility to pollen by affecting claudin-3 protein expression or the mucus layer, which disrupts the intestinal barrier function. At the same time, the lack of intestinal mucosal nutritional metabolites, such as valine and butyrate, as a result of gut microbiota dysbiosis, further drives the dysfunction of the intestinal barrier, thus leading to an allergy to pollen.
《5. Conclusions》
5. Conclusions
In summary, disruption of gut barrier integrity is believed to be involved in hay fever pathology. Specifically, decreased valine, IPA, SCFAs, and increased Helicobacter and Akkermansia species possibly inhibit tight junction protein expression and mucus layer formation in the intestine, thus leading to intestinal epithelium defense dysfunction (leaky gut), which renders the host prone to hay fever deployment. Changes in other intestinal epithelial cell nutrient metabolites and SCFA-producing bacteria further enhanced intestinal permeability under these conditions. These findings not only offer important information on microbial functions in the development of hay fever, but also suggest that reversing gut leakiness may be an effective and potent strategy for hay fever prevention and management. Moreover, further exploration of the causal relationship at the biochemical, cellular, and clinical levels is suggested.
《Acknowledgments》
Acknowledgments
This studywas supported by the National Natural Science Foundation of China (81971515 and 81973290), CAMS Innovation Fund for Medical Sciences (2016-I2M-3-011 and 2016-I2M-1-003), the Beijing Key Laboratory of Non-Clinical Drug Metabolism and PK/PD study (Z141102004414062), the NationalMegaproject for Innovative Drugs (2018ZX09711001-002-002), Beijing Natural Sciences Fund Key Projects (7181007), the Fundamental Research Fund for Central Universities of Peking Union Medical College (3332020037), and Beijing Municipal Administration of Hospitals Clinical Medicine Development of Special Funding Support (ZYLX201826).
The authors thank Shimadzu (China) Co., Ltd. for the technological supports.
《Compliance with ethics guidelines》
Compliance with ethics guidelines
Pei Han, Li-Sha Li, Zi-Xi Wang, Lin Xi, Hang Yu, Lin Cong, ZhengWei Zhang, Jie Fu, Li-Bin Pan, Shu-Rong Ma, Ran Peng, Xue-Yan Wang, Hong-Tian Wang, Xiang-Dong Wang, Yan Wang, Jin-Lyu Sun, and Jian-Dong Jiang declare that they have no conflict of interest or financial conflicts to disclose.
《Appendix A. Supplementary data》
Appendix A. Supplementary data
Supplementary data to this article can be found online at https://doi.org/10.1016/j.eng.2021.03.013.


 京公网安备 11010502051620号


