

《1. Introduction》
1. Introduction
Coronavirus disease 2019 (COVID-19) has rapidly spread across the world, infecting more than 90 million people by the end of January 2021. Approximately 20% of infected patients develop severe disease, with a mortality rate of 4% [1]. However, the pathogenesis of developing severe disease is still unclear. Therefore, it is urgently necessary to study this aspect in order to reduce the mortality and improve the prognosis.
Immune responses, both innate and adaptive, play an important role in the progression to severe disease in COVID-19. Therefore, understanding the unique immunological characteristics in severely infected or critically ill patients with COVID-19 is vital. Monocytes represent an important innate immune cell population. In severely infected or critically ill patients with COVID-19, monocytes and macrophages hyper proliferate [2], trigger secondary hemophagocytic lymphohistiocytosis (sHLH) [3], and result in a cytokine storm and fatal outcomes [3]. In addition, substantial numbers of mononuclear cells have been shown to infiltrate into the lungs, heart, lymph nodes, spleen, kidneys, and other organs. Moreover, monocytes are one of the main cell types that induce pulmonary fibrosis [4,5]. In severely infected or critically ill patients with COVID-19, pulmonary fibrosis is common [6]. Until now, none of the large-scale studies have reported the long-term follow-up outcomes of COVID-19 survivors; however, with the experience of severe acute respiratory syndrome (SARS) and Middle East respiratory syndrome (MERS), it is predicted that many survivors will be left with fibrosis. In turn, fibrosis leads to decreased lung function, and some critical cases even progress to irreversible loss of lung function and require lung transplantation to survive [7]. Pulmonary fibrosis induced by COVID-19 will be a substantial burden. Therefore, understanding the immunological characteristics of monocytes—including those associated with fibrosis—in severely infected or critically ill patients with COVID19 is crucial for understanding the pathogenic mechanism, preventing severe disease, and developing effective treatment.
In this study, we applied single-cell RNA transcriptomic sequencing (scRNA-Seq) for an in-depth phenotypic analysis of the monocytes in peripheral blood mononuclear cells (PBMCs) from severe or critical, pre-severe, moderate, and convalescent COVID-19 disease conditions and healthy controls to understand the specific immune characteristics of monocytes and determine the contributions of the sub-clusters of monocytes to severe or critical COVID-19.
《2. Methods》
2. Methods
《2.1. Subject enrolment and clinical characteristics》
2.1. Subject enrolment and clinical characteristics
Seven laboratory-confirmed patients with COVID-19 were prospectively enrolled in this study at the First Affiliated Hospital of Zhejiang University from February 2020 to April 2020. Overall, three severely infected or critically ill patients and four moderately infected patients were enrolled following the COVID-19 guidelines (Table S1 in Appendix A). One of the moderately infected patients eventually developed severe disease during the follow-up and is therefore referred to as a ‘‘pre-severe patient” in this study (Fig. 1). Table 1 presents the features and clinical course of the seven patients and six healthy controls. We collected PBMC samples from the seven patients with COVID-19 during the disease and recovery conditions (Fig. 1). In total, 20 PBMCs samples, including 14 PBMCs samples of patients with COVID-19 and 6 PBMCs samples of healthy controls, were collected and categorized into the moderate group (M group, M1–4, PBMCs samples collected during the moderately infected condition), the severely infected or critically ill group (S group, S1–3, PBMCs samples collected during the severely infected or critically ill condition), the convalescent/recovery group (R group, R1–7, PBMCs samples collected during the recovery condition), and the control/normal group (N group, N1–6) (Fig. 1).
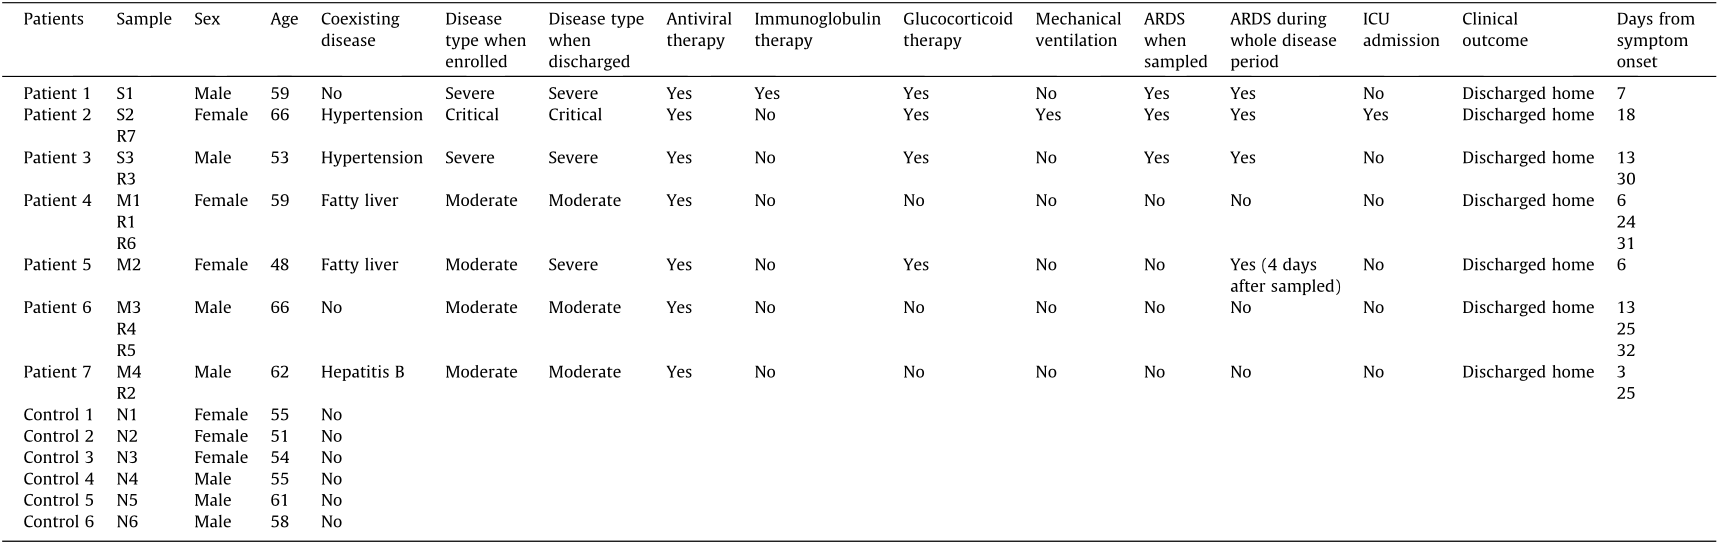
Moreover, the patients were followed up for the clinical course, outcome, and pulmonary fibrosis. Notably, the patient from which sample M2 was collected, a moderate case at the time of enrolment, eventually developed severe disease (Fig. 1). All patients associated with the S group (S1–3) and one patient associated with the M group (M2) were found to have pulmonary fibrosis during the follow-up in our study (Fig. 2).
《Fig. 1》
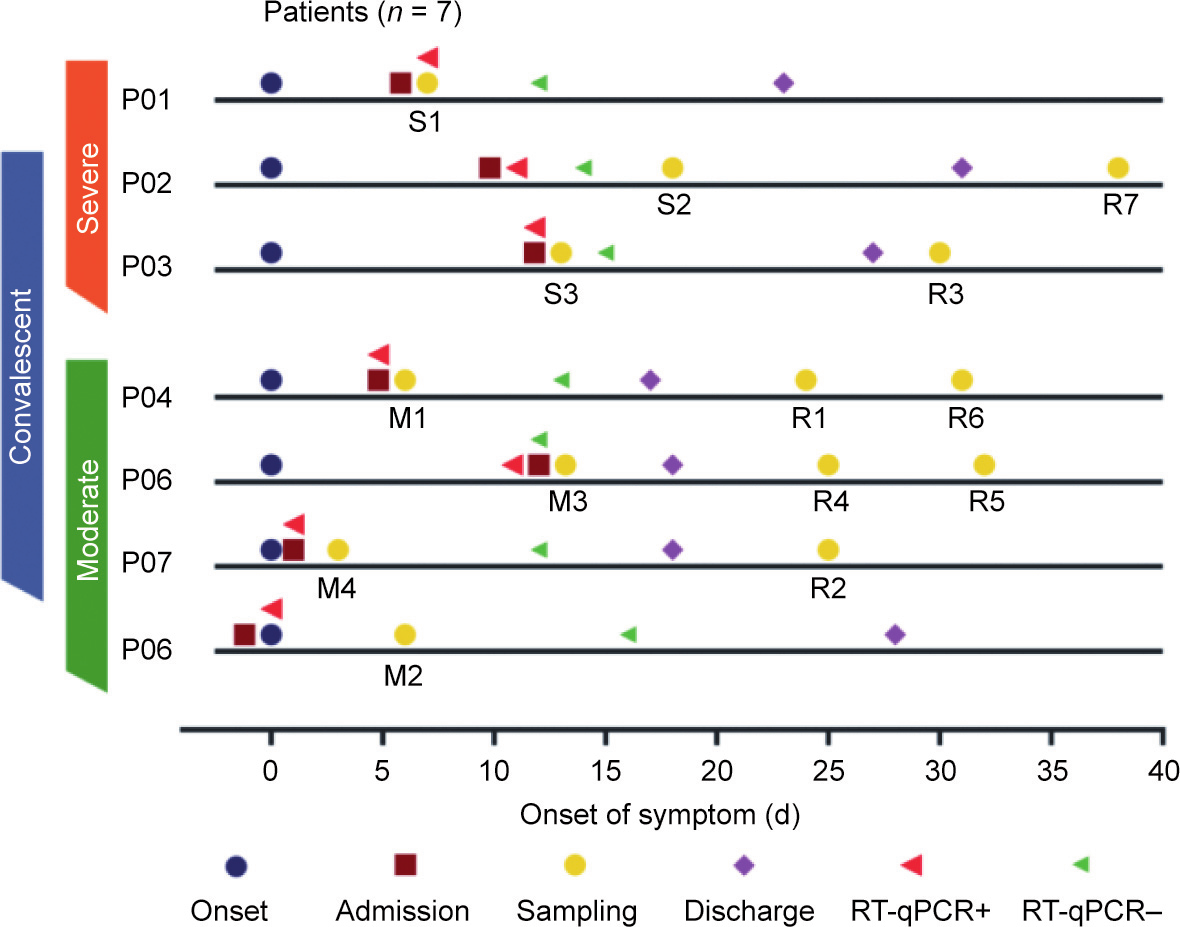
Fig. 1. The timeline of the clinical course of seven patients with COVID-19 enrolled in our study. Reverse transcription quantitative real-time polymerase chain reaction (RTqPCR) was performed on SARS-CoV-2 nucleic acids. ‘‘RT-qPCR+” indicates that the samples were positive for SARS-CoV-2 nucleic acids. Color bars on the left indicate the disease condition of the seven patients when enrolled. Patient 5 (P05) eventually developed severe disease after M2 samples had been collected for four days. S1–3: the severely infected or critically ill group; M1–4: the moderate group; R1–7: the convalescent/recovery group; N1–6: the control/normal group.
《Table 1》
Table 1 Clinical features of the seven patients with COVID-19 and controls.
S1–3: the severely infected or critically ill group; M1–4: the moderate group; R1–7: the convalescent/recovery group; N1–6: the control/normal group. ARDS: acute respiratory distress syndrome; ICU: intensive care unit.
《Fig. 2》
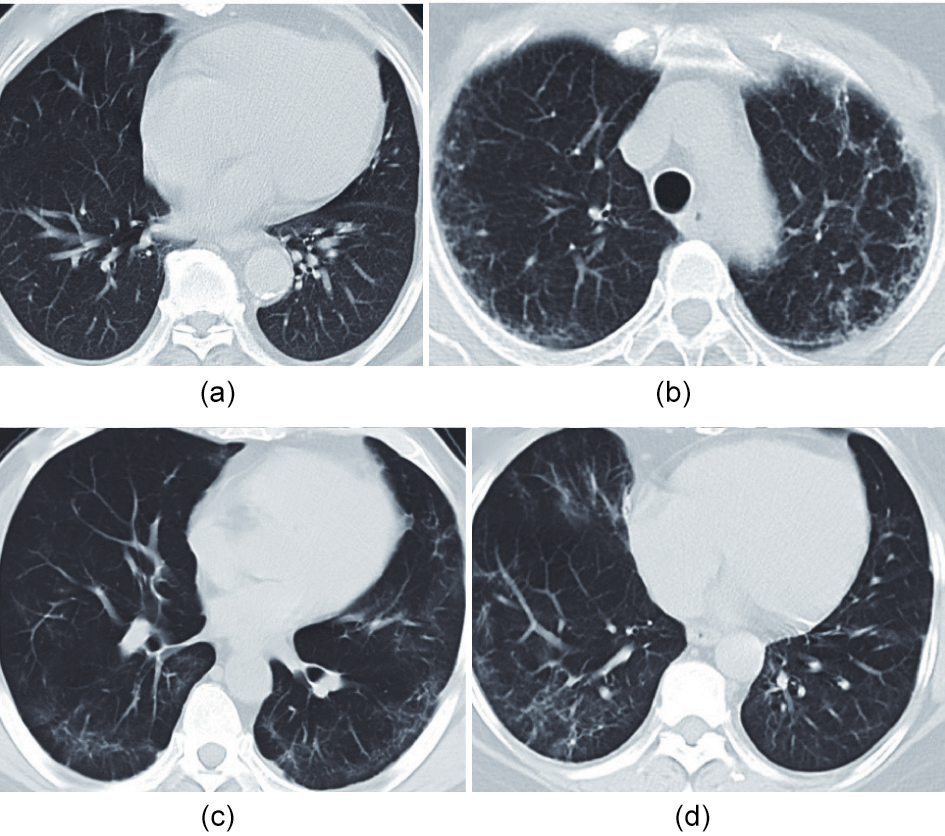
Fig. 2. Chest computed tomography (CT) imaging during the follow-up of patients who eventually developed severe disease. Chest CT imaging of (a) S1 and (b) S2 were taken approximately six months after first symptom onset; chest CT imaging of (c) S3 and (d) M2 were taken approximately two months after first symptom onset.
《2.2. PBMC preparation and storage》
2.2. PBMC preparation and storage
PBMCs were obtained from the peripheral venous blood of the COVID-19 cases and healthy controls using Ficoll-PaqueTM PREMIUM (GE Healthcare, USA), as instructed by the manufacturer. The PBMCs were resuspended in freezing solution (10% dimethyl sulfoxide (DMSO) and 90% non-inactivated fetal bovine serum (FBS)), gradually frozen by reducing the temperature to –80 °C at the rate of 1 °C·min–1 , and cryopreserved in liquid nitrogen until use [8].
The BD RhapsodyTM Single-Cell Analysis System (BD Biosciences, USA) was used to capture the transcriptomic data of single PBMCs. Single-cell capture was obtained by randomly distributing a singlecell suspension in more than 200 000 microwells using the limited dilution method. Beads harboring oligonucleotide barcodes were supplemented in excess to achieve bead pairing for individual cells in the microwells. Cell lysis was performed in microwells to hybridize messenger RNAs (mRNAs) with barcoded oligos. Beads were further transferred to a tube for reverse transcription and ExoI digestion. Furthermore, every complementary DNA (cDNA) underwent tagging at its 5' end with a unique molecular identifier (UMI) and cell barcode showing the corresponding cell. Wholetranscriptome library preparation was performed using the BD RhapsodyTM whole transcriptome analysis (WTA) amplification kit (BD Biosciences), including random priming and extension (RPE), RPE amplification polymerase chain reaction (PCR), and WTA index PCR. Library quantitation was performed using a high-sensitivity DNA chip (Agilent, USA) and a Bioanalyzer 2200 (Agilent), based on the Qubit High-Sensitivity DNA assay kit (Thermo Fisher Scientific, USA). Sequencing was performed on an Illumina sequencer (Illumina, USA) with a 150-base pairs (bp)-paired-end run.
《2.3. Single-cell RNA sequencing》
2.3. Single-cell RNA sequencing
scRNA-Seq data were analyzed by NovelBio Bio-Pharm Technology using the NovelBrain Cloud Analysis Platform↑ . UMI tools were applied for the single-cell transcriptome RNA analysis to identify the whitelist of cell barcodes. Clean data based on UMI were mapped to the human genome (Ensemble version 91) by using STAR mapping with customized parameters from the UMI tools’ standard pipeline to obtain the UMI count of each sample. Cells with more than 200 detected genes and a mitochondrial UMI rate of less than 30% were considered to have passed cell quality control, and mitochondrial genes were excluded. The Seurat package 3.1 was used for cell normalization following the expression table, considering the UMI counts of various samples and the percentages of mitochondrial genes to yield the scaled data. Afterward, principal component analysis (PCA) was performed for the scaled data to determine the top 2000 highly variable genes and top ten principal components, as well as for t-distributed stochastic neighbor embedding (tSNE) construction and uniform manifold approximation and projection (UMAP) construction.
↑ www.novelbrain.com.
https://satijalab.org/seurat/.
Using the graph-based cluster technique (resolution = 0.8), unsupervised cell cluster results were obtained according to the PCA-derived first ten principal components. Characteristic genes were determined using the ‘‘FindAllMarkers” function by the Wilcoxon rank sum test (ln(fold change) > 0.25, p < 0.05, and min.pct > 0.1). For cell type identification, clusters of the same cell type were subjected to re-tSNE analysis, graph-based clustering, and marker analysis.
《2.4. Pseudo-time analysis》
2.4. Pseudo-time analysis
Single-cell trajectories were analyzed using Monocle 2↑↑ with DDRTree and default parameters. Prior to the Monocle assessment, we selected marker genes from the Seurat clustering results and determined raw expression counts of the cells that passed filtering. According to pseudo-time analysis, the branch expression analysis modeling (BEAM) test was performed. Multiple trajectories were then constructed in the pseudo-temporal order to clearly assess both branched and linear differentiation. In theory, cells residing on the same or adjacent branches are more hierarchically associated than those on neighboring branches in trajectory plots.
↑↑ http://cole-trapnell-lab.github.io/monocle-release.
《2.5. Cell communication assessment》
2.5. Cell communication assessment
A systematic assessment of cell–cell communication molecules was performed using CellPhoneDB and a publicly available database of receptors, ligands, and their interactions. This procedure was followed by the annotation of membrane, secreted, and peripheral protein clusters at various time points. Mean and cell communication significance (p < 0.05) was determined according to the interaction and to a normalized cell matrix that was obtained using Seurat normalization.
《2.6. Single-cell regulatory network inference and clustering (SCENIC) analysis》
2.6. Single-cell regulatory network inference and clustering (SCENIC) analysis
To evaluate the regulation intensity of a transcription factor, we applied the workflow of single-cell regulatory network inference and clustering (pySCENIC, v0.9.5) [9] by using 20 000-motif databases for RcisTarget and GRNboost [9].
《2.7. QuSAGE analysis (gene enrichment analysis)》
2.7. QuSAGE analysis (gene enrichment analysis)
To characterize the relative activation of a given genome, such as pathway activation, we performed the QuSAGE (2.16.1) analysis.
《2.8. Co-regulated gene analysis》
2.8. Co-regulated gene analysis
To determine gene co-regulation networks, we used the ‘‘find_gene_modules” function of Monocle 3 with default parameters.
《2.9. Statistics》
2.9. Statistics
An explicit description of the statistical methods is presented with the associated results and in the figure legends.
《2.10. Ethics statement》
2.10. Ethics statement
This study was approved by the Ethics Committee of the First Affiliated Hospital of Zhejiang University (IIT20200148A).
《3. Results》
3. Results
《3.1. A single-cell atlas of PBMCs in patients with COVID-19 and controls》
3.1. A single-cell atlas of PBMCs in patients with COVID-19 and controls
To profile the peripheral immune responses in patients with COVID-19 and in the controls, we performed single-cell transcriptomic sequencing of a total of 20 PBMCs samples from patients with COVID-19 and healthy controls. A total of 84 095 cells with an average of 4205 cells per sample were sequenced (Table S2 in Appendix A). Overall, 23 clusters based on the cluster’s most significantly differential expressed genes (DEGs) in UMAP (Figs. 3(a) and (b)), including those from monocytes (S100 calcium binding protein A9 (S100A9), human leukocyte antigen DR α chain (HLA-DRA), cluster of differentiation 14 (CD14), and lysozyme (LYZ)), CD4+ T cells (cluster of differentiation 3d (CD3D), cluster of differentiation 3e (CD3E), and cluster of differentiation 4 (CD4)), CD8+ T cells (CD3D, CD3E, and cluster of differentiation 8a (CD8A)), B cells (membrane-spanning 4-domains subfamily A member 1 (MS4A1), cluster of differentiation 19 (CD19), and cluster of differentiation 79a (CD79A)), plasma cells (tumor necrosis factor receptor superfamily member 17 (TNFRSF17) and CD79A), macrophages (adhesion G protein-coupled receptor E1 (ADGRE1)), dendritic cells (DCs) (cluster of differentiation 1c (CD1C), HLA-DRA, and C-type lectin domain family 4 member C (CLEC4C)), natural killer (NK) cells (CD3D, CD3E, natural killer cell granule protein 7(NKG7), and granulysin (GNLY)), erythrocytes (hemoglobin subunit α 1 (HBA1) and hemoglobin subunit β (HBB)), and megakaryocytes (platelet factor 4 (PF4) and integrin subunit α 2b (ITGA2B)), were identified through clustering analysis (Fig. 3(c)).
We found dysregulated immune cells in patients with COVID19, particularly in severely and critically ill patients, compared with the controls (Figs. 3(b) and (d)). The proportions of various immune cell types varied greatly among the different groups. The results indicated substantial differences predominantly in monocytes, CD8+ T cells, and plasma cells between patients with COVID-19 and the controls (Figs. 3(a), (b), and (d)). We observed significantly increased proportions of monocytes in patients with COVID-19 compared with the controls, with a reduction in the recovery period, which indicates that circulating monocytes might play an important role in the pathogenesis of COVID-19. The number of CD8+ T cells decreased in patients with COVID-19 in comparison with the controls, particularly in severely infected or critically ill cases, which might indicate the exhaustion of immune cells correlated with immunodeficiency and disease severity in patients with COVID-19 who may have a more robust humoral immune response. We also noticed the recovery of most immune cell types during the recovery period, which indicates that immunity may recover during the recovery period and that the influence of COVID-19 on immune cells is not irreversible. Although the amount of monocytes in severely infected or critically ill patients was not significantly different compared with the monocyte amount in the moderately infected cases in our study, UMAP demonstrated that the monocytes were strongly remodeled in the severely infected or critically ill group (Figs. 3(a) and (b)).
《Fig. 3》
Fig. 3. A single-cell atlas of PBMCs from patients with COVID-19 and controls. (a) UMAP of all 20 PBMC samples from patients with different disease severity levels and controls. (b) UMAP of different groups, namely severe/critical (S), moderate (M), convalescence/recovery (R) (Rm represents convalescence from moderate conditions, and Rs represents convalescence from severe/critical conditions), and control/normal (N) groups. (c) Differential gene heat maps of different types of immune cells. (d) Proportions of different immune cells in various groups. X-axes correspond to each group, and Y-axes correspond to the proportions of each cell type in each sample; p values were calculated using the Wilcoxon rank sum test (p < 0.05 was considered significant).
《3.2. Distinct subgroups of monocytes in severely infected or critically ill patients with COVID-19 》
3.2. Distinct subgroups of monocytes in severely infected or critically ill patients with COVID-19
To reveal the characteristics of monocytes in patients with COVID-19 and in the controls, we identified the detailed monocyte subtypes. The clusters defined as monocytes were classified using re-tSNE analysis, and 12 sub-clusters (i.e., Mono 0–11) were obtained. The 12 clusters were further annotated as Mono 0 (amphiregulin (AREG), epiregulin (EREG), resistin (RETN), immunoglobulin κ constant (IGKC), and interleukin-18 (IL-18)), Mono 5 (AREG, EREG, IGKC, IL-18, and interferon α-inducible protein 27 (IFI27)), Mono 1, Mono 4, Mono 11, Mono 6 (chemokine (C–C motif) ligand 5 (CCL5), lymphotoxin-β (LTB), and human leukocyte antigen complex class II DQ α 1 (HLA-DQA1)), Mono 2, Mono 10 (interferon-induced protein 44-like (IFI44L), interferon, a-inducible protein 6 (IFI6), interferon-induced protein with tetratricopeptide repeats 3 (IFIT3), interferon-stimulated gene product 15 (ISG15), and interferon α-inducible protein 27 (IFI27)), Mono 9 (IFI6 and IFI27), Mono 3 (IGKC, HLA-DQA1, and IFI6), Mono 7 (RETN), and Mono 8 (RETN, IGKC, and IFI6) (Fig. 4(a) and Fig. S1 in Appendix A).
We found that the composition of sub-monocytes differed significantly between the different groups (Fig. 4(b)). We calculated the relative percentages of sub-monocytes in the monocytes of patients with COVID-19 and found that the diversity of the circulating monocytes in the S group was reduced significantly compared with those in the M, R, and N groups (Fig. S2 in Appendix A). The whole S group (i.e., S1, S2, and S3) predominantly contained Mono 0 and Mono 5. Furthermore, sample M2—a sample taken during the moderate period from pre-severe patient 5, who later developed severe disease—also predominantly contained Mono 0 and Mono 5 (Fig. S2). The UMAP of the monocytes of M2 sample was similar to that of the samples in S group (Fig. S3 in Appendix A). Except for Mono 0 and Mono 5, samples S1, S2, S3, and M2 barely had other clusters in circulation. Moreover, we noticed that clusters Mono 0 and Mono 5 only existed in samples S1, S2, S3, and M2, which came from patients who had or eventually developed severe/critical disease. Therefore, Mono 0 and Mono 5 were considered to be the sub-monocytes specific to severe infection or specific indicators of severe disease.
《Fig. 4》

Fig. 4. Changes in the features of monocyte clusters. (a) UMAP of monocytes from patients with different disease severity levels and from controls. (b) UMAP of different groups. (c) Violin map of genes with high expression in Mono 0 and Mono 5 cells. (d) Enriched pathway of AREG and EREG in Mono 0 cells. (e) Enriched pathway of AREG and EREG in Mono 5 cells. CDKN1A: cyclin-dependent kinase inhibitor 1A gene; HBEGF: heparin-binding epidermal growth factor (EGF)-like growth factor gene; PIK3R: phosphoinositide-3-kinase regulatory gene; PAK: p21 protein (Cdc42/Rac)-activated kinase gene; NCK: NCK adaptor protein gene; ARAF: A-Raf proto-oncogene; ELK1: E26 transformation-specific transcription factor gene; GSK3B: glycogen synthase kinase 3 β gene; NRAS: neuroblastoma rat sarcoma viral (v-ras) oncogene homolog; ABL: ABL proto-oncogene; HRAS: Harvey rat sarcoma viral oncogene homolog; RAF1: Raf-1 proto-oncogene; MTOR: mechanistic target of rapamycin gene; MAPK: mitogen-activated protein kinase gene; STAT5B: signal transducer and activator of transcription 5B gene; EIF4EBP1: eukaryotic translation initiation factor 4E binding protein 1 gene; NRG: neuregulin gene; CAMK2B: calcium/calmodulin-dependent protein kinase II β gene; BAD: BCL2-associated agonist of cell death gene; BTC: betacellulin gene; CBLC: Cbl protooncogene C; SHC (Src homology 2 domain containing) transforming protein gene; CAMK2A: calcium/calmodulin-dependent protein kinase II α gene; EGF: epidermal growth factor gene; GAB1: GRB2-associated binding protein 1 gene; RPS6KB2: ribosomal protein S6 kinase 70 kDa polypeptide 2 gene; PIK3CA: phosphatidylinositol-4,5-bisphosphate 3-kinase catalytic subunit α gene; BRAF: B-Raf proto-oncogene; MYC: v-myc avian myelocytomatosis viral oncogene homolog; TGFA: transforming growth factor α gene; AKT3: v-akt murine thymoma viral oncogene homolog 3; CBLB: Cbl proto-oncogene B; PIK3CB: phosphatidylinositol-4,5-bisphosphate 3-kinase catalytic subunit β gene; PTK2: protein tyrosine kinase 2 gene; PIK3CG: phosphatidylinositol-4,5-bisphosphate 3-kinase catalytic subunit  gene; SOS1: son of sevenless homolog 1 (Drosophila) gene; PIK3CD: phosphatidylinositol-4,5-bisphosphate 3-kinase catalytic subunit
  gene; CAMK2D: calcium/calmodulin-dependent protein kinase II gene; CRKL: v-crk avian sarcoma virus CT10 oncogene homolog-like; MAP2K7: mitogen-activated protein kinase 7 gene; KRAS: Kirsten rat sarcoma viral oncogene homolog.
《3.3. Gene expression patterns in the severe-disease-specific submonocytes Mono 0 and Mono 5》
3.3. Gene expression patterns in the severe-disease-specific submonocytes Mono 0 and Mono 5
We further studied the severe-disease-specific clusters Mono 0 and Mono 5, which might contribute to COVID-19 deterioration. To further delineate the functional profiles of Mono 0 and Mono 5, we performed DEG analysis and gene ontology (GO) analysis across these sub-populations. The results showed that both Mono 0 and Mono 5 specifically and highly express pro-fibrosis genes such as AREG, EREG, a disintegrin and metalloproteinase with thrombospondin motifs 2 (ADAMTS2), and cytokine IL-18 genes (Fig. 4(c)). IL-18 is considered to be the critical driver of macrophage activation syndrome (MAS) [10]. In addition, the Mono 0 subtype highly expressed the hormone gene RETN. Kyoto Encyclopedia of Genes and Genomes (KEGG) pathway analysis displayed a significantly enriched erythroblastic leukemia viral oncogene homolog (ErbB) signaling pathway, which can be activated by the binding of AREG and EREG to epidermal growth factor receptor (EGFR), and which has been confirmed to be correlated with fibrosis in SARS patients (Figs. 4(d) and (e)). Furthermore, all the patients in our study who had the severe-disease-specific clusters Mono 0 and Mono 5 during their disease condition developed pulmonary fibrosis during the follow-up (Fig. 2). We speculate that Mono 0 and Mono 5 cells are associated with fibrosis and accounted for the inflammation in severe cases.
Using SCENIC, we found that AREG and EREG are driven by the upregulation of transcription factors activating transcription factor 3 (ATF3), Jun dimerization protein 2 (JDP2), positive regulatory domain I protein with ZNF domain (PRDM1), and homeobox A5 (HOXA5); ADAMTS2 was found to be driven by ATF3, PRDM1, and interferon regulatory factor 1 (IRF1); and RETN was found to be driven by Jun proto-oncogene (JUN) (Fig. S1(c)).
《3.4. Pseudo-time analysis of monocyte sub-clusters》
3.4. Pseudo-time analysis of monocyte sub-clusters
To investigate how the type and state of the monocytes related to each other and how the monocytes evolved from moderate to severe/critical or from severe/critical to recovery conditions, we performed pseudo-time analysis to examine the monocytes’ differentiation trajectories and generated trajectory plots to determine the relationships of cell types with disease states. As shown in Fig. 5(a) and Fig. S4 in Appendix A, the descending trajectory consisted of monocyte subsets in the normal, recovery, and moderate cases, whereas the rising trajectory comprised monocyte subsets (Mono 0 and Mono 5) in the severely infected or critically ill cases, which reflected the process of monocyte deterioration. We mainly focused on determining the gene expression pattern along the transition of the monocyte subsets from the normal, recovery, and moderate cases to the severely infected or critically ill cases through the trajectory analysis. We further constructed a heat map of genes according to the trajectory plot to determine how the genes changed during the process of monocyte deterioration. The genes were divided into three groups based on the observed changes; the upregulated and downregulated pathways are listed in Fig. 5(b). Along the trajectory, from relatively normal monocyte clusters to severe-disease-specific clusters (Mono 0 and Mono 5), glycolysis/gluconeogenesis, the HIF-1 signaling pathway, tumor necrosis factor (TNF) signaling, and ErbB signaling were upregulated, whereas antigen processing and presentation, phagocytosis, and cell–cell adhesion were downregulated.
《Fig. 5》

Fig. 5. Pseudo-time analysis of monocyte sub-clusters. (a) Pseudo-time of sub-clusters of monocytes. (b) Differentially upregulated and downregulated pathways in different monocyte sub-clusters in pseudo-time.  : the family of receptors for immunoglobulin G; NOD: nucleotide oligomerization domain; RIG-I: retinoic acid-inducible gene I; FoxO: forkhead box O; cGMP: cyclic guanosine monophosphate; PKG: cGMP-dependent protein kinase; NF-κB: nuclear factor-κB.
《3.5. The ratio of Mono 0 and Mono 5 may be associated with disease severity》
3.5. The ratio of Mono 0 and Mono 5 may be associated with disease severity
Monocytes from samples S1, S2, S3, and M2 were mainly composed of Mono 0 and Mono 5 populations, with the difference that Mono 0 dominated in the samples S1 and S3 from severely cases and sample S2 from the critically ill case, whereas Mono 5 dominated in the sample M2 from the pre-severe case. The ratio of Mono 0/Mono 5 in severely infected and critically ill patients was the reverse of that in the pre-severe case. The ratio increased from the pre-severe case to the severely infected and critically ill patients, and was highest in the critically ill case (Fig. S2), which suggests that the increased ratio of Mono 0 and Mono 5 might be a marker of the clinical condition in infected patients.
《4. Discussion》
4. Discussion
Monocytes play vital roles in the pathogenicity and progression of COVID-19. Thus, exploring the underlying mechanism of the monocytes involved in severe disease could be valuable for obtaining a better understanding of COVID-19 and for the discovery of novel therapeutic targets. In this study, we conducted an in-depth phenotypic analysis of the monocytes in severely and critically ill COVID-19 patients and compared the monocyte profiles with those of patients with moderate and convalescent COVID-19 and of controls using scRNA-Seq.We found that the monocytes were remarkably remodeled in severely and critically ill COVID-19 patients, in terms of an increased percentage of monocytes and seriously reduced diversity. Importantly, we identified two novel severe-disease-specific monocyte subsets, namely Mono 0 and Mono 5, which may be related to severe/critical COVID-19 disease. It was notable that a sample obtained before a patient’s progression to a severe case showed a monocytes atlas that was similar to that of the severely/critically ill patients, which indicates that monocytes undergo severe phenotypic changes before the progression to severely/critically ill conditions. This finding confirms that monocytes are involved in the deterioration of COVID-19, which has been reported in another study [2]. In addition, Mono 0 and Mono 5 were present in severely/critically ill patients and in the moderately infected patient who developed severe disease later; however, they were not present in the recovery group, the other three moderately infected patients that did not develop severe disease, or in the controls. These findings indicate that the two novel monocyte subsets are involved in the pathogenesis of progression to severe disease and could be used as potential early markers for predicting severe disease in COVID-19 patients.
We further defined the two specific monocytes, Mono 0 and Mono 5, in severely or critically ill patients with COVID-19. Mono 0 and Mono 5 were found to particularly express AREG and EREG, and the ErbB signaling pathway was found to be enriched significantly in the GO pathway analysis. Robust AREG and EREG expression is rapidly induced during wound healing [11,12], thereby activating the EGFR pathway (named ErbB in humans) to promote repair and homeostasis following infection-induced tissue damage. Once the damaged tissue is repaired, the wound healing response is downregulated [13]. However, excessive inflammation or persistent damage—such as that in severe COVID-19 patients—would dysregulate the wound healing response, leading to uncontrolled pulmonary repair mechanisms including unrestrained myofibroblast differentiation and excessive collagen deposition, and would result in scarring, fibrosis, and impaired organ function [13–15]. Fibrosis resembles an exaggerated or abnormal healing response that does not easily resolve [16]. EGFR signaling has been demonstrated to be a key pathway in injury-induced pulmonary fibrosis [17], such as SARS [13]. Based on these findings and on the similarities between SARS-CoV-2 and SARS-CoV-1, we speculate that Mono 0 and Mono 5 are profibrogenic. All the patients who had Mono 0 and Mono 5 in the disease condition were found to have pulmonary fibrosis during the follow-up in our study, which further supports our hypothesis. Pulmonary fibrosis may be the main long-term complication of COVID-19 that leads to chronic dyspnea, declined quality of life, and substantial burden. Thus, effective interventions for fibrosis are urgently required. Our findings may provide a better understanding of the fibrosis mechanism as well as a target for early interventions for pulmonary fibrosis.
Moreover, Mono 0 and Mono 5 secreted IL-18 unlike other monocyte sub-clusters. IL-18 is mainly secreted by monocytes and macrophages in response to harmful stimulation [18,19], such as SARSCoV-2 infection, and plays a role in immune response and lung fibrosis [20–22]. A high IL-18 level in serum is associated with disease severity and poor prognosis in COVID-19 [23]. IL-18 participates in cytokine storm in severely/critically ill COVID-19 patients, resulting in acute respiratory distress syndrome (ARDS) [24]. Hence, Mono 0 and Mono 5 might participate in cytokine storm by secreting IL18, which might further account for the deterioration of patients with COVID-19. Our finding provides evidence for IL-18 inhibitor being a potential therapeutic strategy for treating COVID-19 [25].
In addition, we observed different upregulated and downregulated pathways in Mono 0 and Mono 5 compared with those in other sub-clusters. We observed a decrease in normal monocytic functions such as antigen processing and presentation, phagocytosis, and cell–cell adhesion; however, glycolysis/gluconeogenesis, the HIF-1 signaling pathway, and the ErbB signaling pathway were found to be increased in Mono 0 and Mono 5. Monocytes undergo metabolic changes in response to infections [26,27], and metabolic reprogramming has been reported in monocytes after SARS-CoV-2 infection [28,29]. In an ex vivo study, increased glycolysis in monocytes—which can be promoted through the mitochondrial reactive oxygen species (mtROS)/HIF-1α/glycolysis axis—was reported to be induced by SARS-CoV-2 infection [29]. Increased glycolysis promotes viral replication and pro-inflammatory cytokine production that further account for cytokine storm, T-cell dysfunction, and epithelial cell death [29,30]. Furthermore, increased glycolysis has been reported to be part of the mechanism by which individuals with diabetes have a high risk of developing severe disease in COVID-19 [29]. Therefore, increased glycolysis in Mono 0 and Mono 5 suggests obvious metabolic changes in severely/critically ill patients and may account for severe disease. Glycolysis could be a target for treating COVID-19. Moreover, in a large-scale plasma analysis, the activation of gluconeogenesis was correlated with the severity of COVID-19 and was considered to play a role in disease progression [31]. However, gluconeogenesis in monocytes has not been studied separately, and more studies are required in this direction. Nevertheless, our study confirms that targeting metabolic pathways is a potentially effective approach for treating COVID-19 or preventing severe disease [29].
Moreover, we found some differences between the subsets Mono 0 and Mono 5; Mono 0 was found predominantly in severely/critically ill cases, whereas Mono 5 was found predominantly in the pre-severe case. We observed that the ratio of Mono 0 to Mono 5 increased dynamically during disease progression, from the moderate period to the severe period, and then to the critically ill period in COVID-19. Therefore, the Mono 0/Mono 5 ratio may be a predictor for disease severity in severely/critically ill patients.
We also found that Mono 0 expresses RETN gene, which was not found in Mono 5. RETN is an adipokine that is mainly produced in monocytes and macrophages in humans [32]. RETN plays various roles, including promoting the inflammatory response, by inducing cytokines such as TNF-α, IL-1, and IL-6, and accounts for insulin resistance [33]. The RETN gene has turned to be one of the most important genes related to SARS [34]. In COVID-19, RETN has been described as a neutrophil-derived effector and as a predictor for critical illness [35]. However, RETN gene expression in monocytes in COVID-19 has not been described. Furthermore, individuals with diabetes or cardiovascular diseases, which are associated with increased RETN expression, are at a high risk of developing severe or critical illness in COVID-19 [36,37]. We speculate that RETN is one of the reasons why these patients are more likely to develop severe disease, and we suspect that RETN plays a role in COVID19 due to the pro-inflammatory and insulin resistance functions.
This study has some limitations. First, the sample size of our study—particularly of pre-severe and severely/critically ill samples—was small. Samples of some of the patients were unavailable at different time points of the disease due to difficulties in sampling. Second, the hypothesis could not be verified due to the difficulties in sampling. Future studies with a larger sample size are required to confirm the observations of the present study. Third, our study lacked a control group of patients with other causes of ARDS, such as influenza, which is crucial in order to better understand the specificity of COVID-19.
In summary, monocytes were found to be strongly reprogrammed and two novel severe-disease-specific monocyte subpopulations were identified in pre-severe and severely/critically ill patients with COVID-19 in our study. We suggest that these two novel sub-clusters are potential predictors for severe disease and exhibit pro-fibrogenic and pro-inflammation characteristics. Furthermore, the two novel sub-clusters exhibited metabolic changes. Taken together, our findings provide potential new predictors for severe disease in and therapeutic targets of COVID-19. Our study provides resources for better understanding the underlying pathogenic mechanism in COVID-19, and may facilitate further studies on COVID-19.
《Acknowledgments》
Acknowledgments
This work was supported by the National Science and Technology Major Project (2017ZX10204401001002), the National Key Research and Development Project of China (2017ZX10204- 401001002008), the Key Research and Development Project of Zhejiang Province (2020C03123), and Zhejiang Provincial Nature Science Foundation of China (LED20H19001).
We thank all the participants. We gratefully acknowledge the participation of NovelBio Co., Ltd. for the support of bioinformatics analysis with their NovelBrain Cloud Analysis Platform, and thank Drs. Chao Wang and Bo Zhang for their contribution.
《Compliance with ethics guidelines》
Compliance with ethics guidelines
Yan Zhang, Shuting Wang, He Xia, Jing Guo, Kangxin He, Chenjie Huang, Rui Luo, Yanfei Chen, Kaijin Xu, Hainv Gao, Jifang Sheng, and Lanjuan Li declare that they have no conflict of interest or financial conflicts to disclose.
《Appendix A. Supplementary data》
Appendix A. Supplementary data
Supplementary data to this article can be found online at https://doi.org/10.1016/j.eng.2021.05.009.


 京公网安备 11010502051620号


