

《1. Introduction》
1. Introduction
Isothermal nucleic acid amplification techniques, such as nucleic acid sequence-based amplification, strand displacement amplification, helicase-dependent amplification, rolling circle amplification, and loop-mediated isothermal amplification (LAMP), are promising methods for point-of-care pathogen identification because they can efficiently amplify targets without the need for thermal cycling equipment that is required for polymerase chain reaction (PCR)-based methods [1,2]. LAMP is of particular interest as it uses a single enzyme and can amplify up to 109 copies, using less than ten copies of input template, within an hour [3]. Despite these advantages, conventional LAMP assays occasionally suffer from challenges, such as nonspecific amplification, primer-dimer formation, or contamination, leading to false-positive results, attributed to the high concentration of primers and Mg2+ [4,5]. Common techniques for LAMP amplicon visualization such as turbidity measurement [6], agarose gel electrophoresis [7], and staining with fluorescence intercalating dyes [8,9], metal-ion indicators [10], and pH-sensitive dyes [11] cannot discriminate between unspecific by-products. While some efforts have been made to solve this issue through various approaches, including uracilDNA-glycosylase (UDG)-supplemented LAMP, in which deoxyuridine triphosphates (dUTPs) are incorporated into amplicons during the first round of amplification and then digested by UDG before the next round to eliminate carryover [12], as well as fluorescence resonance energy transfer probes [13], molecular beacons [14], quenching of unincorporated amplification signal reporters [15], and detection of amplification by release of quenching [16,17], these approaches require relatively expensive reagents and devices and are problematic for point-of-care diagnostics. In contrast, the lateral flow immunoassay strip (LFIAS) is faster and simpler, and has been reported to be promising in enhancing the visualization and analysis of amplified LAMP products [18–21]. Unfortunately, LAMP-LFIAS could also detect amplification by-products, leading to spurious results. Phillips et al. [22] recently managed to prevent by-product capture on commercial AuNPs-LFIAS by integrating a strand displacement (SD) probe into LAMP assays. The SD probe was prepared by annealing a carboxyfluorescein (FAM)-tagged loop primer to the quencher-tagged shorter complementary strand. However, the use of a fluorophore-labelled loop primer constrained the adaption to different targets because loop primer designs are usually less satisfactory in that regard, and most colloidal gold strips can only execute qualitative or semiquantitative detection.
To address these concerns, we guaranteed the specificity and reliability of detection using SD-LAMP that only gave truepositive responses in the presence of target DNA [23]. We replaced the labelled loop primer (loop forward (LF) or loop backward (LB)) in the SD probe with a labelled inner primer (forward inner primer (FIP) or backward inner primer (BIP)) because the latter is used at twice the concentration of the former in the LAMP reaction and is thus incorporated to a higher degree into amplicons. To achieve a simpler and more sensitive direct readout of LAMP amplification, we further combined SD-LAMP with quantum dot nanobeads (QBs)-labelled LFIAS for the detection of bacteria. QBs, which are novel fluorescent nanomaterials comprising polymer nanobeads doped with numerous quantum dots, possess excellent brightness and strong stability against photobleaching [24]. Compared with LFIAS using colloidal gold nanoparticles or fluorescent dyes, the QBs-labelled LFIAS exhibits much higher sensitivity and accuracy as well as lower background interference [25].
The working principle of this newly established detection method is demonstrated in Fig. 1. Briefly, in a typical procedure, the biotin-labelled inner primer and fluorescein isothiocyanate (FITC)-labelled SD probe were used for nucleic acid amplification to tag the target DNA (Fig. 1(a)). The resultant hybrids with double labels (FITC and biotin) were then deposited onto QBs-labelled LFIAS based on the formation of a sandwich structure to indicate the presence or absence of the target (Fig. 1(b)). We hypothesized that the combination of SD-LAMP with QBs-labelled LFIAS method could successfully detect target pathogens in a specific manner. Salmonella Typhimurium (ST), a pathogenic bacterium that commonly causes severe illness in humans and animals, was selected to examine the performance of the proposed platform. With its high specificity and sensitivity, rapid assay time, and convenience of operation, our newly developed method could become a useful tool for bacteria detection in laboratories and for on-site testing.
《Fig. 1》

Fig. 1. (a) Principle of the SD-LAMP reaction and (b) a schematic illustration of the QBs-labelled LFIAS for amplification product detection. IgG: immunoglobulinG.
《2. Materials and methods》
2. Materials and methods
《2.1. Materials and reagents》
2.1. Materials and reagents
Ten ST and 20 non-ST strains were preserved in 25% glycerol at –80 °C. All of them were resuscitated twice in Luria-Bertani (LB) broth at 37 °C for 24 h, and the genomic DNA was extracted using the HiPure Bacterial DNA Kit (Magen, China). Bst 2.0 WarmStart DNA polymerase obtained from New England Biolabs (M0538L, USA) was used in the SD-LAMP reaction. All primers and probes were ordered from Tsingke Biotech Co. Ltd. (China).
Hydrophilic CdSe/ZnS QBs coated with carboxyl were synthesized in our laboratory. The coupling reagent, 1-ethyl-3-(3- dimethylaminopropyl) carbodiimide hydrochloride (EDC), and bovine serum albumin (BSA) were purchased from Sigma-Aldrich (USA). Tween-20, polyethylene glycol (PEG), fructose, sucrose, and other reagents of analytical grade were purchased from Aladdin (China). Anti-FITC monoclonal antibody (mAb1), antibiotin monoclonal antibody (mAb2), and goat anti-mouse IgG were obtained from Abcam (UK). All LFIAS materials, sample pad (Ahlstrom 8951), conjugate pad (Ahlstrom 8964), nitrocellulose (NC) membrane (Sartorius CN 140), absorption pad (H5072), and PVC sheet (DB-6) were purchased from Jieyi Biotech Co. Ltd. (China).
《2.2. SD probe design and SD-LAMP reaction》
2.2. SD probe design and SD-LAMP reaction
The SD probe was essentially hemiduplex DNA composed of hybridized oligonucleotides, in which the inner primer (FIP or BIP) contained a fluorophore at its 5ʹ- or 3ʹ-end and a shorter complementary stand (termed Fd). In general, the fluorophore-labelled primer was designed to avoid forming stable hairpins; the melting temperature of SD probe should be significantly lower than 65 °C (at least 5 °C lower) to ensure initiation of the toehold-mediated strand exchange reaction. The SD-LAMP primers were designed for ST using the PrimerExplorer V5 online software (Eiken Chemical Co. Ltd., Japan). A stock solution of SD probe was prepared by annealing 10 μmol·L–1 of 5ʹ-FITC-labelled BIP to 50 μmol·L–1 of Fd at 95 °C for 5 min, followed by slow cooling to 4 °C at a rate of 0.1 °C·s–1 . The SD-LAMP reaction was performed in almost the same manner as the standard LAMP reaction, with the exception that the SD probe was added. The reaction mixture containing the 1 μL of DNA template, 6 mmol·L–1 MgSO4, 1.4 mmol·L–1 of each dNTP, 0.32 U·μL–1 Bst 2.0 WarmStart DNA polymerase, 0.2 μmol·L–1 F3 and B3 primers, 1.6 μmol·L–1 FIP primer, 0.8 μmol·L–1 BIP primer, and 0.8 μmol·L–1 SD probe in a total volume of 25 μL of 1× isothermal buffer was performed in Biometra TOne 96G (Jena Analytik, Germany) with incubation at 65 °C for 1 h, followed by heating to 80 °C for 10 min to denature the polymerase, and was then kept at 4 °C until analysis. The standard LAMP and SD-LAMP products were analyzed using 2% polyacrylamide gel electrophoresis with ethidium bromide staining, and visualized using a Tanon-2500 ultraviolet (UV) transilluminator (Tanon, China). In addition, the validity of SD-LAMP was further confirmed using LightCycler® 96 real-time fluorescence detection (Roche, Switzerland).
《2.3. Preparation and characterization of QBs–mAb1 conjugates》
2.3. Preparation and characterization of QBs–mAb1 conjugates
The QBs–mAb1 conjugates were prepared using the EDC coupling reaction between carboxyl groups on the QBs surfaces and the amine groups of the antibody. In detail, 5 μL of QBs (10 mg·mL–1 ) diluted in 500 μL phosphate buffer (PB) (0.01 mol·L–1 , pH 6.0) were pre-activated with 5 μL of a freshly prepared EDC (2 mg·mL–1 ). The mixed solution was placed in a rotator for 30 min at 25 °C, followed by addition of 5 μg mAb1 and stirring for 2 h. To block residual active coupling sites, 50 μL of PB (0.01 mol·L–1 , pH 6.0) containing 10% BSA was added and incubated for a further 1 h. After this, QBs–mAb1 were centrifuged at 10000g for 20 min and washed with pure water at least twice. Finally, the purified conjugates were suspended in 1 mL of PB (0.01 mol·L–1 , pH 7.4) containing 2% (w/v) fructose, 5% (w/v) sucrose, 1% (w/v) BSA, 1% (w/v) PEG 20000, and 0.4% (v/v) Tween-20, and stored at 4 °C for later use. The appropriate ratio of QBs:mAb1 was optimized in the range of 20–300 μg mAb1 conjugated to 1 mg QBs. QBs–mAb1 conjugates were characterized using UV–visual (vis) absorption (Lambda 45 spectrophotometer, PerkinElmer, USA) and fluorescence emission (LS 45 spectrofluorometer, PerkinElmer) spectra. Zetasizer Nano ZS 90 (Malvern Instruments, UK) was used to measure the hydrodynamic diameter of nanoparticles. Morphology images of QBs were taken using an H-7650 transmission electron microscope (TEM) (Hitachi, Japan).
《2.4. Fabrication and optimization of QBs-labelled LFIAS》
2.4. Fabrication and optimization of QBs-labelled LFIAS
The QBs-labelled LFIAS was composed of a sample pad, conjugate pad, NC membrane, and absorption pad. The sample pad fabricated of glass fiber was soaked in tris(hydroxymethyl) aminomethane hydrochloride (Tris-HCl) (0.05 mol·L–1 , pH 8.0), containing 2% (w/v) PEG 8000 and 1.5% (v/v) Tween-20, for complete saturation and dried at 50 °C for 24 h. The conjugate pad was prepared in a manner similar to that of the sample pad with the exception that the treatment solution was borate buffer (BB) (0.002 mol·L–1 , pH 8.5), containing 5% (w/v) trehalose, 0.5% (w/v) casein sodium salt, 0.1% (w/v) PEG 20000, and 0.5% (v/v) Tween20, and, after soaking, the conjugate pad was sprayed with a certain volume of QBs–mAb1 followed by 12 h of drying at 37 °C. Thereafter, a certain concentration of mAb2 and 1 mg·mL–1 goat anti-mouse IgG was added onto the NC membrane using a XYZ3060 dispenser (BioDot, USA) to form the test (T) line and the control (C) line, respectively. The dispensing rate was 1 μL·cm–1 , and the distance between the T line and C line was approximately 4 mm. The NC membrane was then incubated under vacuum conditions at 37 °C for 12 h. The determination of an optimal concentration of antibody on the T line was based on the signal intensity of the T and C lines of the corresponding positive sample. The absorption pad was used without treatment. All parts were sequentially pasted onto a polyvinyl chloride (PVC) sheet with a 2 mm overlap to ensure that fluid would get through the whole strip smoothly. Finally, the assembled strips were cut to a size of 4 mm using a strip cutter (HGS201, Fenghang, China) and stored in a desiccator for subsequent assays.
《2.5. Assay procedure with QBs-labelled LFIAS》
2.5. Assay procedure with QBs-labelled LFIAS
The whole procedure included the SD-LAMP reaction and the QBs-labelled LFIAS detection step. In total, 10 μL SD-LAMP product was mixed with 90 μL phosphate buffer saline (PBS) (0.01 mol·L–1 , pH 7.4) and was pipetted onto the sample pad, allowing the liquid to be absorbed and migrate toward the absorption pad by capillary force. Once the target DNA was included in the sample, the FITCand biotin-tagged amplicons could bind with the QBs–mAb1 conjugates via an antigen–antibody interaction and were then captured by the coating mAb2 at the T line to form a sandwich complex. The excess QBs–mAb1 migrated further and reacted with the goat antimouse IgG at the C line. In contrast, if no target DNA was present in the sample, it would flow past the T line without interaction, which resulted in no fluorescence signal at the T line, but a positive signal remaining at the C line. If no C line was present, the test was considered to be invalid. After 15 min, the test strip was inserted into a fluorescent strip reader (FIC-S1, Fenghang), and the fluorescence intensity (FI) of the T and C lines was recorded to quantify the analytes. To eliminate the interference from batch variation and sample matrix, the FIT/FIC ratio was then calculated using the HMreader 8.3 software. The SD-LAMP reaction without target DNA was performed as a control experiment. Each sample test was performed three times under the same conditions.
《2.6. Analytical performance》
2.6. Analytical performance
The performance of SD-LAMP QBs-labelled LFIAS was assessed using the DNA template of bacteria. A total of 10 ST and 20 nonST (including ten different serotypes of Salmonella and ten non-Salmonella) strains with the same concentration of 107 colony forming unit (CFU)·mL–1 were used to evaluate its specificity. The sensitivity tests were performed using DNA extracted from a tenfold dilution series of ST ATCC 14028 culture ranging from 107 to 100 CFU·mL–1 . A calibration curve was drawn by plotting the FIT/FIC against the concentration of ST in the sample. The limit of detection (LOD) was defined by the equation LOD = 3σ/S, where σ is the standard deviation of blank measurements, and S is the slope of the calibration curve. As controls, conventional PCR using newly designed primers (forward primer: 5' -CGTGCTTGAATACCGCCTGT; reverse primer: 5' -AGATCGTGTCCGCTATAGGT-3' ) and SD-LAMP with all DNA templates were performed in parallel.
《2.7. Application in food samples》
2.7. Application in food samples
The applicability of SD-LAMP QBs-labelled LFIAS was tested using different types of food, such as potable water, orange juice, lettuce, and chicken, mixed with ST to get the spiked samples. In brief, liquid samples, including potable water and orange juice, were diluted 100-fold with PB (0.01 mol·L–1 , pH 7.4) for further use. As for the solid samples (lettuce and chicken), 10 g was homogenized into a sterile bag with 90 mL PB (0.01 mol·L–1 , pH 7.4), followed by incubation for 30 min. All food samples were then centrifuged to remove food debris, and the supernatants were artificially contaminated with ST ATCC 14028 to obtain different final concentrations of 107 –100 CFU·mL–1 . Control group samples were not spiked with ST ATCC 14028. Lastly, the spiked samples were individually analyzed using the SD-LAMP QBs-labelled LFIAS method. Food samples were purchased from a local supermarket in Guangzhou and were confirmed to be free of ST by the standard culture-based method.
《3. Results and discussions》
3. Results and discussions
《3.1. The feasibility of SD-LAMP》
3.1. The feasibility of SD-LAMP
The four primers (F3, B3, FIP, and BIP) and SD probe were used to amplify and detect the ST-specific DNA sequence (Table 1 and Fig. S1 in Appendix A). As shown in Appendix A Fig. S2, ladderlike patterns and visual turbidity in the form of white precipitate were observed in the positive reactions but not in the negative and blank controls, which indicated that this SD-LAMP amplification system was feasible. In contrast, standard LAMP generated spurious amplicons (as seen in the negative control of Appendix A Fig. S3). Real-time SD-LAMP also revealed that target binding to the SD probe initiated a strand exchange reaction that would lead to the displacement of Fd from the SD probe, thus exciting the fluorophore on the Fd (Appendix A Fig. S4). Hence, the utility of the SD probe in LAMP did not affect the amplification reaction, and false-positive amplicons could be discriminated from primer amplification artifacts generated in the absence of specific target DNA.
《Table 1》
Table 1 The sequences of primers used in this study.

a The amplification efficiency of FITC labelled on the BIP was better than FITC labelled on the FIP, which can be seen in Appendix A Fig. S1.
《3.2. Characterization of QBs–mAb1》
3.2. Characterization of QBs–mAb1
Based on the coupling method, QBs were coupled with an antiFITC monoclonal antibody to prepare QBs–mAb1 conjugates. Fig. 2(a) shows that QBs had a quasi-spherical shape with numerous CdSe/ZnS QDs embedded into the polymer matrix; the QBs possessed good homogeneity and dispersity. To confirm the conjugation process, free and bio-conjugated QBs were investigated using UV–vis absorption and fluorescence spectra images. Fig. 2(b) shows the UV–vis absorption spectra. It was obvious that the UV–vis absorption of QBs–mAb1 had a characteristic antibody peak at around 278 nm, while QBs did not have this peak, indicating that the antibody had bound to QBs. This can also be observed in Fig. 2(c) because the position of the emission band did not shift significantly upon conjugation with mAb1, but the FI declined. These phenomena are believed to be caused by the organic layer of QBs surrounding mAb1. Furthermore, because the QBs–mAb1 conjugates were larger than QBs of the same batch, QBs migrated through the gel faster than QBs–mAb1 during agarose gel electrophoresis (Appendix A Fig. S5), and the average hydrodynamic particle size was increased (Appendix A Fig. S6). These results demonstrated that the QBs–mAb1 conjugates were successfully prepared and could be used to develop LFIAS for the detection of SD-LAMP products.
《Fig. 2》

Fig. 2. Characterization of QBs and QBs-mAb1 conjugates. (a) TEM images of synthesized QBs, (b) UV–vis absorption, and (c) fluorescence emission spectra of free QBs (black line) and QBs–mAb1 conjugates (red line). a.u.: arbitrary unit.
《3.3. Optimization of the experimental conditions》
3.3. Optimization of the experimental conditions
To achieve the best analytical performance of the SD-LAMP QBs-labelled LFIAS, three key factors—the properties of QBs– mAb1, the volume of labelling solution added on conjugate pad, and the concentration of antibody coating the T line—were optimized. First, the amount of mAb1 bound to QBs greatly influenced the binding ability of QBs–mAb1. If the amount of mAb1 was too small, the sensitivity would be low. However, if the amount was too high, the chemical and colloidal stability of QBs–mAb1 would decrease, resulting in particle aggregation. The effect of the ratio of mAb1 to QBs was studied by testing mAb1 concentrations of 20, 50, 100, 150, 200, 250, and 300 μg with a fixed QBs concentration of 1 mg. As shown in Appendix A Fig. S7(a), the FI of the conjugation solution increased sharply with increasing concentration of mAb1 at lower concentrations, reaching its maximum at 250 μg·mg–1 , followed by a decrease. Therefore, the coupling ratio of 250:1 (μg:mg) was selected as the optimum for the preparation of QBs–mAb1. Next, we investigated the effect of labelling volume on the LFIAS. Consequently, different volumes (2, 4, 6, 8, 10, and 12 μL) of QBs-mAb1 were added onto 1 cm per conjugate pad, and the FI of the T and C lines was recorded. Appendix A Fig. S7(b) shows the relationship between the FIT/FIC ratio and different labelling volumes. The addition of 8 μL QBs-mAb1 onto 1 cm of the conjugate pad provided a satisfactory response with the highest FIT/FIC ratio. In addition, the concentration of mAb2 coated on the T line was optimized to further improve the fluorescent response of the QBs-labelled LFIAS. Different concentrations of mAb2 within a range from 1 to 4 mg·mL–1 were evaluated. As shown in Appendix A Fig. S7(c), the FI of the T line increased to a plateau with increasing concentrations of mAb2 up to 3 mg·mL–1 . Meanwhile, the FI of the C line was relatively higher. Based on this analysis, 2 mg·mL–1 was chosen as the optimal concentration of mAb2 for the T line.
《3.4. Assay specificity》
3.4. Assay specificity
The specificity results are presented in Fig. 3. As expected, only ST strains displayed a high QBs fluorescence signal on the T and C lines, and no fluorescence signal was observed on the T line for non-ST strains and for the blank control. Furthermore, LFIAS results were consistent with the agarose gel outputs for PCR and SD-LAMP, indicating that ST detection was accurate. Therefore, our method exhibited a very high specificity, which could be attributed to the application of SD probes and the capturing ability of the LFIAS.
《Fig. 3》

Fig. 3. Specificity of QBs-labelled LFIAS detection of ST. Evaluation was based on electrophoretic analysis of the (i) PCR and (ii) SD-LAMP products and detection through (iii) the QBs-labelled LFIAS. (a) DNA templates from target Salmonella (Lanes 1–10: ST of ATCC 14028, FSCC(I) 215588, FSCC(I) 215635, FSCC(I) 215655, FSCC(I) 215189, FSCC(I) 215125, FSCC(I) 215141, FSCC(I) 215141, FSCC(I) 215031, FSCC(I) 215036). (b) DNA templates from non-target Salmonella serovars (Lanes 1–11: ST, S. Enteritidis, S. Derby, S. Indiana, S. Stanley, S. Agona, S. Infantis, S. Rissen, S. Albany, S. London, S. Meleagridis). (c) DNA templates from non-Salmonella strains (Lanes 1–11: ST, Escherichia coli, Cronobacter sakazakii, Vibrio parahaemolyticus, Staphylococcus aureus, Pseudomonas aeruginosa, Bacillus cereus, Listeria monocytogenes, Campylobacter jejuni, Yersinia enterocolitica, and Proteus mirabilis), Lane C: blank control, Lane M: DL2000 DNA marker.
《3.5. Assay sensitivity》
3.5. Assay sensitivity
As shown in Fig. 4(a), the fluorescence photograph of the test strips was clear, and the brightness of the T line increased with increasing concentrations of bacteria. The visual LOD of the LFIAS, which was defined as the lowest bacterial concentration that can be seen under UV light, was 103 CFU·mL–1 . By analyzing the FI of the T and C line, a calibration curve was obtained by determining the FIT/FIC values of bacterial standard solutions against their concentration (Fig. 4(b)). A good linear relationship ranging from 102 to 107 CFU·mL–1 was achieved with a correlation coefficient (R2 ) of 0.9669, and the calculated LOD was 10–1 CFU·mL–1 . Additionally, the sensitivity of QBs-labelled LFIAS was compared to that of traditional AuNPs-labelled LFIAS using the same amplification product. From the results shown in Appendix A Fig. S8, the visual LOD of AuNPs-labelled LFIAS was 104 CFU·mL–1 , which was ten-fold lower of sensitivity than that of QBs-labelled LFIAS. The fluorescence method based on QBs can offer advantages over other analytical methods, such as flow cytometry (104 CFU·mL–1 ) [26] and surface plasmon resonance (105 CFU·mL–1 ) [27] in terms of sensitivity with the relatively low LOD. Other studies in which LAMP and LAMP-LFISA were applied to detect different target species have demonstrated generally comparable sensitivity to that of the current study. For example, Wachiralurpan et al. [28] reported that the sensitivity of LAMP assay for the detection of Listeria monocytogenes in pure culture was 2.82 × 10³ CFU·mL–1 . Some studies established that the LOD of LAMP-LFISA is lower than our detection limit, with reported detection limits of 20 [29] and 6.7 CFU·mL–1 [30]. We think that these differences may reflect the different components including the optimized system and variations in concentrations, such as the amount of DNA template added. Some studies specify the use of 1.5 μL of DNA template for LAMP [31], whereas other methods require 5 μL of DNA template [32,33]. In addition, the other advantage of our method over the ordinary LAMPLFISA was that the addition of the SD probe into the LAMP system mitigated spurious amplification and nonspecific detection in our easy-to-use LFISA, improving the utility of LAMP outside a laboratory.
《Fig. 4》

Fig. 4. Sensitivity of the QBs-labelled LFIAS for genomic DNA. (a) Results of the sensitivity test by (i) PCR, (ii) SD-LAMP, and (iii) QBs-labelled LFIAS, using 10-fold serial dilutions of purified target DNA from ST ATCC 14028. Lanes 1–8: 107 –100 CFU·mL–1 template DNA, Lane C: blank control, Lane M: DL2000 DNA marker. (b) Calibration curve of ST detection using the QBs-labelled LFIAS. Error bars represent the standard deviation of three repeated experiments.
《3.6. Detection in food samples》
3.6. Detection in food samples
To further demonstrate the applicability of our method for food sample analysis, potable water, orange juice, lettuce, and chicken were used. Images of the test strips are shown in Fig. 5. The FI of the T line gradually faded as the spiked concentration decreased, which agreed with the results of the standard bacterial solutions described above. The visual LOD of ST in potable water, orange juice, lettuce, and chicken was 103 , 104 , 104 , and 105 CFU·mL–1 , respectively. Compared to the LOD in pure bacterial solution, the decrease in sensitivity was due to a decrease in SD-LAMP reaction efficiency or more residual QBs–mAb1 on the conjugate pad, indicating that the method was valid for ST detection in food samples with little or no matrix effect on the results. Thereafter, the correlation between the observed data and actual data was further analyzed (low, medium, and high levels of standard analyte solutions were added to the tested samples), and the results displayed in Table 2 indicate that the average recovery for the spiked ST is in the range of 85%–110% with relative standard deviation (RSD) values all below 7.8%.
《Fig. 5》

Fig. 5. Detection results of ST in food samples of (a) potable water, (b) orange juice, (c) lettuce, and (d) chicken by QBs-labelled LFIAS. The red rectangular box represents the lowest visual LOD.
《Table 2》
Table 2 Recovery efficiency of ST spiked in food samples on the proposed strategy.
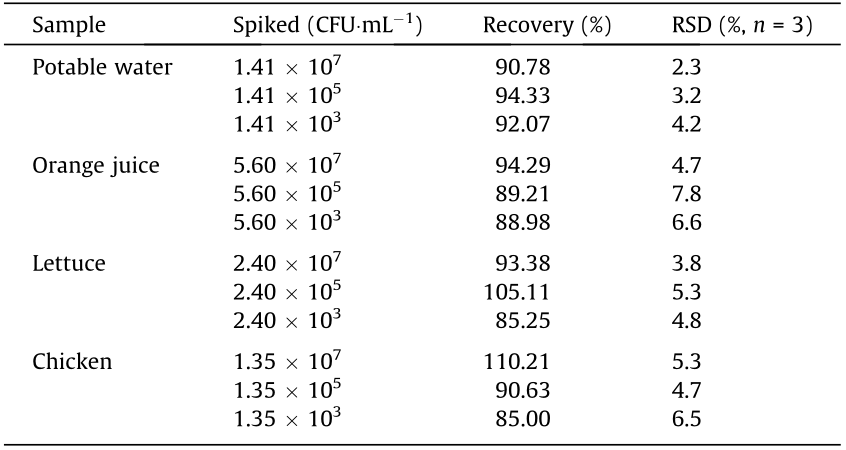
RSD: relative standard deviation.
Overall, the newly developed method could to analyze bacteria from food samples after appropriate dilution with high accuracy and sensitivity. Some sample pre-treatment steps, such as selective enrichment culture [34] and immunomagnetic separation technique [35], which when used before matrix application can enhance the analytes of interest. The limitation of this method is that it was unable to distinguish viable cells from dead ones because the detection target was free DNA. However, DNA binding dyes, such as ethidium monoazide (EMA) and propidium monoazide (PMA) [36], can overcome this question challenge if adding them added into samples before extraction of genomic DNA for the SD-LAMP reaction.
《4. Conclusions》
4. Conclusions
In summary, QBs-labelled LFIAS combined with SD-LAMP was constructed for the rapid detection of ST. The proposed method employed QBs-labelled LFIAS as a signal output platform, whereas the SD-LAMP reaction was implemented to further enhance specificity. As a result, an LOD of 10–1 CFU·mL–1 was achieved with a linear range from 102 to 107 CFU·mL–1 . The method was applied for the detection of ST in food samples, and satisfactory results were obtained. Compared to existing methods, the merits of our development are as follows: ① The SD probe is applied to LAMP to reduce the occurrence of false-positive results; and ② the sensitivity is improved by employing QBs, instead of AuNPs, as probes in the LFIAS. Overall, the current method is not only simple and convenient, eliminating the requirement for sophisticated equipment, but also allows for rapid and sensitive analysis, yielding qualitative and quantitative results. By changing the target LAMP primers, this method can be extended to detect other types of pathogens. In future research, we will add rapid sample pre-treatment steps to improve the sensitivity of the system and explore combinations of SD probes with other isothermal nucleic acid amplification techniques for equipment-free detection. With its excellent performance, we believe that this method can be easily applied for genetic testing in a wide range of fields.
《Acknowledgments》
Acknowledgments
This work was supported by the National Key Research and Development Program of China (2019YFC1606300), the Local Innovative and Research Teams Project of Guangdong Pearl River Talents Program (2017BT01S174), and the Guangdong Academy of Sciences Special Project of Implementing Innovation-Driven Development Capacity Building (2018GDASCX-0401).
《Compliance with ethics guidelines》
Compliance with ethics guidelines
Yuting Shang, Shuzhen Cai, Qinghua Ye, Qingping Wu, Yanna Shao, Xiaoying Qu, Xinran Xiang, Baoqing Zhou, Yu Ding, Moutong Chen, Liang Xue, Honghui Zhu, and Jumei Zhang declare that they have no conflict of interest or financial conflicts to disclose.
《Appendix A. Supplementary data》
Appendix A. Supplementary data
Supplementary data to this article can be found online at https://doi.org/10.1016/j.eng.2021.03.024.


 京公网安备 11010502051620号


