
《1. Introduction》
1. Introduction
Tissue- or cell-specific biomarkers, such as alanine aminotransferase (ALT), aspartate aminotransferase (AST), and alkaline phosphatase (ALP), are mainly used to detect and evaluate liverspecific injury [1]. The principle of damage detection is largely based on the fact that, when tissue damage occurs, the markers in the tissue are released into the serum after the corresponding injury, regardless of whether the damage is caused directly by toxic compounds or caused by secondary attack as a result of toxic compound-induced inflammation in the body. Therefore, an ideal damage biomarker should have the ability to distinguish between direct damage and indirect damage caused by inflammation. Before and after the injury, the biomarkers in the serum and the injured tissue should be causally inversely correlated. We use the term ‘‘retrospective validation of biomarkers of injury” to define this mutual verification method.
Pathomorphological analysis of tissue changes after tissue injury is a method for nonquantitative morphological tracking or retrospective validation. In this sense, it is regarded as a gold standard [2]. Unfortunately, pathological analysis is a qualitative rather than quantitative analysis method, and its precision and accuracy are severely limited by the location of the sample, observer’s experience, staining method, rough measurement method, and other factors. In addition, pathological changes in injured tissues can result from various reasons, including direct damages caused by compounds and indirect damage caused by inflammation. So, pathomorphological analysis cannot provide accurate information about injury mechanisms. Furthermore, the inflammatory biomarkers do not reflect the severity of injury, though inflammation is indirectly associated with injury. Although, inflammatory cytokines such as interleukin (IL)-1β, IL-18, and IL-6 are often used to assess the severity of an injury. These markers usually exist in low abundance in the tissue prior to an injury and will increase after an injury when the secondary attack occurs in damaged tissues. Therefore, these cytokines mainly represent inflammation rather than direct damage [3,4]. Thus, to characterize direct injuries of tissues, especially those non-inflammatory injuries (e.g., direct drug-induced injuries that usually occur prior to inflammation), specific biomarkers that allow for self-controlled validation are urgently needed.
Injury markers are typically highly abundant in the damaged tissues and will readily fall off from the tissue and enter circulation after injury. However, most of the widely used biomarkers are not expressed in a tissue or cell type-specific manner and often lack the basic characteristics of the corresponding tissue. For example, in addition to its expression in the liver, ALT is highly expressed in muscle cells; AST is also expressed in a variety of other cell types, including dendritic cells and monocytes [5,6]. Moreover, the expression of these biomarkers is upregulated after injury and inflammatory stimulation, which is more likely related to inflammation instead of an outcome of cell damage. As such, these biomarkers cannot be used to strictly distinguish damage from inflammation. Furthermore, the lack of relevant information about initial conditions makes it hard to quantitatively evaluate the magnitude of tissue injures via these biomarkers or their combination. Therefore, it is necessary to find new biomarkers which can reflect both injury sources and the magnitude of injures.
In order to determine whether certain tissues or organs have experienced specific forms of damage, it would theoretically be better to track the levels of biomarkers in the corresponding tissues simultaneously in order to determine the source and find out whether the levels of biomarkers increase in the serum and concurrently decrease in the tissues. That is, the activity of some high-abundance proteins or enzymes that are released into the bloodstream after tissue or cell injury would be reduced in the corresponding damaged tissues or organs without interference from other factors such as inflammation. In this study, we propose a new tracking verification method that involves detecting the residual activities of specific biomarkers in tissue and comparing their activities in serum and in tissue before and after an injury. This method will help to improve the accuracy and specificity of the identified candidate biomarkers of injury. By comparing the levels of a given biomarker in normal versus damaged tissue, affected tissue can be identified and the degree of specific tissue damage can be assessed. In combination with other mechanisms, such as biomarkers of inflammation, this method will help to determine the underlying mechanisms involved in injury and provide accurate and improved therapeutic strategies.
Carboxylesterase 1 (CES1) is a membrane protein that is highly expressed in the liver; it has the potential to be a liver-specific biomarker for the assessment of the extent of liver injury [7]. Dipeptidyl peptidase 4 (DPP-IV) exists on the surface of the kidney, spleen, small intestine tissue, and lymphocytes [8]. These two proteins can be released into the serum after injury; however, their associated pathophysiological significance is entirely different. The increased activity of DPP-IV in serum after an injury is likely to be caused by inflammation [9]. Therefore, DPP-IV and CES1 can be used as cross-references to identify the extent of damage in intrahepatic and extrahepatic tissue and to determine whether liver inflammation is involved. Theoretically, compared with conventional serum markers such as ALT, ALP, and AST, CES1 is more abundant in the liver [10,11] and holds potential to be a more specific biomarker of liver injury. In our previous experimental damage studies using in vitro cell culture models, we found that the residual activity of the CES1 enzyme in the cell is negatively correlated with free CES1 activity in the medium [12]. However, there are fewer interference factors at the cellular level, and it is necessary to validate the role of CES1 as a biomarker of liver injury in a model on a systemic level.
Studies have reported that a diagnosis of coronavirus disease 2019 (COVID-19) combined with liver injury is a problem that demands a prompt solution in clinical practice [13–15]. In particular, accurate and early diagnosis of liver injury is necessary in COVID-19 patients who have been hospitalized or in patients with pre-existing metabolic liver disease [16,17]. According to a study by Cai et al. [18], who analyzed 318 patients with abnormal liver function test results during COVID-19 hospitalization, hepatocyte type accounted for 20.75%, cholestatic type accounted for 29.25%, and mixed type accounted for 43.40%. These data indicate that the liver and bile duct endothelial cells of COVID-19 patients are damaged. Furthermore, several studies have reported that DPP-IV participates in the severe acute respiratory syndrome coronavirus 2 (SARS-CoV-2) infection process [19,20], so DPP-IV inhibitors may be beneficial in COVID-19 patients [21]. Traditional Chinese medicine (TCM) has been used to treat and prevent COVID-19 infection, and has demonstrated beneficial effects for patients, including faster recovery of patients with suppressed inflammation and shorter hospital stays [22,23]. In the sixth edition of the Guidelines for the diagnosis and treatment of COVID-19 issued by the National Health Commission of the People’s Republic of China on 18 February 2020, Qing Fei Pai Du Decoction (QFPDD) is recommended as a general Chinese medicine prescription for the treatment of COVID-19 patients [24,25]. However, the role of QFPDD in detoxification and its treatment effects for liver injury are still unclear, making further systematic studies necessary. It has been widely accepted that α-naphthylisothiocyanate (ANIT) is a hepatobiliary system-specific damaging agent, and it is often used to induce acute intrahepatic cholestasis liver injury in rodents [26]. ANIT is metabolized by cytochrome P450 enzymes; it can also be directly combined with glutathione (GSH), and then transported into the bile through transporters such as multidrug resistance associated protein 2 (Mrp2) [27]. The released ANIT can damage the bile duct epithelial cells, resulting in decreased bile flow, the accumulation of liver bile acid, and liver cell necrosis [28]. Therefore, ANIT is ideal to use to induce specific liver injury in rats, and the resulting ANIT model may recapitulate the pathological features of liver cholestasis injury caused by COVID-19 to some extent.
This study aims to evaluate the potential of the two biomarkers CES1 and DPP-IV for the accurate tracking of liver-specific injury and to evaluate whether QFPDD has a therapeutic protective effect on acute cholestatic liver damage. For this purpose, we established a rat model of ANIT-induced liver-specific injury, and then compared the levels of CES1 and DPP-IV with the corresponding pathological changes, the levels of conventional serological biomarkers of injury, and inflammation and bile acid profiling after liver injury.
《2. Materials and methods》
2. Materials and methods
《2.1. Reagents》
2.1. Reagents
QFPDD medicinal materials (1 kg), which were provided by the Xinmiao Liang Laboratory (Dalian Institute of Chemical Physics, Chinese Academy of Sciences, China), were dissolved in 10 L of H2O and concentrated to 102 g of powder to prepare the water extract. According to the national standard of QFPDD, a prescription containing 10 times the concentrated essence was prepared (lot number: QFP1-10NS + XX-PG-20062). The components were then analyzed by high-pressure liquid chromatography qualitative time-of-flight high-resolution mass spectrometry (UHPLC-Q-TOFHRMS) (Waters corporatin, USA) (Fig. S1 in Appendix A). The identified constituents are listed in Table S1 in Appendix A. Ursodeoxycholic acid (UDCA) was obtained from TCI (Shanghai) Development Co., Ltd. (China), ANIT was obtained from Sigma-Aldrich (USA), and both pelltobarbitalum natricum and dimethylsulfoxide (DMSO) were obtained from Sinopharm Chemical Reagent Co., Ltd. (China). The two probes N-alkylated D-luciferin methyl ester (NLMe) for CES1 [7] and glycyl-prolyl-N-butyl-4-amino-1,8-naphthalimide (GP-BAN) for DPP-IV [9] were synthesized by our laboratory. Luciferin detection regent (LDR; V8291) was purchased from Promega (USA). IL-1β, IL-6, and IL-18 enzyme-linked immunoassay (ELISA) kits were purchased from Multi Sciences (Lianke) Biotech Co., Ltd. (China). ALT, AST, ALP, and  -glutamyl transpeptidase (-GT) assay kits were purchased from WeiFang Xinze Biotechnology Co., Ltd. (China).
《2.2. Rat model of ANIT-induced cholestatic liver injury and drug administration》
2.2. Rat model of ANIT-induced cholestatic liver injury and drug administration
Male Sprague-Dawley (SD) rats ((200 ± 20) g) were purchased from Zhejiang Weitong Lihua Laboratory Animal Technology Co., Ltd. (China). All animal studies (including the rat euthanasia procedure) were approved by Zhejiang Weitong Lihua Laboratory Animal Technology Co., Ltd. After 5 d of adaptive feeding, the animals were used for further study. For the time-course study (Fig. S2 in Appendix A), the animals were randomly divided into two groups: In the ANIT model group (ANIT, n = 8), the rats were given ANIT pre-dissolved in corn oil; in the control group (n = 8), the rats were given the same volume of corn oil. After ANIT intragastrical administration (200 mg·kg–1 , intragastric administration (i.g.)), blood was collected from the orbit at six time points until 72 h, and then the rats were euthanized with intraperitoneal injection (i.p.) of sodium pentobarbital (200 mg·kg–1 , i.p.). Serum was isolated and subjected to analysis for conventional and new serological markers.
《Fig. 1》

Fig. 1. The protocol of biomarker validation and drug treatment. Rats were given ANIT (200 mg·kg–1 , i.g.) at 0 h. A high dose of QFPDD (QFPDD-H; 1800 mg·kg–1 , i.g.) or a low dose of QFPDD (QFPDD-L; 900 mg·kg–1 , i.g.) or UDCA (60 mg·kg–1 , i.g.) was given at 36 and 48 h, respectively. Bile was collected at four time intervals from 48–49 h (defined as 49 h#), 49–50 h (defined as 50 h#), 50–52 h (defined as 52 h#), and 52–54 h (defined as 54 h#) after QFPDD or UDCA administration. Bile was collected at four time points (49, 50, 52, and 54 h), and the bile volume was measured. The levels of AST, ALT, ALP, -GT, CES1, DPP-IV, and inflammatory markers (IL-1β, IL-6, and IL-18) were analyzed in serum and liver tissue S9. The bile acid composition of rat serum, liver, and bile were analyzed by ultra-performance liquid chromatography tandem mass spectrometry (UPLC-MS/MS) respectively.
For the drug treatment study (Fig. 1), the animals were randomly divided into six groups (n = 6–8). UDCA or QFPDD were preprepared and dissolved in deionized water, and ANIT was dissolved in corn oil. The animals in the normal control group were given 10 mL of corn oil, while those in the QFPDD high-dose control group were given 1800 mg·kg–1 of QFPDD. The rest of the rats were given ANIT (200 mg·kg–1 , i.g.) to induce cholestasis. After the administration of ANIT, the rats were treated with a high dose of QFPDD (QFPDD-H; 1800 mg·kg–1 , i.g.), a low dose of QFPDD (QFPDD-L; 900 mg·kg–1 , i.g.), or UDCA (60 mg·kg–1 , i.g.) twice, at 36 and 48 h, respectively. ANIT and the dosing schedule were carried out according to Fig. 1. At the end of the second administration (i.e., at 48 h), the rats were anesthetized with sodium pentobarbital (50 mg·kg–1 , i.p.) and subjected to bile duct intubation. The bile efflux was collected at four time fractions (48–49, 49–50, 50–52, and 52–54 h). The bile volume was measured, and the total amount of bile was calculated. We conducted the operation within 6 h to ensure minimal traumatic injury to the animals caused by the bile duct intubation operation. The animals were euthanized, and the whole blood of the abdominal aorta and the tissues were collected. The liver weight was recorded. A small piece of the liver was fixed in 10% formalin solution for pathological analysis, and the remaining part was tested for the bile acid profile and biomarkers.
《2.3. Pathological analysis of liver tissue》
2.3. Pathological analysis of liver tissue
Fixed liver tissues were stained with hematoxylin and eosin (H&E) and subjected to pathological analysis, which included degeneration, inflammation, and necrosis, according to the work of Bedossa et al. [29] and Cullen et al. [30]. Hepatic and biliary injury were scored as follows: 0, no hepatocytes showed necrosis or degeneration and no inflammatory cell infiltration was present; 1, there was minimal degeneration, necrosis, or inflammatory cell infiltration of isolated hepatocytes scattered around the portal area and next to a central vein; 2, hepatocytes were moderately scattered around the portal area and central vein with degeneration, necrosis, or inflammatory cell infiltration, and there were visible necrotic biliary epithelial cells in the bile ducts; and 3, there were severe and large areas of degeneration, necrosis, or inflammatory cell infiltration in patchy liver cells around the portal area, and infiltration had occurred around the portal area and central vein. The scores for degeneration, necrosis, and inflammation were calculated respectively.
《2.4. Examination of classic serological markers》
2.4. Examination of classic serological markers
The activities of ALT, AST, ALP, and -GT were measured according to the manufacturer’s instructions (WeiFang Xinze Biotechnology) by using a fully automatic biochemical detector (Hitachi, Japan). The activity unit of the marker in the serum is expressed as units per liter (U·L–1). The activities of ALT, AST, ALP, and -GT in liver were calculated as follows: total activity (U per liver) = specific activity (U per milligram protein) × total protein (milligram per liver).
《2.5. Analysis of bile acid composition》
2.5. Analysis of bile acid composition
The bile, serum, and liver tissue S9 were collected from the rats for bile acid profiling. The rat liver tissue (10 mg in 0.02 mL of H2O2) was used to prepare a cell suspension, which was followed by the addition of 0.18 mL of acetonitrile and methanol mixture solution (v/v = 8:2) [31]. The bile or serum samples were diluted with 50% methanol–water at 1:1000. Next, an aliquot of 0.05 mL was added to 0.4 mL of a mixed solution of acetonitrile and methanol (v/v = 8:2), which was followed by centrifugation at 4000g (g = 9.8 m·s–2 ) (FiberliteTM F21-48X2; Thermo Fisher Scientific, USA) for 30 min at 4 °C. The frozen supernatant (0.25 mL) was re-dissolved with 0.04 mL of acetonitrile and methanol solution (v/v = 8:2) and 0.06 mL of deionized water, followed by centrifugation. Bile acids were detected by means of ultra-performance liquid chromatography tandem mass spectrometry (UPLC-MS/MS; ACQUITY UPLC-Xevo TQ-S; Waters Corporation, USA) and analyzed by software MassLynx (v4.1; Waters Corporation) platform, integration, and bile acid quantification [32].
《2.6. Analysis of serum cytokines》
2.6. Analysis of serum cytokines
ELISA kits were used to measure the levels of IL-1β, IL-6, and IL18 in serum and liver tissue S9 in accordance with the manufacturer’s instructions (Multi Sciences (Lianke) Biotech Co., Ltd.). The absorbance at 450 nm was read by Multiskan MK3, microplate reader (Thermo Fisher Scientific).
《2.7. Preparation of S9 fraction of liver tissue》
2.7. Preparation of S9 fraction of liver tissue
The liver tissue in phosphate-buffered saline (PBS) was homogenized at a low temperature and centrifuged at 9000 g at 4 °C for 20 min. After the separation of mitochondria (i.e., S9), the supernatant was collected.
《2.8. CES1 and DPP-IV detection》
2.8. CES1 and DPP-IV detection
An incubation reaction with a total volume of 0.1 mL was assembled with 0.002 mL of the CES1 specific probe substrate NLMe, which had been developed by our laboratory [12], 0.005 mL of liver tissue S9 or serum, and 0.093 mL of PBS (pH 6.5). Serum or liver tissue S9 and PBS were preincubated at 37 °C for 3 min. Luciferin was added to start the luminescence reaction for 10 min. The testing was performed on a white 96-well plate, and the signal value was obtained through a full wavelength scan that represented the amount of N-alkylated D-luciferin (NL) produced by NLMe per minute, which is also the enzymatic activity of CES1. In this study, the levels of CES1 in serum and liver tissue S9 were measured. The enzyme activity of CES1 in liver tissue S9 was expressed as the total activity. The total CES1 activity was calculated as follows: total CES1 activity (U per liver) = specific CES1 activity (U per milligram protein) × total protein (milligram per liver). The total number of activity units was calculated as follows: total activity unit (U) = metabolic rate of NLMe hydrolyzed by CES1 per minute (μmol·min–1 ).
The probe substrate GP-BAN used to detect the enzymatic activity of DPP-IV was synthesized as previously described [9]. The incubation reaction, with a total volume of 0.2 mL, contained 0.002 mL of GP-BAN, 0.002 mL of serum or liver tissue S9, and 0.196 mL of PBS (pH 7.4). Serum or liver tissue S9 was preincubated with PBS at 37 °C for 3 min, and then 0.002 mL of GP-BAN was added to start the reaction. The reaction mixture was incubated at 37 °C for 20 min. To stop the reaction, 0.2 mL of ice acetonitrile was added, and the reaction was vigorously shaken for 0.5–1 min. The test used a black 96-well plate to pass detection with excitation and emission at 430/535 nm. In this study, DPPIV was tested in serum and liver tissue S9, and the enzyme activity of DPP-IV in liver tissue S9 was expressed as the total activity. The total CES1 activity was calculated as follows: total DPP-IV activity (U per liver) = specific DPP-IV activity (U per milligram protein) × total protein (milligram per liver). The total number of activity units was calculated as follows: total activity unit (U) = the metabolic rate of GP-BAN hydrolyzed by DPP-IV per minute (μmol·min–1 ).
《2.9. Statistical analysis》
2.9. Statistical analysis
All statistical analyses were performed using statistical product and service solutions (SPSS) (v21.0; IBMCorp, USA) and GraphPad Prism version 8.0 (GraphPad Software, USA). The results were expressed as the mean ± standard error of mean (SEM), and the statistical significance of the differences (P < 0.05) was analyzed using one-way or two-way analysis of variance (ANOVA), with multiple comparisons being used to compare each group. The results were correlated in pairs through correlation matrix analysis. The correlation analysis was mainly carried out using iMAP software (v1.0; Metabo-Profile, China).
《3. Results》
3. Results
《3.1. Time-course changes of serum markers in the rat model of ANITinduced cholestatic liver injury》
3.1. Time-course changes of serum markers in the rat model of ANITinduced cholestatic liver injury
To observe the dynamic changes of the serological markers due to ANIT-induced liver injury, we examined the levels of conventional (ALT, AST, ALP, and -GT) and new (CES1 and DPP-IV) markers over time after ANIT treatment. As shown in Figs. S3(a)–(d) in Appendix A, the activities of ALT, AST, ALP, and -GT in serum significantly increased at 36–54 h post ANIT treatment, but gradually decreased afterwards (P < 0.05 vs 0 h), and the activity of AST even returned to a normal level. However, the levels of CES1 and DPP-IV increased slowly and remained at a high level at 54–72 h post ANIT administration (Figs. S3(e) and (f) in Appendix A), which indicates that CES1 and DPP-IV may reflect persistent liver injury better than the conventional serological markers.
《3.2. The effects of QFPDD or UDCA in the rat model of ANIT-induced cholestatic liver injury》
3.2. The effects of QFPDD or UDCA in the rat model of ANIT-induced cholestatic liver injury
As shown in Fig. S4(a) in Appendix A, the hepatocytes in the normal rats were arranged radially around the central vein of the liver, with lobules in a regular shape. In the ANIT group, overt bile duct necrosis and neutrophil infiltration were seen in the portal area, and lipid droplets in the hepatocytes were visible around the central vein. Furthermore, we noticed that there were significant differences between the pathological changes in the QFPDD group and those in the ANIT group. According to the pathological scores, the QFPDD-H treatment significantly reduced liver cell degeneration, necrosis, and inflammation, whereas QFPDD-L treatment significantly reduced liver cell degeneration and inflammation, while also exhibiting therapeutic effects on liver necrosis. In contrast, the UDCA treatment only attenuated hepatocyte degeneration (Fig. S4(b) in Appendix A). Our results show that both QFPDDH and QFPDD-L treatments may exert protective effects against ANIT-induced liver injury.
《3.3. Changes in bile flow in rat models of ANIT-induced cholestatic liver injury after QFPDD or UDCA treatment》
3.3. Changes in bile flow in rat models of ANIT-induced cholestatic liver injury after QFPDD or UDCA treatment
Bile was collected at four time intervals from 48–49 h (defined as 49 h#), 49–50 h (defined as 50 h#), 50–52 h (defined as 52 h#), and 52–54 h (defined as 54 h#) after QFPDD or UDCA administration, and the amounts of bile collected from the different treatment groups were measured (Fig. S5 in Appendix A). The results showed that the average bile flow of normal rats was about 500 μL·h–1 at 49 h#; it increased to 830 μL·h–1 at 52 h#, and then decreased to 650 μL·h–1 at 54 h#.
The bile flow of the ANIT model was significantly lower than that of the control rats, with an average bile flow of 3.5 μL·h–1 during the 48–54 h period (P < 0.01 vs normal control), which validated the successful establishment of the cholestasis rat model by means of ANIT administration. In the QFPDD-H treatment group, the average bile flow was 130 μL·h–1 at 49 h#; it increased to 400 μL·h–1 at 52 h#, but decreased to 70 μL·h–1 at 54 h#. The bile flow in the QFPDD-H treatment group was significantly elevated compared with that in the ANIT group (P < 0.01 vs ANIT). In the QFPDD-L treatment group, the average bile flow was 80 μL·h–1 at 49 h#; it increased to 160 μL·h–1 at 52 h#, but decreased to 35 μL·h–1 at 54 h#. the bile flow in the QFPDD-L treatment group has no significantly elevated (P ˃ 0.05 vs ANIT) but was still higher than that in the ANIT group. Together, these data suggest that QFPDD-H and, to a lesser extent, QFPDD-L have therapeutic effects on cholestasis.
In the UDCA treatment group, the average bile flow was 200 μL·h–1 at 49 h#; it increased to 370 μL·h–1 at 52 h# and then decreased to 110 μL·h–1 at 54 h#. Compared with the ANIT group, the bile flow in the UDCA treatment group was significantly increased (P < 0.05, P < 0.01 vs ANIT), suggesting that, in the ANIT model of cholestasis, UDCA exhibited a stronger effect on bile flow than QFPDD-L but a weaker effect than QFPDD-H. The average bile flow of the QFPDD-H control rats was 640 μL·h–1 at 49 h#; it increased to 650 μL·h–1 at 52 h#, but decreased further to 320 μL·h–1 at 54 h#. It was notable that the bile flow of the rats in all groups decreased significantly after bile duct intubation; a few rats even died due to post-surgery weakness.
《3.4. The effects of QFPDD or UDCA on bile acid profile in the rat model of ANIT-induced cholestatic liver injury》
3.4. The effects of QFPDD or UDCA on bile acid profile in the rat model of ANIT-induced cholestatic liver injury
A targeted quantitative analysis was performed for the 61 types of bile acid in the profile for rat bile, serum, and liver; among these, 34 types were detected in serum, 30 types in the liver, and 29 types in bile (Figs. 2–4). In the main text, we only show the data for the bile acids that significantly changed upon ANIT injury and in response to treatment; the other bile acids are shown in Fig. S6 in Appendix A.
In the serum, compared with normal rats, eight taurineconjugated bile acids increased significantly after ANIT administration (P < 0.05, P < 0.01 vs normal control) (Fig. 2(a)). In order, these bile acids were: tauroursodeoxycholic acid (TUDCA) (26.6%) < tauro-α-muricholic acid (TaMCA) (62.6%) < tauroursodeoxycholic acid (TDCA) (67.5%) < tauro-ω-muricholic acid (TxMCA) (78.9%) < tauro-β-muricholic acid (TbMCA) (88.1%) < taurochenodeoxycholic acid (TCDCA) (124.0%) < tricarboxylic acid (TCA) (66.3%) < taurohyodeoxycholic acid (THDCA) (9631.1%). Four types of major glycineconjugated bile acids showed a statistically significant increase and change (P < 0.05, P < 0.01 vs normal control) (Fig. 2(b)), as follows: glycodeoxycholic acid (GDCA) (6.0%) < glycochenodeoxycholic acid (GCDCA) (58.0%) < glycoursodeoxycholic acid (GUDCA) (250.3%) < glycocholic acid (GCA) (392.5%). Twenty types of free bile acids were detected in the serum (P < 0.05, P < 0.01 vs normal control) (Figs. 2(c) and S6(a)), nine of which showed a statistically significant increase after ANIT administration (P < 0.05, P < 0.01 vs normal control). In order, these are: chenodeoxycholine acid (CDCA) (1.7%) < α-muricholic acid (αMCA) (1.8%) < ω-muricholic acid (ωMCA) (3.8%) < ursocholic acid (UCA) (4.7%) < β-muricholic acid (βMCA) (12.2%) < cholic acid (CA) (14.5%) < 7-dehydrocholic acid (7-DHCA)(20.8%) < ursodeoxycholic acid-7-sulfate (UDCA-7S) (24.0%) < chenodeoxycholic acid-3-β-D-glucuronide (CDCA-3Gln) (683.0%). Other bile acids exhibited a rising trend without a statistical difference.
Compared with the ANIT group, after QFPDD-H treatment, a significant decreasing in most of bile acids in the serums (P < 0.05, P < 0.01 vs ANIT) (Fig. 2). The descending order of taurineconjugated bile acids were: TDCA (75.3%) > THDCA (48.7%) > TCDCA (29.0%) > TCA (19.0%) > TωMCA (14.4%), and the glycineconjugated bile acids were GDCA (71.1%) > GCA (54.3%), and the free bile acids were CDCA (90.3%) > UCA (88.3%) > CA (82.8%) > UDCA (74.1%) > βMCA (68.8%). Other bile acids appeared to decline without statistical significance. The QFPDD-L treatment resulted in significantly decreased levels in only the following bile acids (P < 0.05, P < 0.01 vs ANIT): CDCA (91.0%) > CA (73.0%) > βMCA (73.3%), and GCA (17.0%). After UDCA treatment, only the levels of GCA and CA were significantly reduced (58.6% and 44.3%, respectively; P < 0.05, P < 0.01 vs ANIT), while the levels of TUDCA, GUDCA, and UDCA increased. Treatment with QFPDD-H led to significantly reduced levels of 12 bile acids in serum compared with the ANIT group, suggesting a significantly stronger therapeutic effect than UDCA, especially in terms of reducing conjugated secondary bile acids.
《Fig. 2》
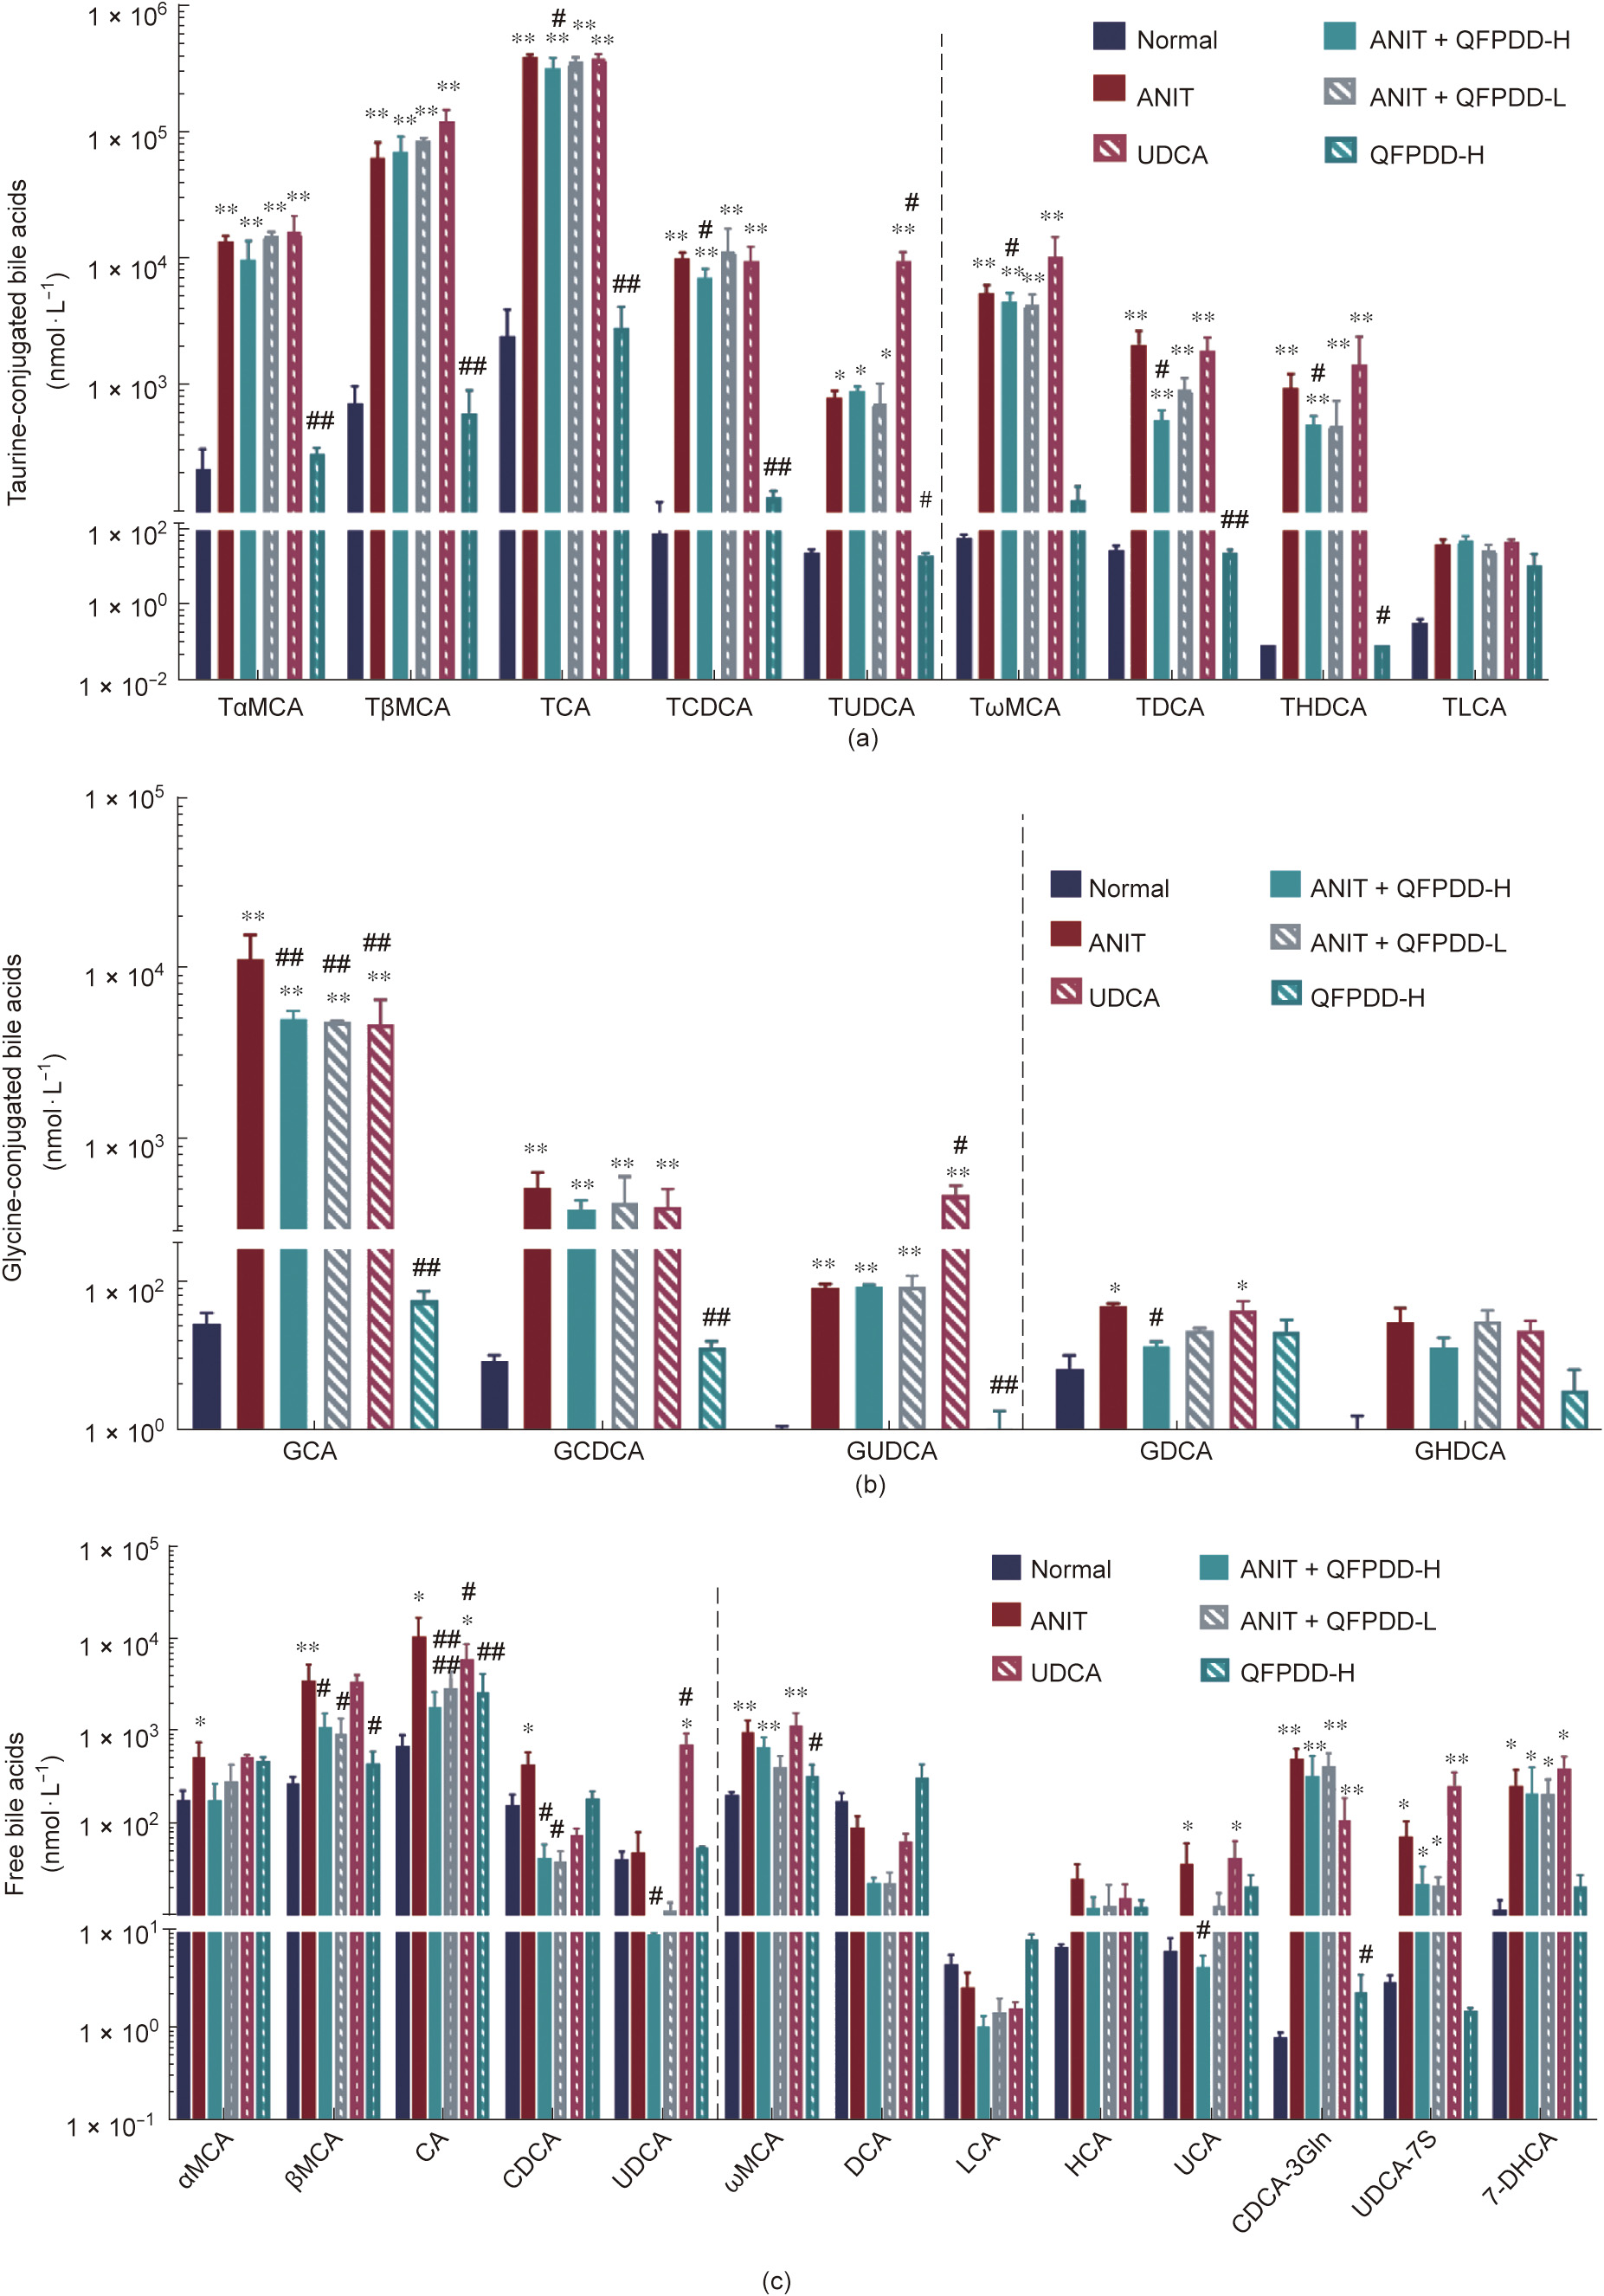
Fig. 2. The changes of bile acids profile in serum in the rat models of ANIT-induced cholestatic liver injury after QFPDD or UDCA treatment. The serum was collected at 54 h and used for bile acid profile analysis. (a) Changes of taurine-conjugated bile acids in serum; (b) changes of glycine-conjugated bile acids in serum; (c) changes of free bile acids in serum. The bars before the dotted line in the figure indicated primary bile acids, and the bars after the dotted line indicated secondary bile acids. *P < 0.05 vs normal control; **P < 0.01 vs normal control; #P < 0.05 vs ANIT; ##P < 0.01 vs ANIT.
In liver tissue, compared with normal rats, the ANIT model showed a significant increase in four taurine-conjugated bile acids (P < 0.01 vs normal control) (Fig. 3(a)). In order, these were as follows: TωMCA (11.7%) < TαMCA (22.8%) < TβMCA (38.1%) < TCA (46.5%). The levels of glycine-conjugated bile acids increased significantly in GCA (1.9%) and reduced significantly in GDCA (78.4%) (P < 0.05 vs normal control) (Fig. 3(b)). However, the levels of 10 free bile acids significantly decreased in the liver (P < 0.05, P < 0.01 vs normal control) (Fig. 3(c)); in descending order, these were dichloro-acetic acid (DCA) (98.5%) > CDCA (98.1%) > 12-keto lithocholic acid (12-ketoLCA) (98.0%) > αMCA (97.6%) > UCA (95.3%) > CA (86.2%) > ωMCA (85.0%) > βMCA (84.4%) > 12-dehydro cholic acid (12-DHCA) (82.5%) > UDCA (80.6%). The other bile acid changes are shown in Fig. S6(b).
Compared with the ANIT group, after QFPDD-H treatment, the levels of a fraction of taurine-conjugated bile acids were significantly reduced (P < 0.05 vs ANIT) (Fig. 3(a)); in descending order, these were TωMCA (64.0%) > TβMCA (47.0%), and the levels of glycine-conjugated bile acids decreased significantly in GCDCA (56.6%) and GCA (48.9%) (P < 0.05 vs ANIT) (Fig. 3(b)), while GUDCA has increased by UDCA treatment (450%, P < 0.05 vs ANIT). The levels of free bile acids increased (P < 0.05 vs ANIT) (Fig. 3(c)); in ascending order, these were αMCA (345.2%) < CA (369.4%) < CDCA (470.5%) < βMCA (1222.3%). The levels of other bile acids showed a risen trend without a significant difference. There was no pronounced difference in free bile acids after QFPDD-L and UDCA treatment, with only the levels of βMCA showing an increase (P < 0.05 vs ANIT). Generally speaking, the rangeability of the increase of bile acids in the liver was smaller than that in the serum, and the levels of the liver bile acids were lower than those of the serum bile acid concentrations. ANIT administration mainly induced an increase in the levels of bound primary bile acids and a decrease in the levels of free primary bile acids. Only QFPDD-H treatment significantly reduced the levels of bound primary bile acids in the liver and increased the levels of free primary bile acids.
《Fig. 3》
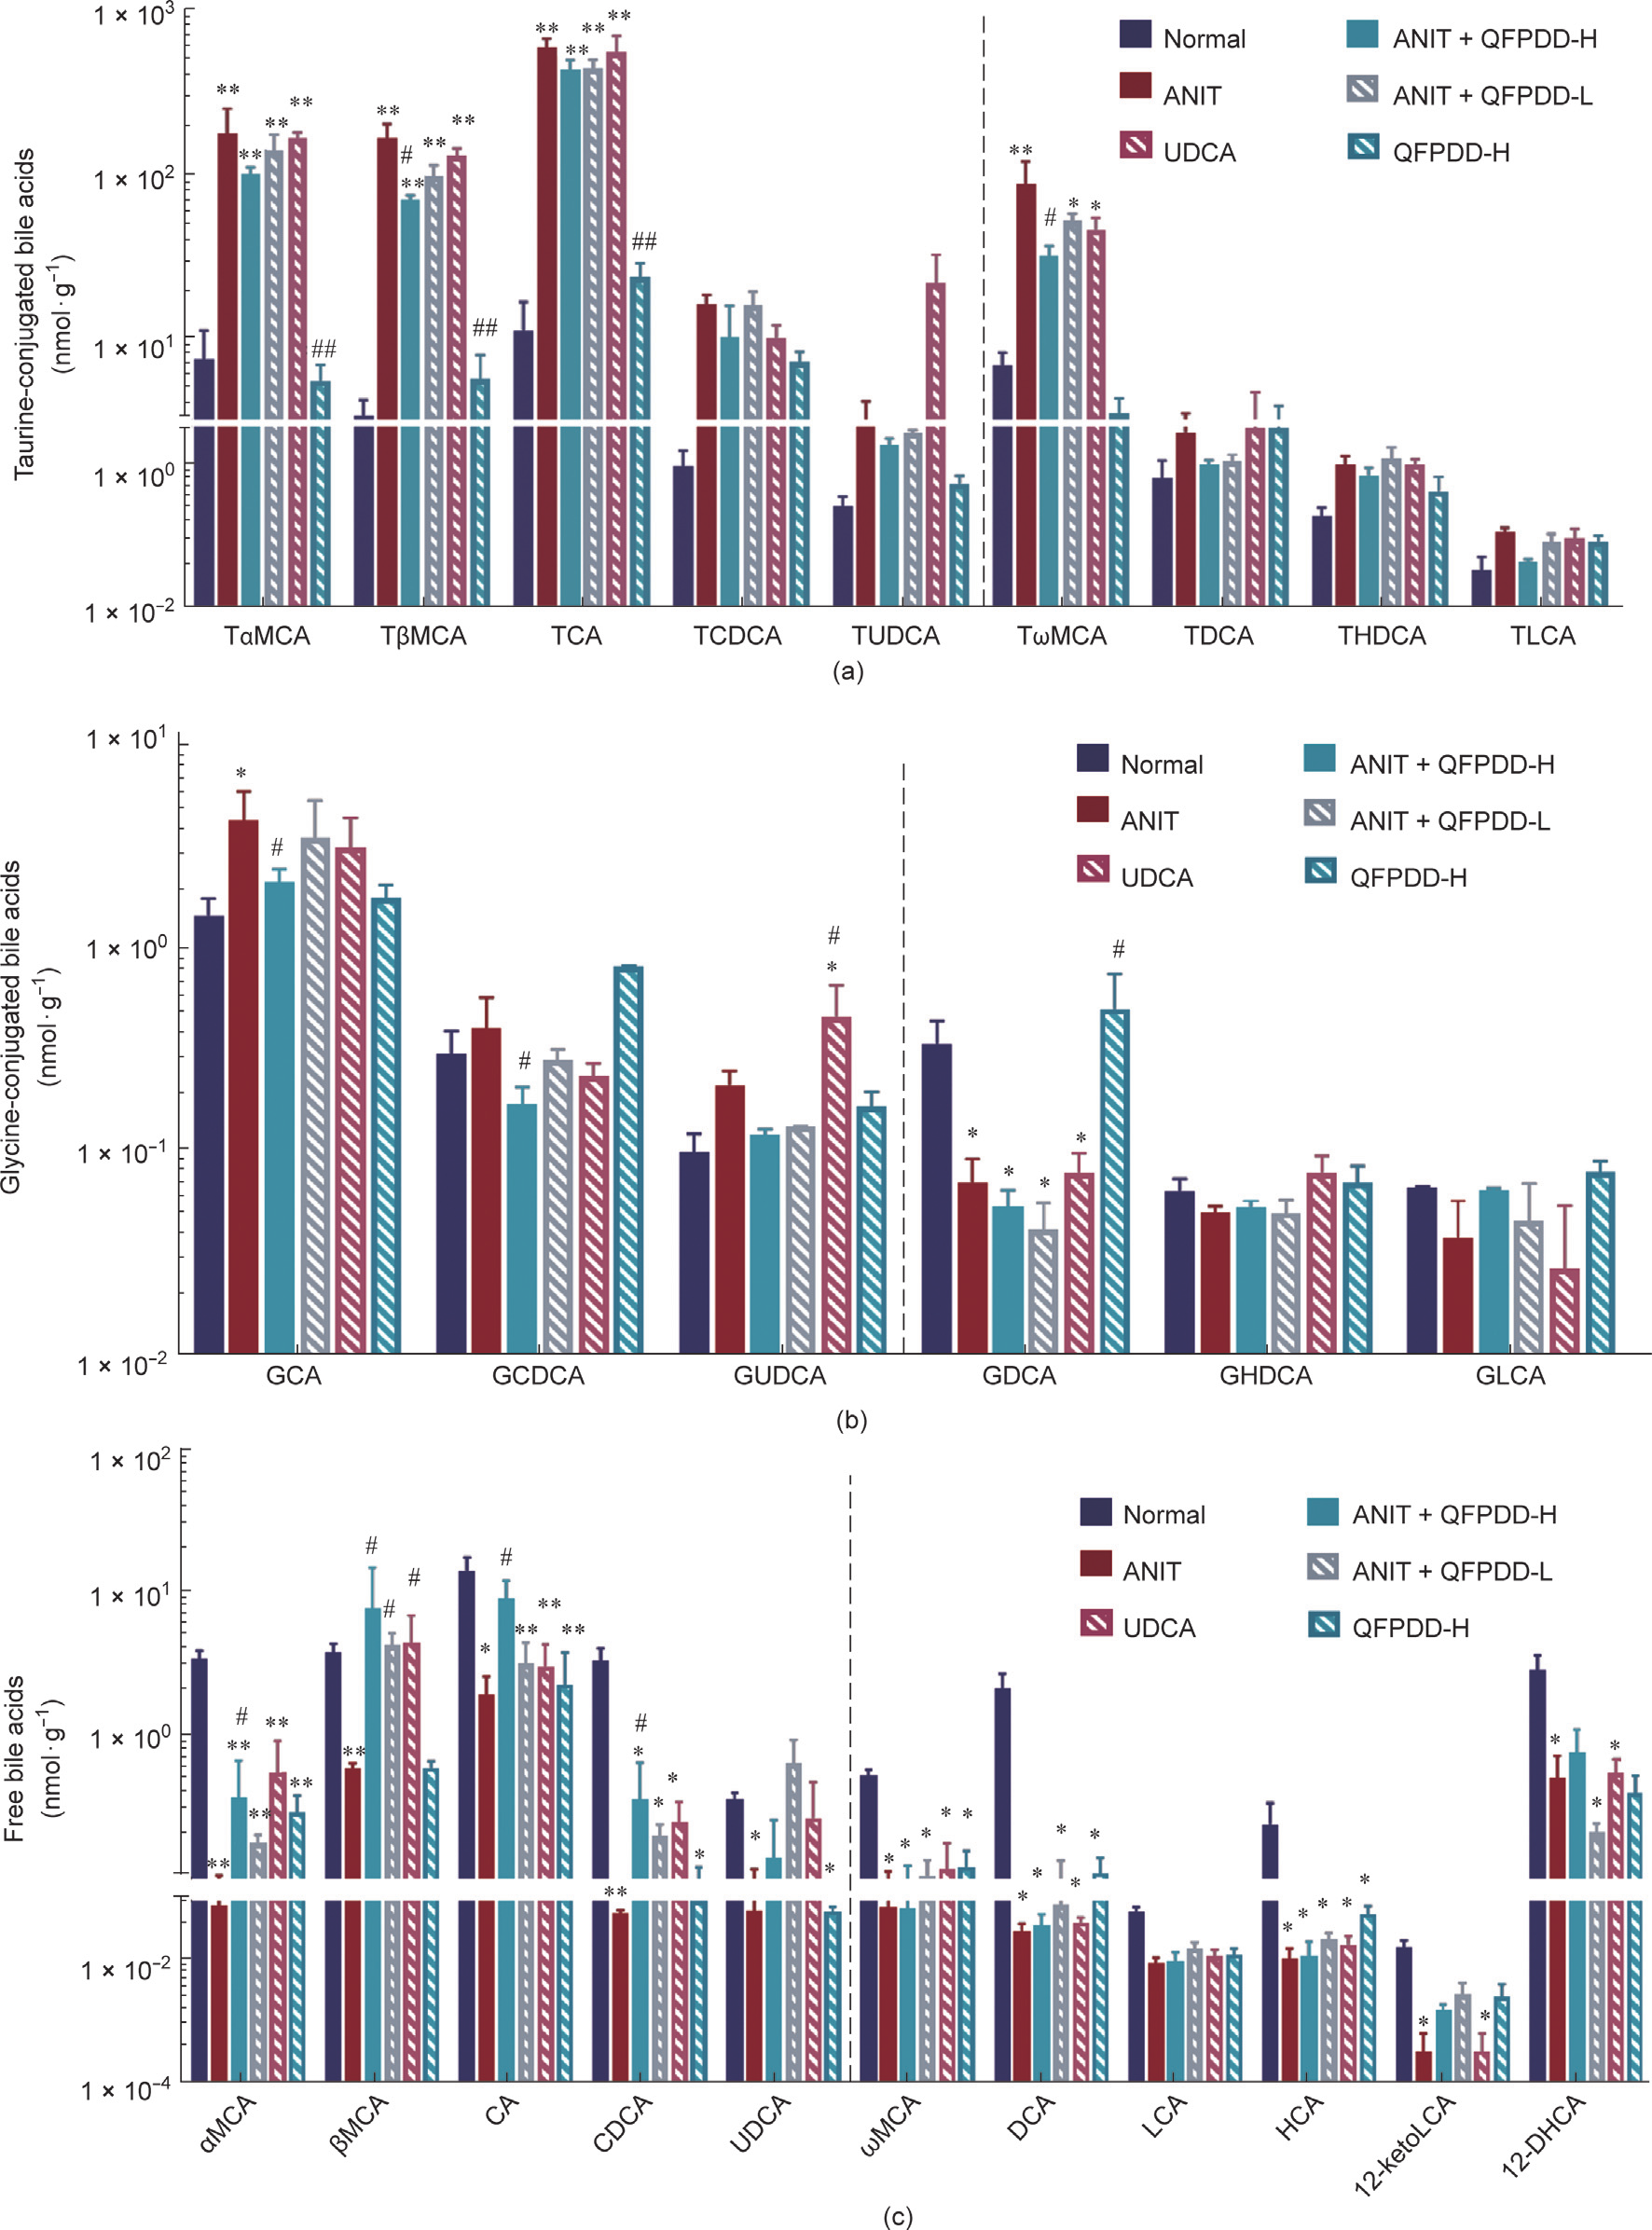
Fig. 3. The changes of bile acids profile in liver in the rat models of ANIT-induced cholestatic liver injury after QFPDD or UDCA treatment. The liver was collected at 54 h and used for bile acid profile analysis. (a) Changes of taurine-conjugated bile acids in liver; (b) changes of glycine-conjugated bile acids in liver; (c) changes of free bile acids in liver. The bars before the dotted line in the figure indicated primary bile acids, and the bars after the dotted line indicated secondary bile acids. *P < 0.05 vs normal control; **P < 0.01 vs normal control; #P < 0.05 vs ANIT; ##P < 0.01 vs ANIT.
《Fig. 4》
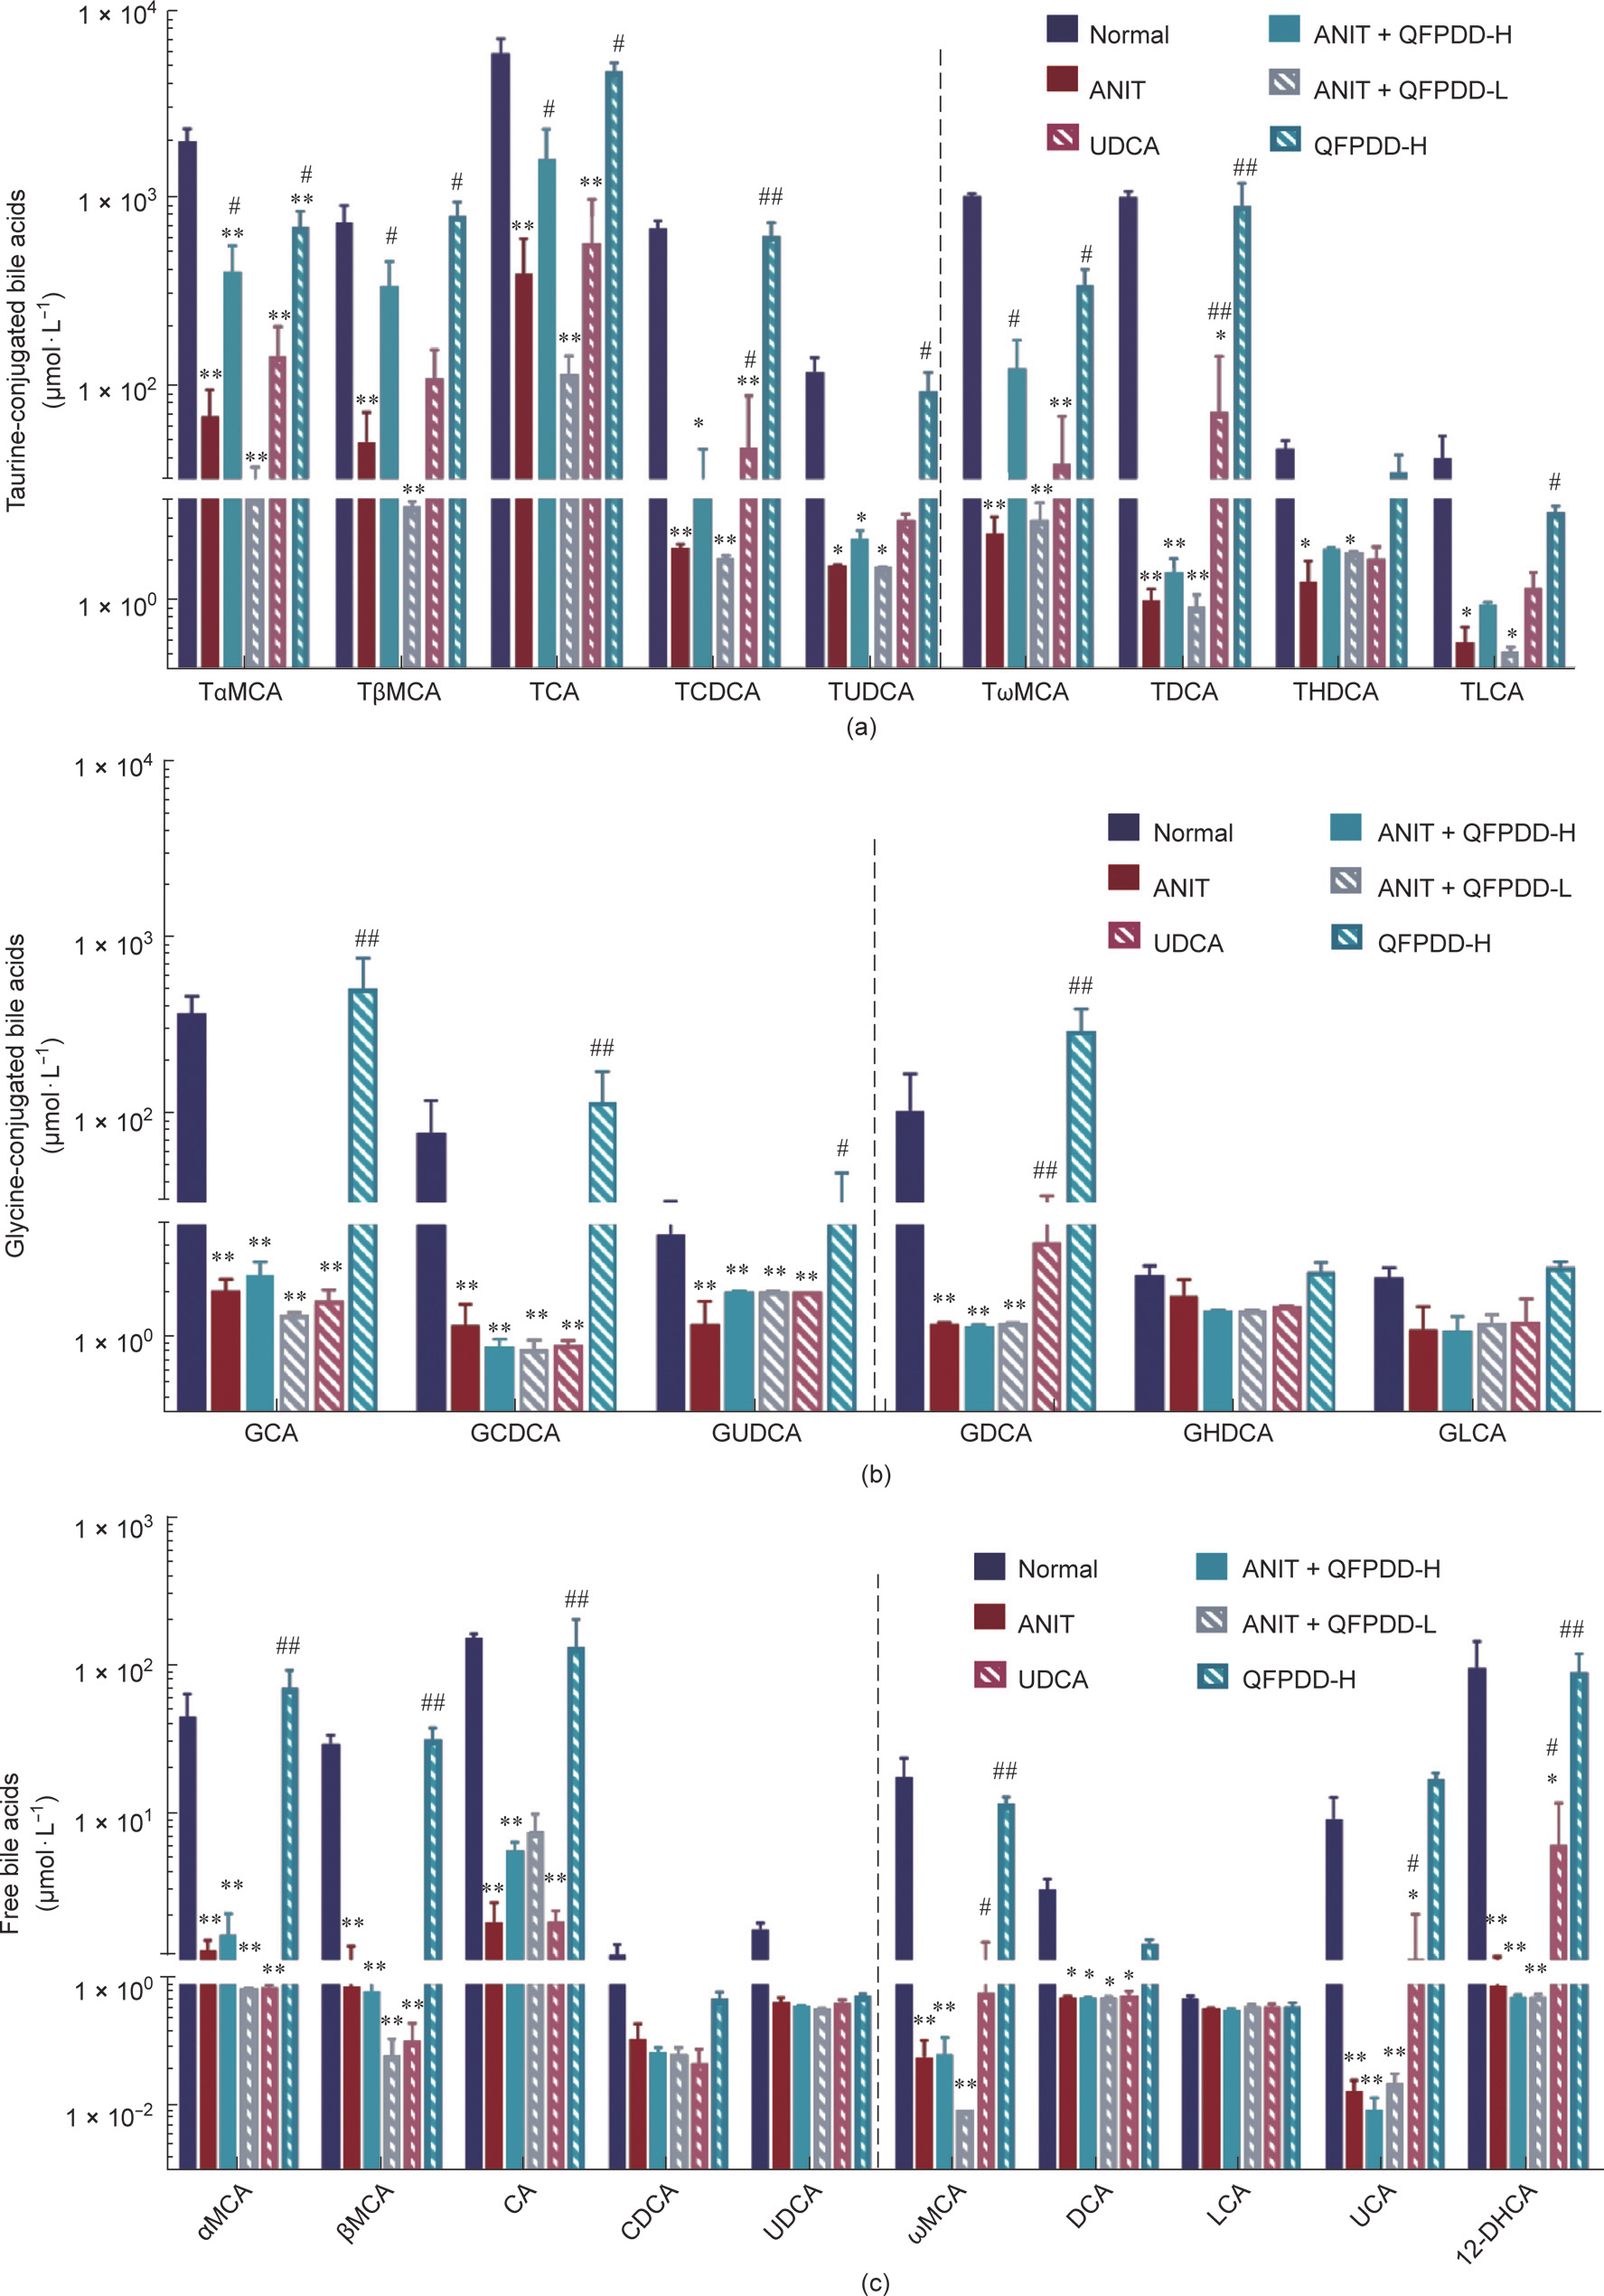
Fig. 4. The changes of bile acids profile in bile in the rat models of ANIT-induced cholestatic liver injury after QFPDD or UDCA treatment. The bile collected from all time points of a rat was mixed for bile acid profile analysis. (a) Changes of taurine-conjugated bile acids in bile; (b) changes of glycine-conjugated bile acids in bile; (c) changes of free bile acids in bile. The bars before the dotted line in the figure indicated primary bile acids, and the bars after the dotted line indicated secondary bile acids. *P < 0.05 vs normal control; **P < 0.01 vs normal control; #P < 0.05 vs ANIT; ##P < 0.01 vs ANIT.
In contrast to the findings above, after ANIT administration, the levels of all kinds of taurine-conjugated bile acids in the bile were decreased (P < 0.05, P < 0.01 vs normal control). The descending order of taurine-conjugated bile acids were: TDCA (99.9%) > taurolithocholic acid (TLCA) (99.4%) > TCDCA (99.1%) > TωMCA (99.1%) > TUDCA (97.2%) > TαMCA (96.5%) > THDCA (95.8%) > TCA (93.3%) > TβMCA (93.1%) and the glycineconjugated bile acids were: GCA (98.9%) > GDCA (98.5%) > GCDCA (98.1%) > GUDCA (93.5%) (Figs. 4(a) and (b)), and the free bile acids were: UCA (99.8%) > ωMCA (99.6%) > 12-DHCA (99.0%) > CA (98.7%) > αMCA (97.3%) > βMCA (97.0%) > DCA (81.1%) (Fig. 4(c)). Fig. S6(c) shows the changes in the concentration of other bile acids in bile. In the QFPDD-H treatment group, the level of conjugated bile acid increased significantly (P < 0.05 vs ANIT), as follows: TωMCA (122.3%) < TβMCA (359.0%) < TαMCA (419.0%) < TCA (1708.0%). However, there was no significant change in the glycine-conjugated bile acids, and the free bile acids between ANIT and QFPDD-H. After QFPDD-L treatment, there was no obviously changes with all bile acids in bile between ANIT and QFPDD-L. There were some bile acids increased significantly by UDCA treatment, including TDCA (7068.0%), GDCA (1060.9%), ωMCA (942.9.0%), TCDCA (681.5%), and 12-DHCA (585.1%) (P < 0.05 vs ANIT).
《3.5. Changes in serum markers in rat model of cholestatic liver injury induced by QFPDD and UDCA in the treatment of ANIT》
3.5. Changes in serum markers in rat model of cholestatic liver injury induced by QFPDD and UDCA in the treatment of ANIT
As shown in Figs. 5(a)–(d), the serum AST, ALT, ALP, and -GT levels in the ANIT model were significantly higher than those of the normal rats in the control group. UDCA treatment could not inhibit the increase of serological markers other than ALT, and QFPDD treatment could reduce the level of AST and ALT only, which has a higher inter-group variation in the conventional serological markers. Therefore, the therapeutic efficacy of UDCA or QFPDD could not be accurately reflected by the conventional markers.
To further evaluate the diagnostic potential of serum CES1 and DPP-IV, we tested the activities of CES1 and DPP-IV in serum (Figs. 5(e) and (f)). Compared with the activities in normal rats, the activities of CES1 and DPP-IV in the ANIT model increased significantly (P < 0.05, P < 0.01 vs normal control) and were reduced in the UDCA or QFPDD-H group compared with those in the ANIT group (P < 0.05, P < 0.01 vs ANIT).
As shown in Figs. 5(g)–(i), the levels of IL-1β, IL-6, and IL-18 were higher in the ANIT model than in normal rats (P < 0.05, P < 0.01 vs normal control), whereas the serum IL-1β, IL-6, and IL-18 levels in the QFPDD-H groups significantly decreased (P < 0.05, P < 0.01 vs ANIT). In the UDCA group, the serum IL-18 and IL-6 levels significantly decreased, while the IL-1β levels showed a decreasing trend that had no statistical significance. These data indicate the protective effects of QFPDD and UDCA against ANIT-induced inflammatory response.
《Fig. 5》
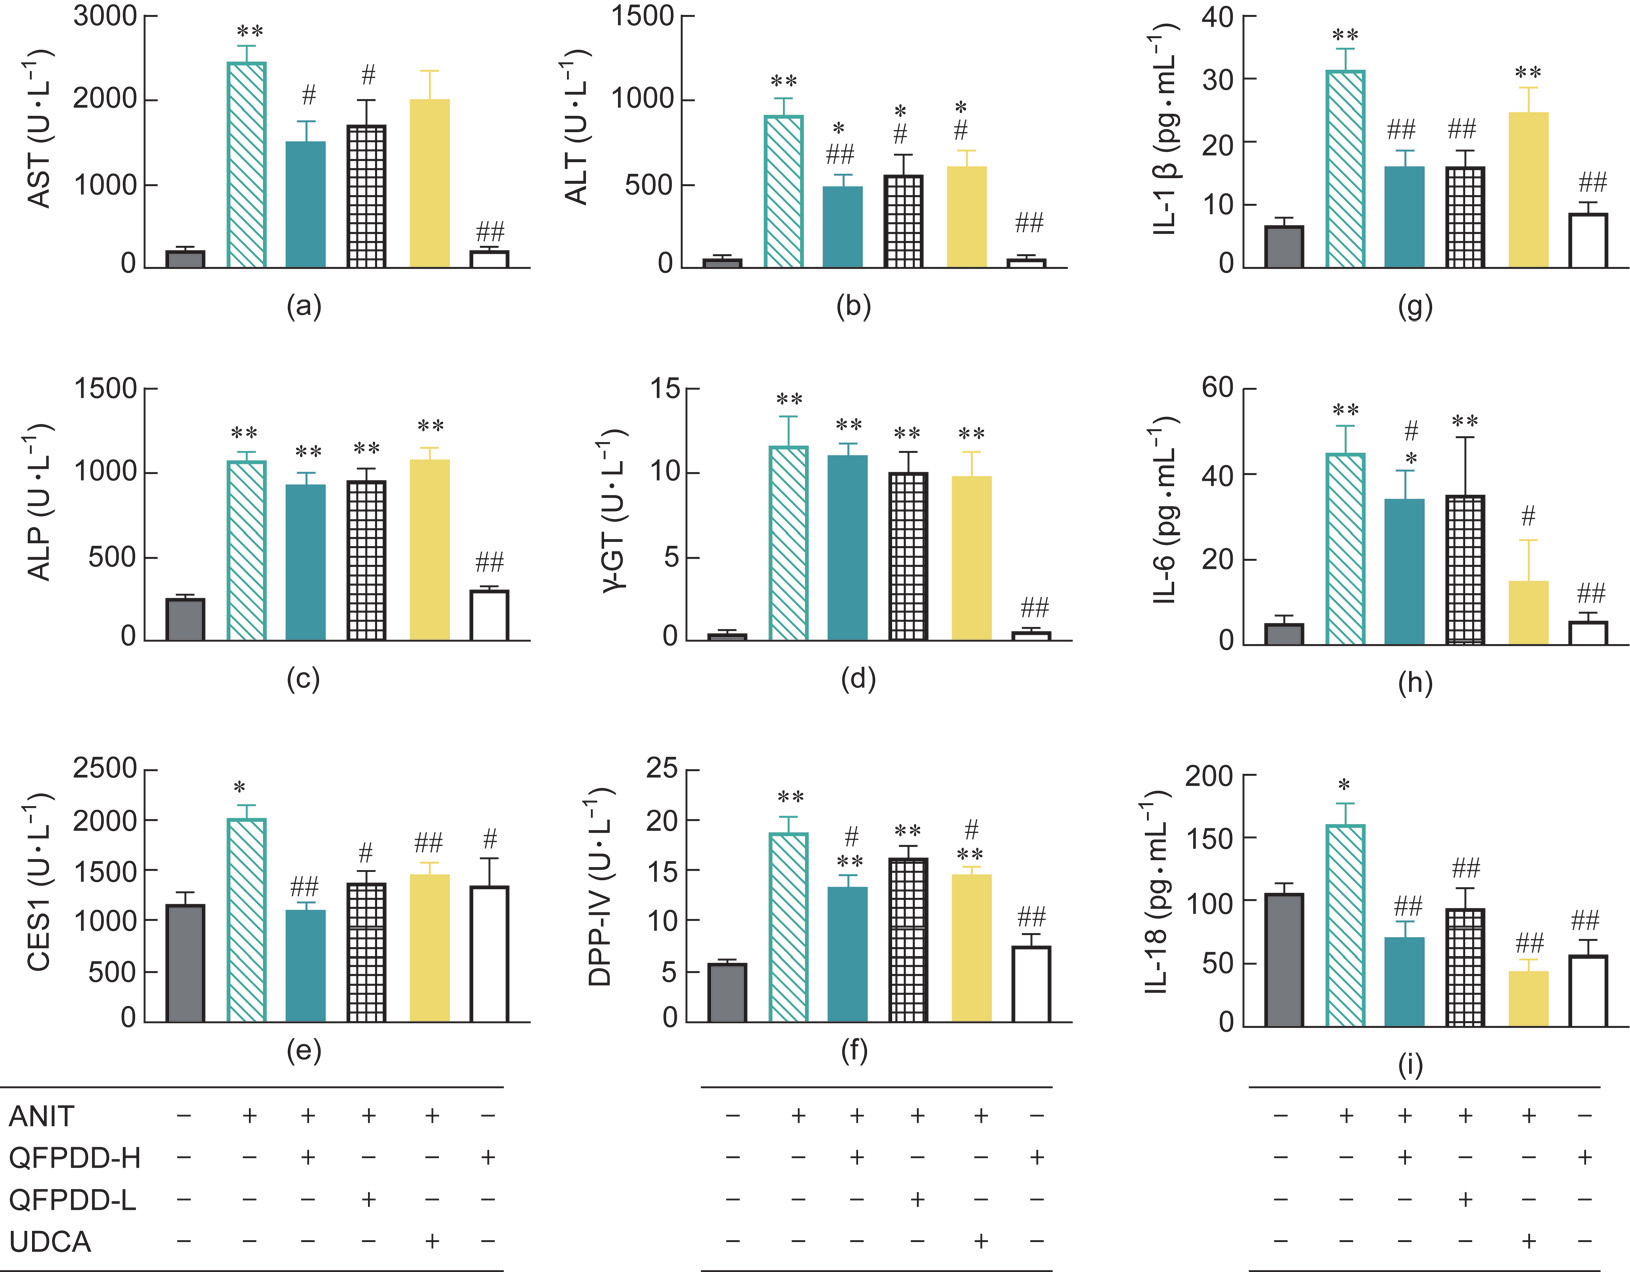
Fig. 5. The changes of different markers in serum in the rat models of ANIT-induced cholestatic liver injury after QFPDD or UDCA treatment. (a–d) Traditional serological markers (AST, ALT, ALP, and -GT). (e, f) New markers (CES1 and DPP-IV). (g–i) Inflammatory cytokines (IL-1β, IL-6, and IL-18). *P < 0.05 vs normal control; **P < 0.01 vs normal control; # P < 0.05 vs ANIT; ## P < 0.01 vs ANIT.
《3.6. The effects of QFPDD or UDCA on the residual activities of liver serological markers in the rat model of ANIT-induced cholestatic liver injury》
3.6. The effects of QFPDD or UDCA on the residual activities of liver serological markers in the rat model of ANIT-induced cholestatic liver injury
To trace the source of the serological markers, we examined the total activities of AST, ALT, ALP, and -GT in liver tissue S9 (Figs.6(a)–(d)). Compared with those in normal rats, the total activities of AST, ALT, and ALP in the liver tissue significantly increased after ANIT administration (P < 0.05, P < 0.01 vs normal control) with concomitant serological changes, whereas the -GT activity was significantly reduced (P < 0.05 vs normal control) with contrary serological changes. Treatment with QFPDD-H, QFPDD-L, or UDCA significantly reduced the activities of AST and ALT (P < 0.05, P < 0.01 vs ANIT) in the liver. UDCA obviously reduced the activity of ALP than QFPDD in the liver, and both QFPDD-H and UDCA increased the -GT activity in liver (P < 0.05 vs ANIT). It is worth noting that QFPDD-H treatment in normal rats led to significantly decreased intrahepatic ALP levels (P < 0.05 vs normal control) and significantly increased -GT levels (P < 0.05 vs normal control). These findings indicate that the intrahepatic enzymes are unstable and easily induced by these drugs.
Next, we tracked intrahepatic CES1 and DPP-IV and evaluated their utility as new serological markers (Figs. 6(e) and (f)). As shown in Fig. 6(e), we found that the activity of CES1 in the ANIT model was significantly reduced compared with that in normal rats (P < 0.05 vs normal control), in direct contrast to the elevation in serum CES1 activity. After the treatment with QFPDD-H, QFPDDL, or UDCA, the decrease in the activity level of CES1 was significantly reversed and was restored to near normal level (P < 0.05 vs ANIT); QFPDD-H administration made no difference on the CES1 levels in normal rats. As shown in Fig. 6(f) The activity changes of DPP-IV were consistent with the changes in the serological biomarkers, that was mean DPP-IV and these serological biomarkers in the ANIT model significantly increased compared with that in normal rats (P < 0.01 vs normal control), QFPDD-H and UDCA treatment led to significantly decreased DPP-IV activity in the liver of the ANIT model (P < 0.01 vs ANIT), but QFPDD-L treatment did not significantly reverse the DPP-IV activity, and QFPDD-H administration had no effect on the activity of DPP-IV in normal rats.
We also tracked the changes in inflammatory factors in the tissues (Figs. 6(g)–(i)). In line with the changes in DPP-IV activity, ANIT administration led to significantly increased levels of IL-1β and IL-6 in the liver (P < 0.05 vs normal control), but QFPDD-H or QFPDD-L treatment led to significantly decreased levels of IL-1β and IL-6 (P < 0.05 vs ANIT), and UDCA treatment led to significantly reduced IL-1β but not IL-6 in the tissues (P < 0.05 vs ANIT); these changes were completely different from their levels in serum. QFPDD-H administration did not affect the changes in inflammatory factors in normal rats.
《Fig. 6》
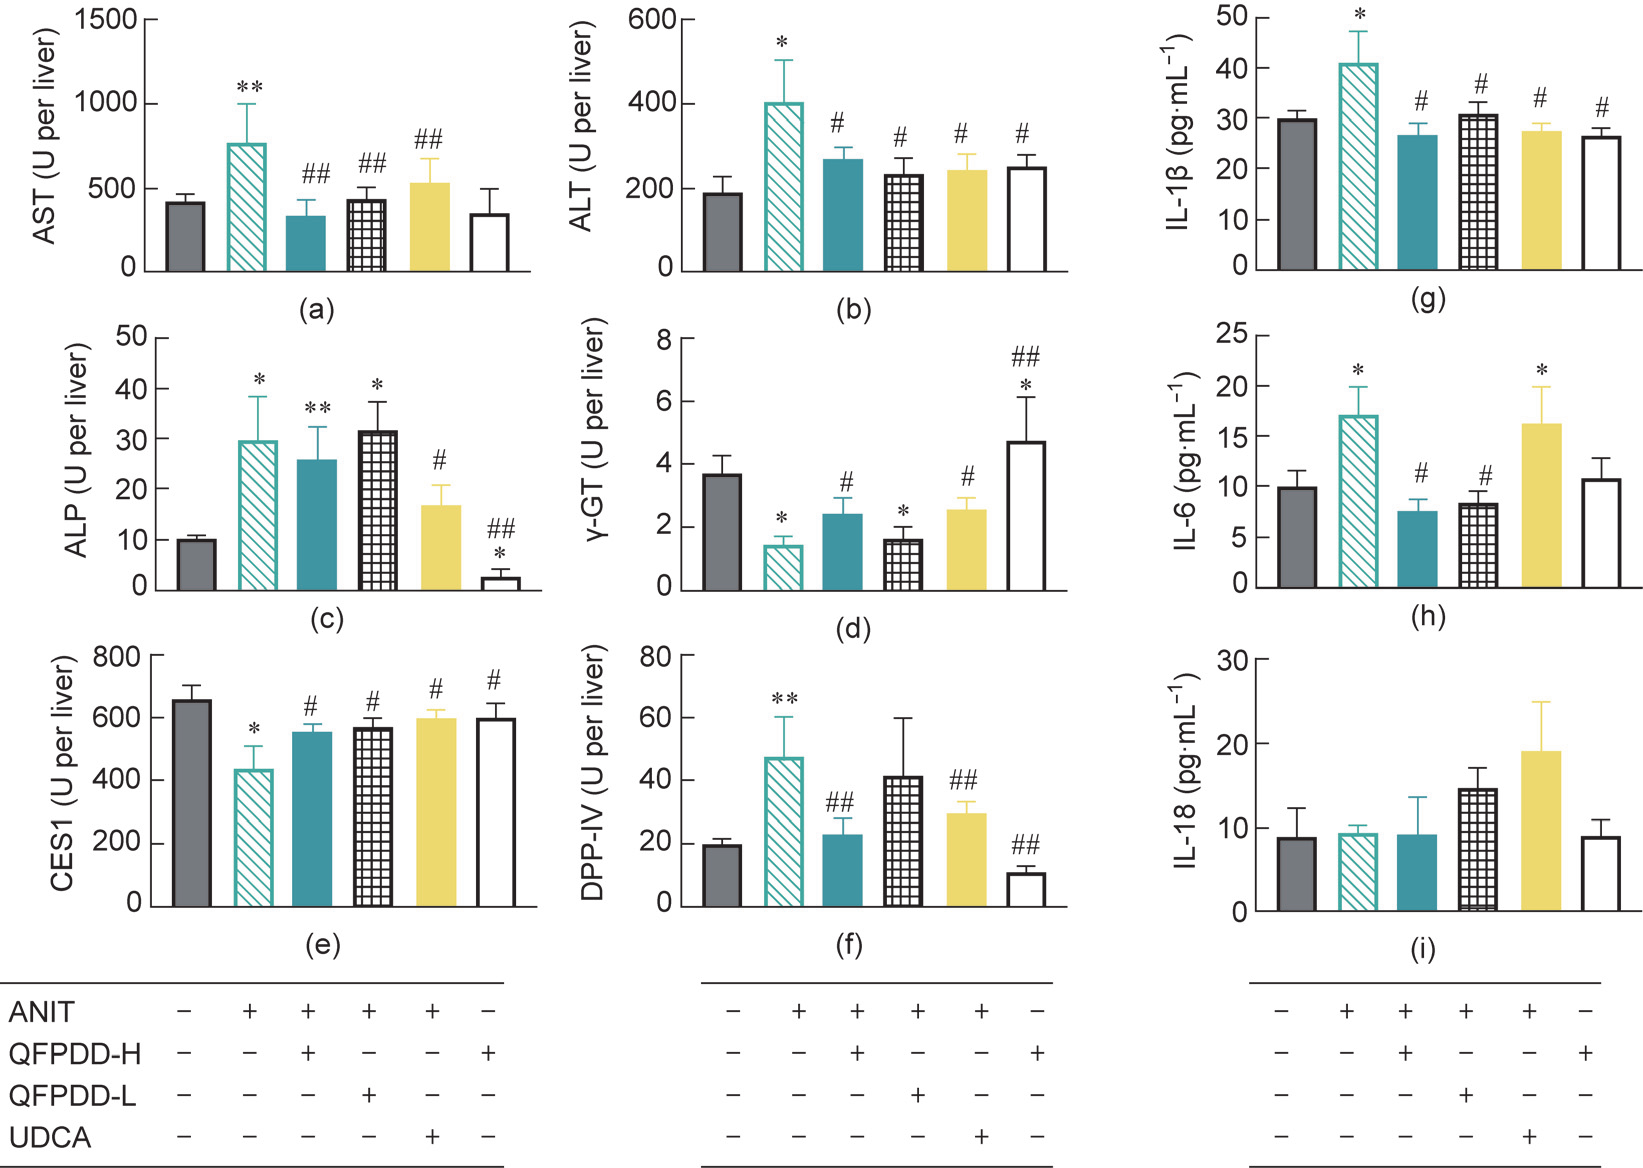
Fig. 6. The residual activity changes of different markers in liver in the rat models of ANIT-induced cholestatic liver injury after QFPDD or UDCA treatment. (a–d) Traditional serological markers (AST, ALT, ALP, and -GT). (e, f) New markers (CES1 and DPP-IV). (g–i) Inflammatory cytokines (IL-1β, IL-6, and IL-18). *P < 0.05 vs normal control; **P < 0.01 vs normal control; #P < 0.05 vs ANIT; ##P < 0.01 vs ANIT.
《3.7. Correlation analysis of CES1, DPP-IV, and injury markers》
3.7. Correlation analysis of CES1, DPP-IV, and injury markers
We subjected all the markers examined in this study to a correlation analysis (Fig. S7 in Appendix A). A r value ranging from 0.5 to 1.0 indicate moderate to good positive correlation, and from –0.5 to –1.0 indicate moderate to good negative correlation. Three types of pathological scores were positively correlated with the levels of serum ALT, AST, ALP, -GT, CES1, DPP-IV, IL-1β, GCA, GHDCA, GCDCA, TLCA, TCDCA, and TCA and with the levels of hepatic TCDCA and TCA (r > 0.5; P < 0.05). In contrast, these scores were negatively correlated with liver CES1, -GT, and DCA in serum, and whole bile acids in bile (r < –0.5; P < 0.05). It was notable that, although the conventional serological biomarkers could reflect organ damage, it was difficult to determine whether they did come from the liver, so specific retrospective validation was necessary. The pathological scores were negatively correlated with liver CES1 and -GT, but positively correlated with serum CES1, which indicates the potential of CES1 as a liver injury marker.
Serum CES1 was positively correlated with AST, DPP-IV, IL-1β in serum and liver (r < –0.5; P < 0.05). On the contrary, the CES1 in liver was negatively correlated with AST, ALP, DPP-IV, and bile acids, including TCDCA, TCA in serum and liver (r < –0.5; P < 0.05), but positively correlated with intrahepatic -GT and most bile acids in the bile except (r > 0.5; P < 0.05). An increase in the serum CES1 level was consistent with the conventional serological markers and was positively correlated with the biomarkers currently used to diagnose liver injury. In general, CES1 in serum had the best correlation with GCA in serum, IL-6, AST, and DPP-IV in liver, and the coefficient values were 0.8, 0.7, 0.7, and 0.7, respectively. While CES1 in liver had the best correlation with inflammation, necrosis, and degeneration scores; TCDCA, TDCA, THDCA, CDCA, and TCA in bile; AST, ALP, TCA, and -GT in serum; and the coefficient values around 0.8. These results indicate that CES1 can be used to reflect the degree of liver injury and the liver synthesis ability of multiple combined bile acids. The negative correlation with liver and serum CES1 levels indicates that the CES1 in serum is indeed released from the liver.
Serum DPP-IV was positively correlated with serum AST, ALT, ALP, IL-1β, IL-18, TCDCA, TCA, TDCA, THDCA, GHDCA, TLCA, and HCA (r > 0.5; P < 0.05), and it is also positively correlated with intrahepatic AST, ALT, ALP, IL-1β, IL-6, and (r > 0.5; P < 0.05). Furthermore, serum DPP-IV was negatively correlated with the bile acids in all the bile (r < –0.5; P < 0.05). Serum DPP-IV was positively correlated with liver DPP-IV but negatively correlated with liver CES1 (r < –0.5; P < 0.05). The DPP-IV in liver was positively correlated with IL-1β, IL-6, and IL-18; with AST, ALT, and c-GT, and the bile acids GCA and GCDCA in serum, and with TCA and TCDCA in the liver (r > 0.5; P < 0.05). Liver DPP-IV was negatively correlated with liver CES1 (r < –0.5; P < 0.05), and exhibited optimal correlation with the inflammation markers. In general, DPP-IV in serum had the best correlation with the three types of pathological score, also GCA, GHDCA, TCA, ALP, and IL-1β in serum, CES1 in liver, and TCA, TCDCA, TDCA, and THDCA in bile which all the coefficient absolute values are higher than 0.8. While the DPP-IV in liver had the best correlation with CA and CES1 in serum, and AST in liver, and the coefficient absolute values are 0.8, 0.7, and 0.7, respectively. These data suggest that serum DPP-IV can be used as an inflammation marker rather than simply as a marker released from the damaged tissue.
《4. Discussion》
4. Discussion
The mutual verification method to assess tissue damage by pathology scores and serological biomarkers should meet the following criteria:
(1) Does the tissue specificity and relative abundance of the biomarker itself meet the established requirements for a biomarker?
(2) Are the characteristics of the quantitative method and those of the qualitative method equivalent? For example, characterization of injury and inflammation should not be compared directly.
(3) Should the causal relationship between serum and tissue biomarkers be mutually retrospectively verified or confirmed?
(4) Does any interference result from inflammation or the upregulated expression and leakage of biomarkers caused by other injury factors?
The pathological method has been accepted as the gold standard for the evaluation of tissue damage and has been employed in the mutual verification of existing markers. Our results showed that the two biomarkers displayed patterns of dynamic changes that differed from those of conventional serological markers at different time points after ANIT-induced injury. The increase in serum levels of the conventional biomarkers preceded the elevation of CES1 and DPP-IV in serum. After 54 h of ANIT induction, there was a significant decrease in the conventional serological biomarkers, making it difficult for them to characterize and monitor sustained damage. In contrast, both CES1 and DPP-IV remained at high levels after 54 h. We found that the conventional biomarkers (except for -GT) all showed a synchronous increase during the tissue retrospective examination, including ALT, AST, ALP, IL-1β, IL-6, IL-18, and some bile acids. After ANIT induction, the levels of both serum and liver DPP-IV also increased significantly, likely due to the high expression of DPP-IV in the extrahepatic tissues or due to inflammatory stimulation. When the liver experiences the first exogenous damage attack, such as drugs or viruses, the metabolism and transformation capacity of the liver are restricted and destroyed to a certain extent. This results in the disturbed metabolism of endogenous substances such as bile acids in the body, triggering a systemic immune attack with massive reactive oxygen species (ROS) production and finally inducing the immune system to attack other tissues and organs [33–35]. In terms of the relative abundance of biomarkers in specific tissues, we found that the level of CES1 was the highest in the liver, followed by the small intestine, kidney, and spleen [11]. The reduced residual activity of CES1 in the liver was negatively correlated with changes in the level of CES1 in serum. These results indicate that the increase in serum levels of CES1 may result from the decreased residual activity of CES1 in the tissues, which suggests that CES1 in serum is only caused by liver cell destruction and is not due to cell proliferation or increased expression—making CES1 an ideal marker for tracking liver-specific damage.
All of the aforementioned conventional serological biomarkers exhibit a multi-organ distribution with poor specificity, and their abundance in the liver is not at the same order of magnitude as that of CES1 [36]. Indeed, after injury, the elevation of conventional biomarkers may result from their release from multiple organs/tissues or from the induced expression of the biomarkers in the liver [35]. In addition, it is difficult to determine whether the damaging agent will cause elevated expression of the conventional biomarkers in the cell, destructive leakage from the cell, or both, resulting in a potentially misleading assessment of liver injury. DPP-IV was previously thought to be a biomarker of inflammation [8]. In this study, we found that the level of DPP-IV in serum was elevated and was closely correlated with the inflammation scores of the liver, further validating the potential of DPP-IV as a biomarker of inflammation. Notably, while the residual activity level of DPP-IV in the liver of a normal rat was low, it increased significantly in serum after ANIT-induced liver injury. Thus, the increased level of DPP-IV in serum presumably does not arise from the liver only, but stems from the infiltration of inflammatory cell in the serum and liver tissues. Although, they were similar to the inflammatory factors, the levels of DPP-IV ascended in the serum and liver after inflammatory cell infiltration, so DPP-IV appears to be persistent and stable as a biomarker. Our results show that the combination of CES1 (an intrahepatic biomarker of liver injury) and DPP-IV (an extrahepatic biomarker of inflammation) can accurately assess and track liver-specific damage including sustained damage, while also representing the inflammation state.
In general, liver injury can be divided into three stages:
(1) The direct destruction of liver cells occurs due to exogenous factors such as drugs or viruses.
(2) After the first stage, toxins that should be excreted from the liver (including bilirubin, bile acid, intestinal bacteria, bacterial toxins, etc.) cause secondary liver damage and seizures.
(3) The above two types of damage lead to imbalance and activation of the immune system, resulting in autoimmune attacks.
These three stages are not completely separated and overlap in most cases. In our study, we chose different biomarkers to reflect the different stages of liver injury. For example, CES1 represents the first stage, bile acids represent the second stage, and DPP-IV represents the final stage. After the administration of ANIT, we found that these biomarkers changed and overlapped with each other. Our biomarkers can be used to distinguish among different mechanisms and stages, making it possible to clearly identify the overlap and coverage of the three stages of liver injury caused by ANIT. In this example, the status of the liver damage caused by ANIT mimics the pathological characteristics of the damage caused by COVID-19 infection to a certain extent; that is, the damage caused by inflammation.
QFPDD is a multi-ingredient herbal formula that has been widely used in China to treat COVID-19 [22]. However, its protective effect against liver injury remains elusive. In this study, we employed a rat model of single-dose ANIT-induced cholestasis to mimic the acute liver injury caused by coronavirus infection. In the current study, integrated analyses of pathological changes, bile flow, bile acid changes, and conventional and new serum biomarkers revealed that QFPDD has a therapeutic effect on liver injury caused by ANIT administration. It was notable that QFPDD led to attenuated damage and inflammation than UDCA, which was clearly shown by the differential activities of CES1 and DPP-IV in the liver. The syo-saiko-to decoction (Xiao-Chai-Hu Tang) in QFPDD has been widely used in TCM to treat chronic liver diseases and has demonstrated potent therapeutic effects in the mouse model of D-galactosamine-induced liver damage [37–39]. In addition, Chen et al. [40] reported that the syo-saiko-to decoction significantly reduced cholestasis in rats subjected to bile duct ligation. ANIT administration can lead to an overall increase in conjugated bile acids and free bile acids in the serum and liver, and the levels of conjugated bile acids and free bile acids in the bile were significantly reduced, especially in regard to secondary bile acids. However, QFPDD-H treatment changed the levels of free primary bile acids and conjugated secondary bile acids in the serum, the levels of conjugated primary bile acids and free primary bile acids in the liver, and the levels of taurine-conjugated and free-form primary bile acids.
Overall, in terms of bile acid metabolism, QFPDD treatment improves cholestasis by causing more changes in the bile acid spectrum while reversing taurine-conjugated primary and secondary bile acids. Our work demonstrates that the conjugation reaction of bile acids in the liver greatly increases after ANITinduced injury, likely due to significant increases in free bile acids as substrates during cholestasis. However, QFPDD-H treatment protected the bile duct cells from damage and restored bile excretion to attenuate cholestasis by inhibiting inflammation. Wang et al. [41] used glycyrrhizic acid for preventive treatment before the administration of ANIT and found that it can reduce the abundance of taurine-conjugated bile acids in the ANIT model. However, the increase in taurine-conjugated bile acids may compensate for acute toxic effects. It has been reported that the accumulation of taurocholate in the liver leads to liver fibrosis, and Röhrl et al. [42] even found that taurocholate can promote the expression of tumor suppressor genes in HepG2 cells. Therefore, the decrease in the level of taurine-conjugated bile acids may reflect the protective effect of QFPDD on inflammatory damage in hepatocytes. From a therapeutic point of view rather than a preventive point of view [43], our results suggest that QFPDD is effective in the treatment of liver damage by reducing the level of conjugated bile acids. The level of CES1 in the liver was negatively correlated with the pathological scores of damages in our result. Taken in conjunction with the correlation analysis, the fact that the activity of CES1 in the liver decreased after liver injury indicates that CES1 is a practical biomarker of liver damage. DPPIV exhibited a good correlation with many biomarkers in the liver or serum. Among them, the correlation with bile acids was mainly correlated with conjugated bile acids and inflammatory factors, especially IL-6. Unlike CES1, IL-6 was highly negatively correlated with bile acids. We also observed that the levels of IL-1β, IL-6, and IL-18 were negatively correlated with the levels of the bile acids in serum, which was consistent with the correlation of DPP-IV with inflammatory factors.
《5. Conclusions》
5. Conclusions
In summary, compared with our newly developed biomarkers CES1 and DPP-IV, conventional serological markers in serum can only provide limited information for characterizing the extent of liver-specific damage. It is apparently difficult to identify the underlying mechanisms or make judgements in regard to phases with conventional serum markers alone. In contrast, monitoring the residual activity of specific enzymes in the liver may be a more accurate and direct tracking method to distinguish inflammation from injury, thereby avoiding the interferences caused by individual differences, administration routes, experimental modeling itself, inflammation, and endogenous toxins. Our work shows that the enzymatic activity of CES1 can directly reflect the primary damage of liver cells, while DPP-IV is a characteristic and mechanistic biomarker of inflammatory infiltration. Our retrospective validation method used cross-validation between serum and tissue to reveal that the combined use of CES1 and DPP-IV is effective for the characterization of liver injury and the evaluation of its severity. This method appears to be one of the most convenient, effective, and stable endpoint methods.
《Acknowledgments》
Acknowledgments
This article is supported by the National Key Research and Development Program of China (2017YFC1702000, 2020YFC0845400, and 2021YFE0200900) and National Natural Science Foundation of China (81773810, 81922070, and 81973393). The authors would like to thank Peter for his help in publishing the article, and the support provided by Zhaoyan (Suzhou) New Drug Research Center Co,. Ltd.
《Compliance with ethics guidelines》
Compliance with ethics guidelines
Qiusha Pan, Peifang Song, Zhenhua Ni, Xingkai Qian, Anqi Wang, Liwei Zou, Yong Liu, Ping Wang, Weidong Zhang, Hong Ma, and Ling Yang declare that they have no conflict of interest or financial conflicts to disclose.
《Appendix A. Supplementary data》
Appendix A. Supplementary data
Supplementary data to this article can be found online at https://doi.org/10.1016/j.eng.2021.09.014.


 京公网安备 11010502051620号


