《1. Introduction》
1. Introduction
CO methanation is an important reaction to produce methane (CH4) from syngas, which can be obtained from the gasification of coal, biomass, and organic waste [1,2]. Nickel-based catalyst has been widely used for this reaction, with metallic Ni0 as the active site. Thus, a reductive pretreatment (catalyst activation step) is required before the reaction to transform NiOx in the fresh catalyst to metallic Ni0 . The number of exposed Ni0 sites is one of the key indicators of catalytic activity. These sites are responsible for many critical elementary reaction steps such as C–O bond breaking, CHx hydrogenation, and CH4 dissociation [3–5]. Therefore, creating more metallic Ni0 sites is an efficient approach to the rational design of supported nickel catalysts.
Strategies that have been proposed to improve the performance of supported nickel catalysts focus on synthesis, for example, developing new preparation methods [6–12], modifying the nature of support [13–15], and doping with additional elements [16]. These strategies usually aim to create dispersed and thermally stable Ni nanoparticles, generate more reactive facets, or enhance the kinetics of certain elementary steps. Furthermore, recent studies have revealed that the gas environment and temperature have an impact on the surface morphology of nickel-based catalysts. For example, introducing oxidizing gases (such as CO2 and H2O) during the dry reforming of methane was found to result in encapsulation of Ni nanoparticles by a thin BOx layer evolved from the hexagonal boron nitride nanosheet support [17]. Exposing the supported Ni/SiO2 catalyst to a CO2/H2 or CH4 environment at 800 °C created a surface Ni3C-like phase that exhibited an altered electronic structure and enhanced adsorption capacity of weakly bonded linear CO [18]. The effect of activation conditions on the catalyst performance, however, is usually overlooked. According to the literature, hydrogen is typically used as the reducing agent with the partial pressure, temperature, and duration common parameters to control the degree of reduction and particle size distribution [19,20].
Here, we investigated the effect of the reduction environment on the structure of supported Ni/CeO2 catalyst. The crystal structure and surface morphology of metallic Ni nanoparticles were determined with in situ X-ray diffraction (XRD) and highresolution transmission electron microscopy (HR-TEM). The chemical state of the catalyst was analyzed with in situ Raman, quasi in situ X-ray photoelectron spectroscopy (XPS) and quasi in situ high-sensitivity low-energy ion scattering (HS-LEIS). The surface species were probed with in situ diffuse reflectance infrared Fourier transform spectroscopy (DRIFTS). We report here for the first time that the surface structure of Ni/CeO2 can be tuned by activating in CO methanation reactant (CO/H2) leading to improved catalytic performance toward the CO methanation reaction.
《2. Materials and methods》
2. Materials and methods
《2.1. Catalyst synthesis》
2.1. Catalyst synthesis
The CeO2 support was synthesized using a precipitation method with ammonium carbonate solution (30%; Aladdin Inc., China) as the precipitator. Briefly, cerium nitrate hexahydrate (99.95%, 0.928 g; Aladdin Inc.) was dissolved in 150 mL of deionized water. Under vigorous stirring, ammonium carbonate (4.8 g dissolved in 50 mL deionized water) solution was dropwise added. The resulting slurry was aged for 12 h and filtered. The solid was further dried at 60 °C for 12 h and eventually calcined at 500 °C for 4 h in air.
An incipient wetness impregnation method was employed to synthesize the supported Ni/CeO2 catalyst. Briefly, nickel nitrate hexahydrate (Ni(NO3)2·6H2O, 98%, 0.779 g; Sinopharm Inc., China) was dissolved in 500 μL of deionized water. The solution was then slowly added into the as-prepared 1.8 g CeO2 powders with continuous stirring for 1 h to form a slurry. The mixture was dried (60 °C, 12 h) and calcined (500 °C, 4 h) to obtain the catalyst. The nominal mass loading of NiO is 10 wt%. We determined the actual content of Ni to be 8.3 wt% with inductively coupled plasma optical emission spectroscopy (ICP-OES) analysis.
《2.2. Catalyst activation》
2.2. Catalyst activation
Two catalyst pretreatment conditions were employed to activate the supported Ni/CeO2 catalyst. Unless otherwise described, these conditions are ① NiCe-H: 60%H2/40%N2 (Air Liquide S.A., French), 50 standard cubic centimeters per minute (sccm), 450 °C, 2 h; and ② NiCe-CO: 60%H2/20%CO/20%N2, (Air Liquide S.A.), 50 sccm, 450 °C, 2 h.
《2.3. Catalyst characterization》
2.3. Catalyst characterization
A transmission electron microscope (TEM, operated at a voltage of 200 kV; FEI Tecnai G2 F20 S-Twin, FEI Company, USA) was used to examine the morphologies of the catalysts. Energy dispersive Xray spectroscopy (EDS) was used for elemental analysis.
The in situ Raman spectra were collected on a Horiba LabRam HR spectrometer (Horiba, Ltd., Japan) equipped with visible laser excitation with a wavelength of 514 nm (Light source: He–Cd), a 50× long working distance objective (Olympus BX-30-LWD, Olympus Corp., Japan), a single-stage monochromator, and a charge coupled device (CCD) detector (Horiba CCD-3000 V). The catalyst was activated for 2 h and exposed to CO methanation at 450 °C for 1 h with the spectra collected every 15 min.
The in situ XRD analysis was performed on a Bruker D8 ADVANCE X-ray powder diffractometer (Bruker Corp., USA) with a Cu Kα ray source (λ = 0.154 nm) operating at 40 kV and 40 mA. The catalyst was treated in Ar at 450 °C and activated in different conditions. The XRD patterns were then collected from 20° to 80° with a resolution of 0.02°.
Quasi in situ XPS spectra were collected by Thermo ESCALAB 250Xi spectrometer (Thermo Fisher Scientific, USA) equipped with a monochromatic AlK radiation source (1486.6 eV (1 eV = 1.602176 × 10⁻¹⁹ J), pass energy 20.0 eV). A pretreatment chamber was used for catalyst activation. The chamber was then evacuated, and the sample was rapidly transferred into the analysis chamber in a vacuum without air contact.
The surface elemental distribution was analyzed with a Qtac 100 HS-LEIS spectrometer (ION-TOF, Germany) equipped with a double toroidal analyzer. The sample was prepared for analysis by compressing into Al2O3 powder within a crucible at 2000 psi(1 psi = 6.894757 × 10³ Pa). The pellet was loaded into the pretreatment chamber, dehydrated in the 10% O2/Ar environment at the temperature of 450 °C for 1 h, and activated under two conditions: ① 1:1 H2/Ar and ② 1:3 CO/H2 at 350 °C for 2 h. Afterward, the pellet was transferred to the analysis chamber to avoid air contact. He+ ions at 4 keV were used as the probe ion source, and Ar+ ions with 0.5 keV were used for sputtering.
The H2-temperature programmed reduction (TPR) was conducted on an Autosorb-TP-5080-B (Xianquan Instrument Corp., China) connected to an online thermal conductivity detector (TCD). The temperature was ramped up to 800 °C at a rate of 10 °C·min–1 with 10% H2/Ar at a flow rate of 30 sccm and held for 30 min.
The surface area of metallic Ni was estimated by measuring the amount of chemisorbed hydrogen molecules using a Micromeritics AutoChem II. The catalyst was pretreated at 450 °C in Ar and activated in different conditions. Afterward, the catalyst was purged with Ar to remove physically adsorbed H2, cooled to room temperature, and exposed to H2 chemisorption pulses.
The in situ DRIFTS experiments were carried out on a PerkinElmer Frontier Fourier-transform infrared (FT-IR, PerkinElmer, Inc., USA) spectrometer equipped with a diffuse reflection cell (Harrick Praying Mantis, Harrick Scientific Products Inc., USA). About 50 mg of the catalyst was loaded into the reaction cell. The catalyst was first activated under different treatment conditions at 450 °C. Subsequently, the temperature was controlled at 300 °C, and the gas flow was switched to CO methanation for 1 h. The in situ DRIFTS spectra were collected every minute during the reaction.
《2.4. Steady-state activity measurements》
2.4. Steady-state activity measurements
CO methanation performance was tested in a fixed-bed microreactor: 100 mg of catalyst powder was placed in a quartz tube, activated under different environments, and then evaluated for CO methanation reaction in 50 sccm of 20%CO/60%H2/20%N2 and temperatures from 200 to 450 °C. All activity measurements were conducted at a gas hourly space velocity (GHSV) of 30 000 or 1 500 000 mL·g–1 ·h–1 . The gas products were analyzed by online gas chromatography (Ruimin GC 2060, Ruimin Ltd., China). A 5A molecular sieve and a Porapak T column (Sigma-Aldrich Inc., USA) were used for gas separation. H2 was detected by a TCD; hydrocarbons, CO2, and CO were detected by a flame ionization detector (FID) equipped with a methanizer.
《3. Results and discussion》
3. Results and discussion
The supported Ni/CeO2 catalyst was reduced at 450 °C for 2 h and evaluated for the CO methanation reaction. Two different environments were selected: 60%H2/40%N2 and 20%CO/60%H2/20%N2; the reduced catalysts were denoted as NiCe-H and NiCe-CO, respectively. The NiCe-H catalyst exhibited a production rate of 146.3 mmol·g–1 ·h–1 for CH4 and 31.8 mmol·g–1 ·h–1 for CO at 200 °C and 30 000 mL·g–1 ·h–1 (Fig. 1(a), Table S1 in Appendix A). In comparison, NiCe-CO was more active toward CO methanation and catalyzed the formation of CH4 at a rate of 163.0 mmol·g–1 ·h–1 . The improvement in catalytic activity became more apparent at a higher GHSV of 1 500 000 mL·g–1 ·h–1 . The production rate of CH4 for NiCe-CO (121.8 mmol·g–1 ·h–1 ) increased by about 30% compared with NiCe-H (95.8 mmol·g–1 ·h–1).
《Fig. 1》

Fig. 1. (a) Activity toward production of CH4 and CO over the supported Ni/CeO2 activated under different conditions. (b) Long-term stability test result of Ni/CeO2 activated under different conditions (reaction conditions: P = 1.0 atm (1 atm = 105 Pa), T = 200 °C, GHSV = 30 000 mL·g–1 ·h–1 , n(H2):n(CO) = 3:1).
Reduction is necessary to activate the catalyst, and the unreduced catalyst has negligible activity toward the CO methanation reaction. Both activated catalysts exhibited very stable performances for 24 h (Fig. 1(b)), which implies that varying activation conditions may result in somewhat irreversible catalyst structural changes. We also evaluated the effect of activation condition on CO methanation over a Ni/CeO2 catalyst with a higher nominal NiO loading of 50 wt%. The catalyst activated by reactants still showed better performance (Table S2 in Appendix A).
We analyzed the morphology of the supported Ni/CeO2 catalyst after various activation pretreatments. The surface area and porosities appeared to be comparable (Figs. S1 and S2, and Table S3 in Appendix A) indicating that the aforementioned structural changes are most likely associated with the supported metallic Ni nanoparticles. HR-TEM images of the NiCe-H catalyst show large nanoparticles with lattice fringes of the Ni(111) facet (0.21 nm) (Fig. 2). According to EDS mapping, the average size of metallic Ni nanoparticles was about 21.6 nm. Interestingly, while the apparent particle size of NiCe-CO obtained from EDS mapping (18.7 nm) was somewhat comparable to the hydrogen-treated catalysts, these Ni0 particles presented in a polycrystalline state with nanosized grains (average diameter is 7.9 nm). The bulk structure of Ni/CeO2 before and after activation was further probed with in situ XRD, which revealed a CeO2 phase at 28.3°, 32.7°, 46.9°, and 55.8° (Fig. 3(a)). The crystallite size of CeO2 was determined to be 11.8 nm using the Scherrer equation according to the CeO2(111) diffraction peak. It remained almost unchanged for NiCe-H (12.5 nm) and NiCe-CO (11.8 nm). The NiO phase could be detected for the fresh catalyst that featured a tiny NiO(200) peak at 43.1° corresponding to a crystallite size of 20.9 nm (Fig. S3 in Appendix A). NiCe-H had a diffraction peak at 44.0° that is characteristic of the Ni(111) phase. The crystallite size of Ni was 22.6 nm. However, the diffraction peak associated with metallic Ni could hardly be detected for NiCe-CO, which is consistent with the HR-TEM results.
《Fig. 2》

Fig. 2. HR-TEM images and elemental mappings for (a–c) NiCe-H and (d–f) NiCe-CO.
The structure evolution of the catalyst during activation and reaction was also followed by time-resolved in situ Raman spectroscopy. The sharp peak at about 460 cm–1 is assigned to the first-order F2g band, and the broad peak at about 590 cm–1 is assigned to the defect-induced mode (D band) (Fig. 3(b)) [21– 23]. The position of the F2g band is somewhat related to the number of defects (i.e., oxygen vacancies) in CeO2. The position can also be impacted by lattice strain and particle size [16,23,24]. Activation of Ni/CeO2 creates oxygen vacancies as reflected by the intensified D band and red-shifted F2g band. These oxygen defects seem to be quite stable during the CO methanation reaction: The intensity of the D band remains almost unchanged.
《Fig. 3》
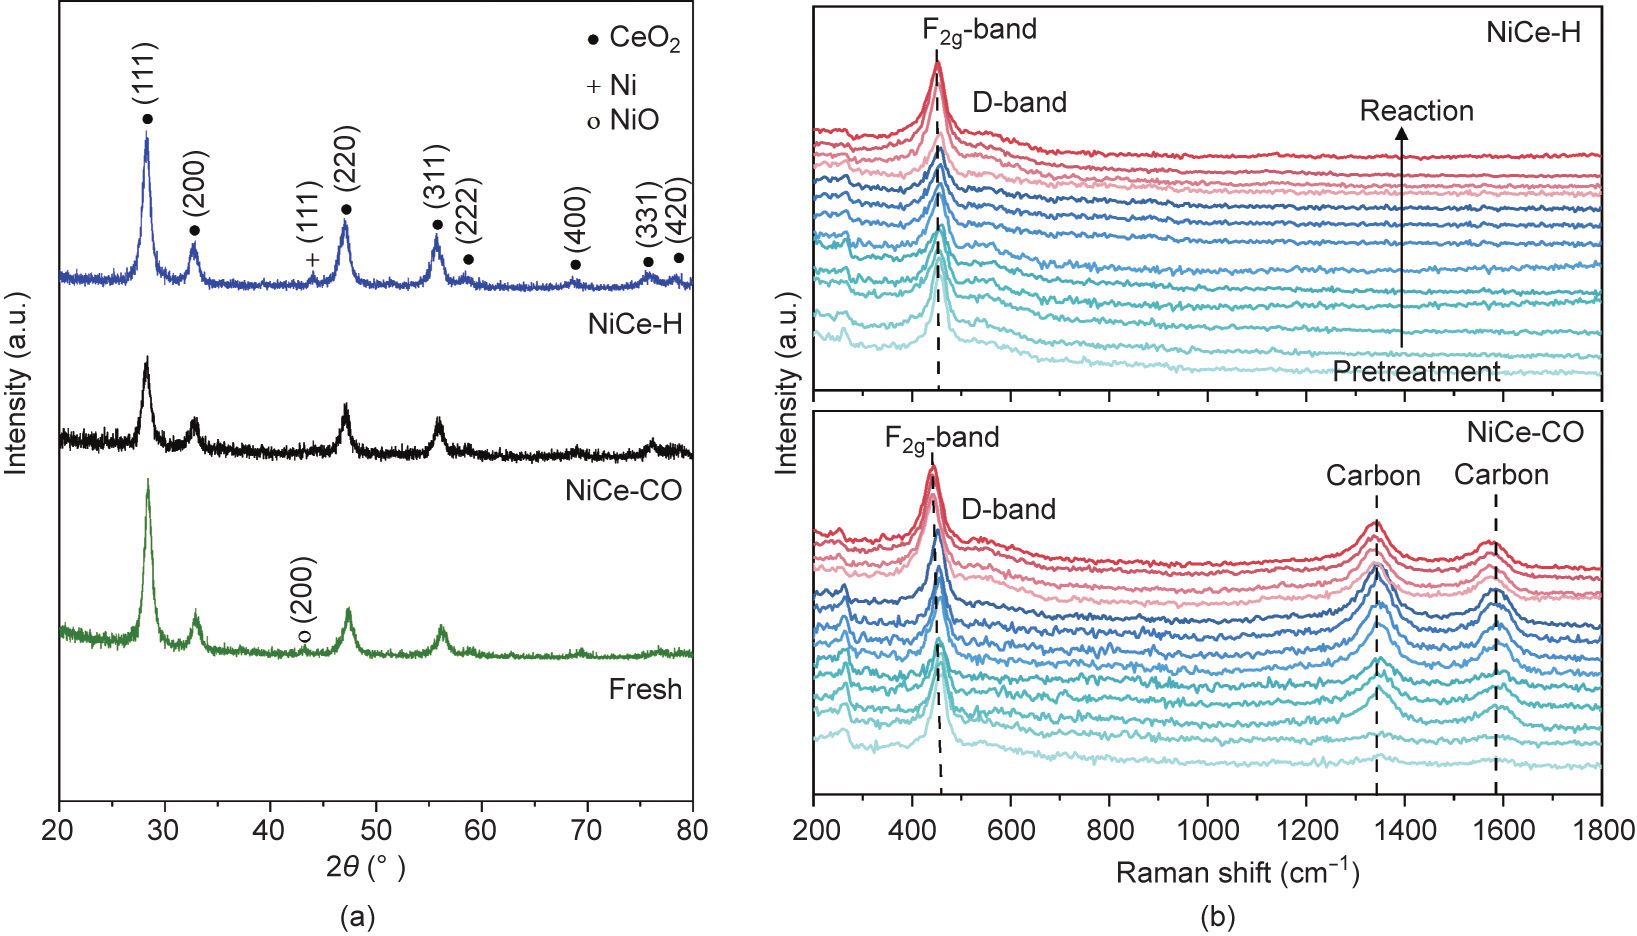
Fig. 3. (a) In situ XRD spectra of the supported Ni/CeO2 catalysts. (b) Time-resolved in situ Raman spectra for NiCe-H and NiCe-CO during activation and reaction.
Carbon deposition shows a D band at 1357 cm–1 and a G band at 1585 cm–1 . These form during activation via a mixture of CO and H2 [25]. The formation of carbon species under CO-containing atmospheres has been previously well documented. For example, the activation of Pt/Co/Al2O3 by 5%CO/He yielded a microporous carbon shell for Fischer–Tropsch synthesis [26]. Interestingly, exposing the hydrogen-activated catalyst to CO methanation reaction condition did not yield any carbon species regardless of the same gas environment and temperature as those applied to form NiCe-CO. Furthermore, the band intensities of the deposited carbon remained constant at the reaction stage. We speculate that the formation of carbon species only occurs along with the phase transformation of NiO to metallic Ni nanoparticles in a CO/H2 environment. Such a feature may account for the excellent longterm stability (free of coke formation) during CO methanation as illustrated above.
The chemical state of the catalyst surface region was further investigated with quasi in situ XPS. Fresh Ni/CeO2 exhibited Ni 2p spectra mainly contributed by Ni2+ species at 855.0 eV (85%) with a minor amount of Ni0 species at 853.2 eV (15%) (Fig. 4(a)). The Ni0 species in the fresh catalyst is possibly due to the electronic interaction between oxygen-deficient CeO2–x species and NiO. After activation, the content of metallic Ni0 species dramatically increased reaching 60% for NiCe-H and 66% for NiCe-CO. The XPS spectrum of the Ce 3d signal revealed the co-existence of Ce4+ sites [Ce3d9 4f0 O2p6 (μ''' and υ'''), Ce3d9 4f1 O2p5 (μ'' and υ''), and Ce3d9 4f2 O2p4 (μ and υ)] and Ce3+ sites [Ce3d9 4f2 O2p5 (μ0 and υ0) and Ce3d9 4f1 O2p6 (μ' and υ' )] [27]. The percentage of Ce3+ as a descriptor of oxygen vacancies was determined to be 16% for fresh Ni/CeO2 (Fig. 4(b)). Consistent with the in situ Raman results, reduction pretreatment promoted the number of oxygen vacancies to 43% for NiCe-H and 46% for NiCe-CO, respectively. However, the corresponding O 1s spectra shows no difference for activated Ni/CeO2 catalysts (Fig. S4 in Appendix A). Overall, our XPS results demonstrate that both of the two activation methods reduce the catalyst but with similar degrees of reduction and surface elemental distribution (Table S4 in Appendix A). We also performed H2-TPR analysis on the Ni/CeO2 catalysts, and the two activated catalysts revealed comparable H2 uptake, which agrees nicely with the XPS findings (Fig. S5 in Appendix A).
《Fig. 4》

Fig. 4. Quasi in situ XPS spectra for Ni/CeO2 activated in different environments show (a) the Ce 3d region and (b) the Ni 2p region.
The surface oxidation states of Ni and CeO2 are not affected by adding CO during activation; thus, we hypothesize that the superior CO methanation performance of NiCe-CO is related to the polycrystalline nature of metallic nickel nanoparticles. Polycrystalline nanoparticles contain grain boundaries, which usually have superior catalytic activities [28–30]. Herein, the catalyst surface condition was probed with in situ DRIFTS analysis. The catalyst was activated, flushed with N2, and exposed to reactants at certain temperatures. Upon introducing CO methanation reactants at 300 °C, we observed surface formate species from the interaction of CO with surface hydroxyls and surface carbonate species from the re-adsorption of CO2 byproduct (Fig. S6 in Appendix A) [31]. Linearly adsorbed *CO species progressively accumulates with slight redshift from about 2140 to 2050 cm–1 (Figs. 5(a) and (b)) [31]. The *CO species also form during activation by a mixture of CO/H2 but without an apparent peak shift (Fig. 5(c)). The redshift of *CO signal at the initial stage of the reaction is most likely associated with the reduction of mildly oxidized nickel surface that is generated during Ar flush. The infrared (IR) peak intensity of *CO species for NiCe-CO appears to be much higher than that of NiCe-H (Fig. 5(d)), which suggests a larger number of CO adsorption sites (i.e., exposed Ni0 sites) [32]. This could be further evidenced by the much greater uptake during H2 chemisorption for NiCe-CO (1.24 m3 ·g–1 ) as compared with NiCe-H (0.85 m3 ·g–1 ) (Fig. S7 in Appendix A).
《Fig. 5》
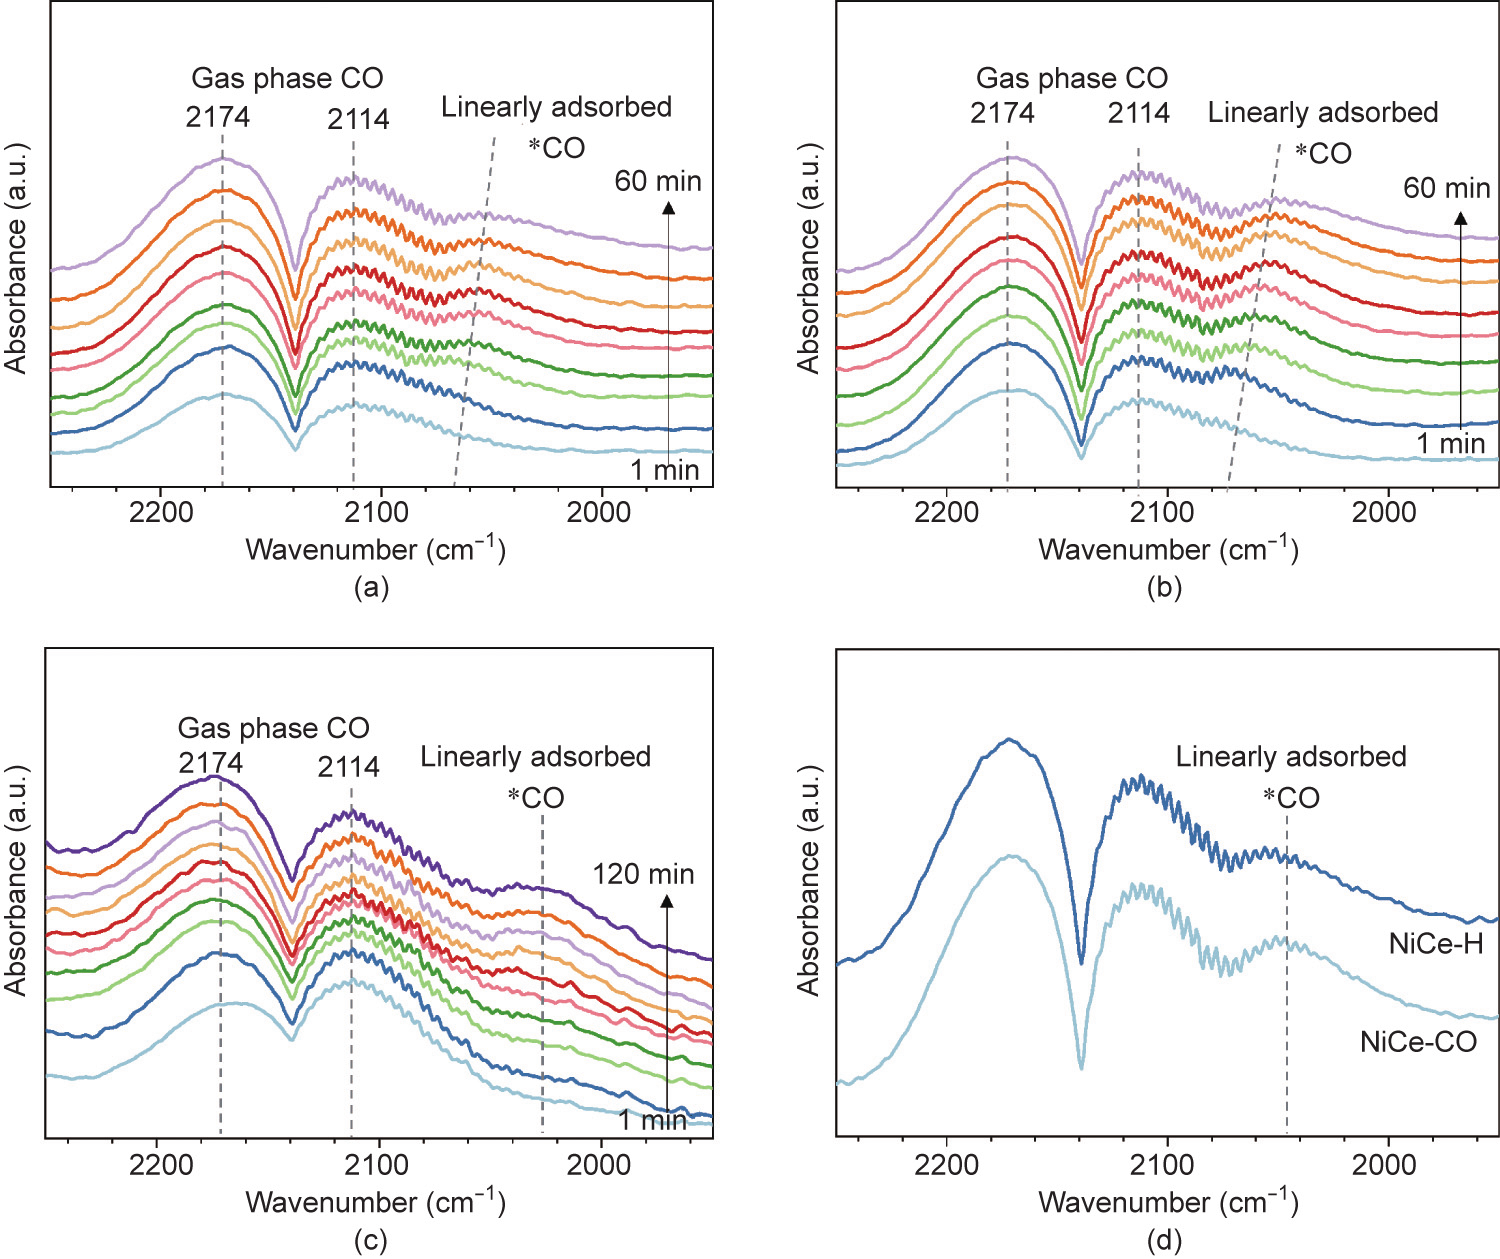
Fig. 5. In situ DRIFTS spectra of (a) NiCe-H and (b) NiCe-CO during the CO methanation reaction at 300 °C. (c) In situ DRIFTS spectra of Ni/CeO2 during the activation in a CO/H2 environment. (d) Comparison of IR spectra for NiCe-H and NiCe-CO after CO methanation at 300 °C for 60 min.
These data suggest a structure–activity relationship of activated Ni/CeO2 catalysts. NiO is reduced to metallic Ni during the activation, which provides active site for C–O bond breaking and CHx hydrogenation [3,4]. Activating Ni/CeO2 in a mixture of CO/H2 results in carbon species being deposited onto the catalyst surface. Meanwhile, the Ni particles in NiCe-CO exhibit a polycrystalline morphology with nanosized grains. The current findings show a diverse distribution of Ni0 facets after activation in CO/H2, which has yet to be reported. There are, however, many previous studies that describe the interaction between gas molecules/surface adsorbates and the catalyst surface during the reaction [33–36]. We hypothesize that our situation is due to the deposited carbon introducing anisotropic lattice strains at different locations of the nickel nanoparticles [37–39]. These carbon species might cover a portion of metallic Ni nanoparticles. However, the catalyst still contained abundant exposed Ni0 sites because the quasi in situ HS-LEIS analysis shows Ni atoms on the outermost surface layer of both NiCe-H and NiCe-CO (Fig. S8 in Appendix A). Unless polymeric carbon or dense ordered graphite layers are formed, these carbon species are usually porous and have a minor effect on the catalytic activity [40]. The polycrystalline nature of reactant-activated catalyst results in many grain boundaries showing greater CO adsorption capacity and higher apparent methanation activity. The intrinsic reaction kinetics of CO methanation reactions at the nickel grain boundary sites, however, have yet to be elucidated and require further detailed kinetic and theoretical analyses.
《4. Conclusions》
4. Conclusions
To summarize, different pretreatment conditions were found to affect the surface structure of the supported Ni/CeO2 catalyst. In contrast to the traditional activation procedure in hydrogen, activating the catalyst in a mixture of CO/H2 creates polycrystalline Ni nanoparticles that possess abundant grain boundaries with a larger CO adsorption capacity, which benefits CO methanation. The formation of polycrystalline Ni nanoparticles may be related to carbon deposition on the surface. This work provides a new strategy to optimize the catalyst structure by manipulating activation conditions.
《Acknowledgments》
Acknowledgments
This work is sponsored by the National Natural Science Foundation of China (22078089 and 22122807), Natural Science Foundation of Shanghai (21ZR1425700), Program for Professor of Special Appointment (Eastern Scholar) at Shanghai Institutions of Higher Learning and Shanghai Sailing Program (19YF1410600). The research at Lehigh University was supported by the Center for Understanding and Control of Acid Gas-Induced Evolution of Materials for Energy (UNCAGE-ME), an Energy Frontier Research Center funded by Department of Energy, Office of Science, Office of Basic Energy Sciences (DE-SC0012577).
《Compliance with ethics guidelines》
Compliance with ethics guidelines
Xinyu Cao, Tiancheng Pu, Bar Mosevitzky Lis, Israel E. Wachs, Chong Peng, Minghui Zhu, and Yongkang Hu declare that they have no conflict of interest or financial conflicts to disclose.
《Appendix A. Supplementary data》
Appendix A. Supplementary data
Supplementary data to this article can be found online at https://doi.org/10.1016/j.eng.2021.08.023.


 京公网安备 11010502051620号


