

《1. Introduction》
1. Introduction
The Hong Kong–Zhuhai–Macao Bridge (HZMB), consisting of a cross-sea bridge of 29.6 km, an immersed tube tunnel of 6.7 km, two sections of linking roads, and two artificial islands with a total area of 100 000 m2 , is the longest bridge-cum-tunnel sea crossing in the world (Fig. 1(a)), which is considered one of the landmarks in offshore engineering [1,2]. As this project is in the subtropical marine monsoon zone, frequent typhoons, rainstorms, and storm surges pose high technical requirements for the construction of the two artificial islands. In addition, owing to a nearby White Dolphin Reserve, disturbance to the seabed ecosystem had to be minimized, and a cofferdam was required during land reclamation to reduce pollution. Considering the above factors, an innovative artificial island scheme that utilized 120 integral large-diameter steel cylinders as the island wall structure was proposed (Fig. 1(b)). As shown in Fig. 2, 22 m diameter steel cylinders and auxiliary arcuate plates were first installed into the seabed and backfilled with sand one by one. After the island enclosure was formed, sand filling and drainage inside the island were conducted, with the steel cylinders acting as a mega cofferdam. This method not only accelerated the drainage and consolidation processes of the island but also reduced pollution. The steel cylinder enclosure also enabled simultaneous construction of the inner land reclamation and the outside revetment dyke. By using this innovative land reclamation method, a great achievement of completing the two artificial islands in 207 days was attained [3,4].
《Fig. 1》
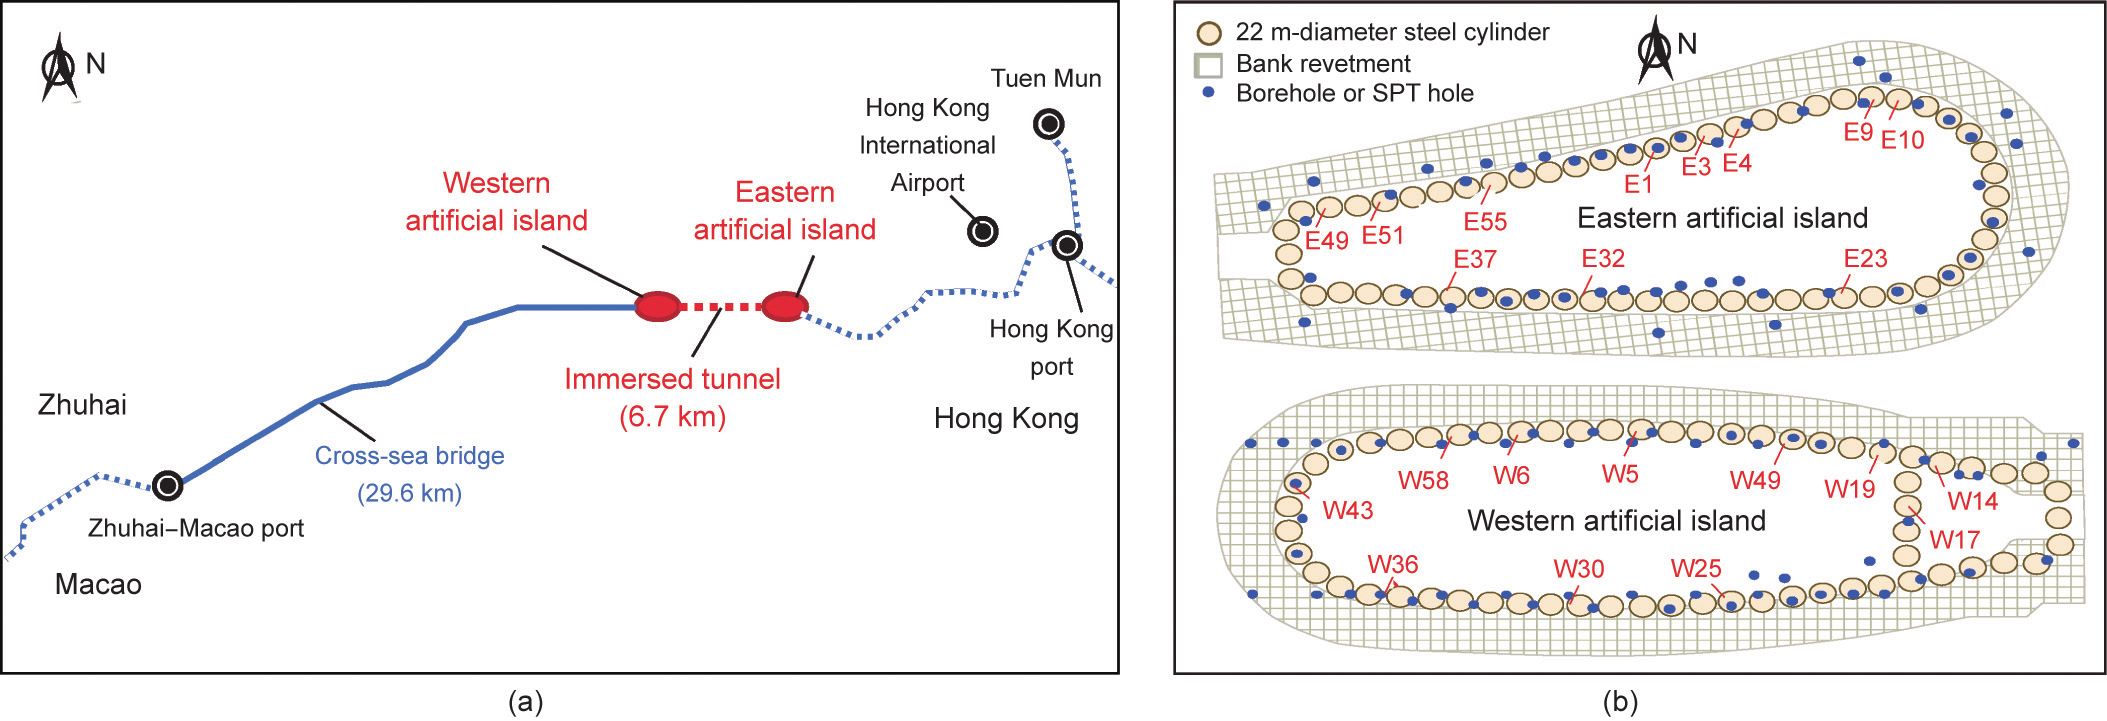
Fig. 1. Illustration of (a) the HZMB and (b) the eastern and western artificial islands. SPT: standard penetration test.
《Fig. 2》
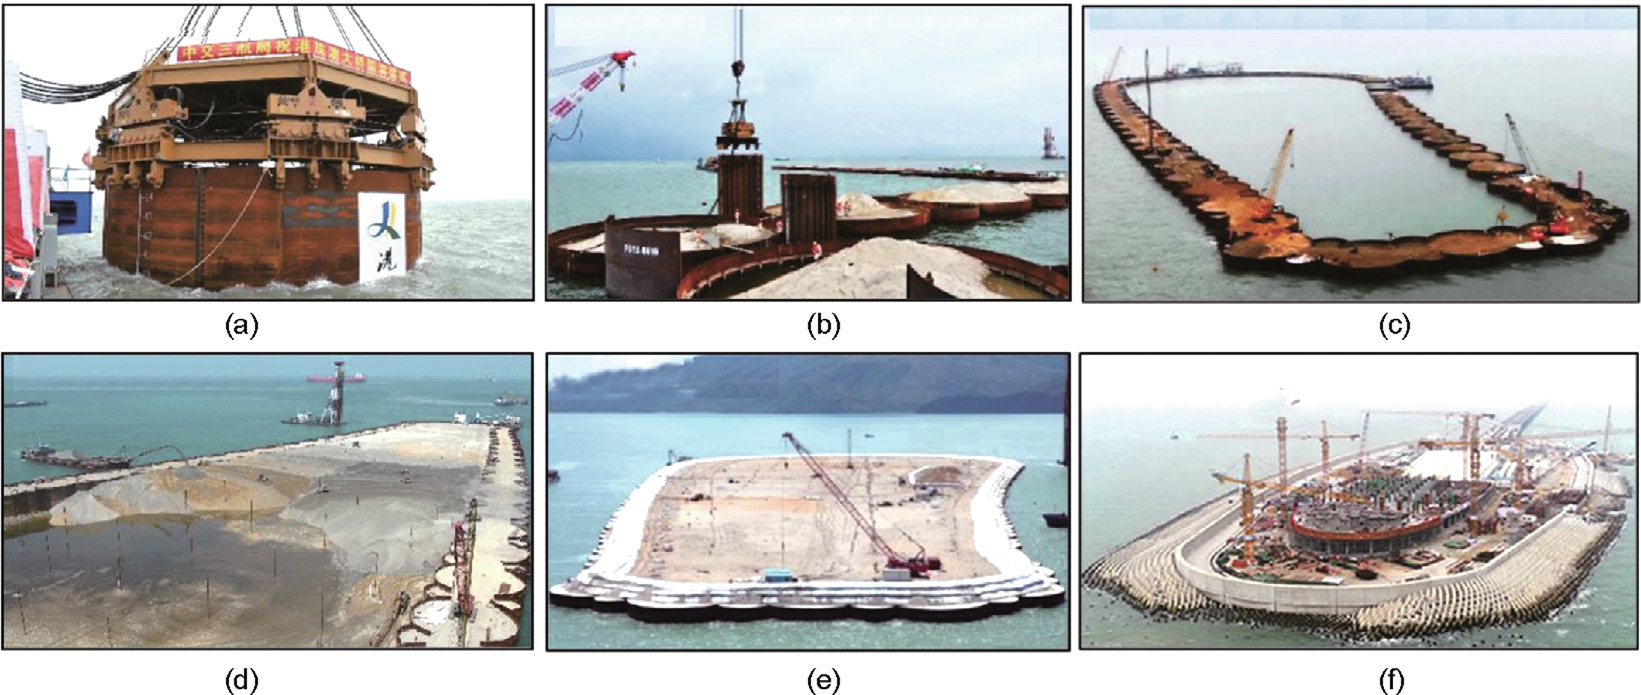
Fig. 2. Photos of the construction procedure of the artificial island: (a) cylinder installation, (b) auxiliary arcuate plate installation, (c) island enclosure backfilling and drainage, (d) island backfilling, (e) island drainage, and (f) simultaneous construction of the tunnel portal and the revetment.
An open-ended thin-wall bottomless cylindrical shell with a diameter larger than 5 m is defined as a large-diameter steel cylinder [5], which has been widely used as temporary cofferdams in coastal and offshore engineering constructions. Previously, large-diameter steel cylinders were assembled in situ by penetrating interlocked sheet piles one by one, which is time-consuming and of low quality [6]. In the Kansai International Airport in Japan, preassembled steel cylinders made of interlocked sheet piles were integrally driven as a permanent lateral retaining structure, exhibiting a high construction efficiency but unsatisfactory strength and water tightness [7]. In the HZMB, integral cylinders formed by two large steel shells supplemented with watertight auxiliary arcuate plates have been invented and employed, which possess better integrity, waterproofness, and mechanical properties [5]. An eight-vibratory hammer group was employed to successfully drive 120 integral steel cylinders with a diameter of 22 m and an average height of 45 m. The successful HZMB experience not only motivated the use of the multiple-hammer system at other offshore developments (such as Riffgat Wind Farm in Germany, Anholt Wind Farm in Denmark, and the Shenzhen– Zhongshan Channel in China) but also highlighted the feasibility and potential application of large-scale steel cylinders in offshore engineering in the future.
Drivability is a key issue in the installation of large-diameter steel cylinders. The large weight and embedded depth, significant soil resistance, and potential buckling and yielding of the steel cylinders, and synchronization control of the hammer group pose great challenges to their installation. Tara et al. [1] and Xu et al. [8] conducted drivability analyses using different methods. Although eight American Piledriving Equipment (APE) 600-type vibrators were verified to meet the needs, the analysis results obtained by different pile driving analysis methods are quite different, and the penetration rate and time cannot be accurately predicted. This brought considerable adverse impacts on the construction control of the HZMB. The difficulties in the analysis of the drivability of large-diameter cylinders lie in two aspects: the determination of vibratory-driving soil resistance and scale effects. Many efforts have been made to study the mechanism and influencing factors of vibratory pile driving through model tests [9,10], in situ tests [11,12], analytical methods [13], and numerical methods [14,15]. However, previous research mainly focuses on regular piles, typically smaller than 1 m in diameter. The drivability of 22 m diameter steel cylinders driven by a hammer group has rarely been investigated. Extrapolating the current analysis methods to large-diameter thin-wall cylinders remains a challenge.
The research team engaged in the geological exploration, preliminary design, and construction monitoring (especially field monitoring of steel cylinders) of the artificial islands for the HZMB, attaining rich on-site experiences and field data. Based on the field monitoring of steel cylinder installation, the objectives of this paper are ① to analyze the penetration rate of large steel cylinders for the eastern and western artificial islands utilizing geological survey data and penetration records; ② to study the dynamic response of an instrumented large steel cylinder based on strain monitoring data; ③ to evaluate the current design methods for estimating vibratory driving soil resistance for drivability analyses; and ④ to propose a modified method considering the scale effect as a reference for engineering practice.
《2. Theoretical basis of vibratory piling》
2. Theoretical basis of vibratory piling
《2.1. Drivability analysis using the wave equation》
2.1. Drivability analysis using the wave equation
Drivability analysis aims to evaluate the pile driving resistance, pile stresses, penetration period, and suitability of hammers to guide construction. Previous drivability analysis methods, such as pile driving formulas, consider the pile as a rigid body, which can check the pile capacity and the driving system but predict neither the pile response nor the penetration rate and duration [16]. A more elaborate solution is the wave equation analysis established by Smith [17], which takes the pile as a deformable medium and considers the propagation of stress waves along the pile. The governing equation of linear one-dimensional wave propagation is
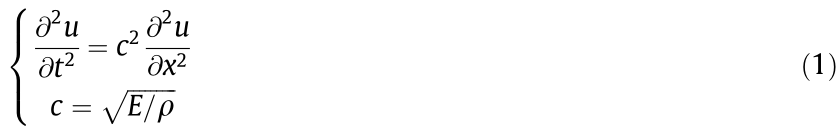
where c is the stress wave propagation velocity; u is the particle displacement at time t and location x; and E and ρ are the Young’s modulus and density of the pile material, respectively. The general solution to this equation includes two wave components propagating in opposite directions, that is, downward and upward for piling.
If a downward stimulating force, Fdown, starts at t1 from the pile top, it reaches the pile bottom at t1 + H/c (where H is the pile length), is reflected as an upward wave, Fup, and finally returns to the top at t2 = t1 + 2H/c. The relationship between the total soil resistance R, pile force P, and pile velocity V measured at the pile top is

where Z is the pile impedance. For the steel cylinders in the HZMB with an average height of 45 m and a stress wave velocity of 5188 m·s–1 in steel, the time for a round trip of the stress wave along the cylinder shaft (t2 –t1) is approximately 0.02 s. The downward stimulating force of an APE 600 hammer is a sinusoidal wave with a period of 0.08 s (12.58 Hz), varying between compressive (taken as positive) and tensile (taken as negative). Assuming Fdown starts as compressive, three possible toe responses are shown in Figs. 3(a)–(c), where 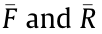 represent the force and soil resistance normalized by the maximum value of Fdown, respectively. When the pile toe is free (Fig. 3(a)), the reflective wave, Fup, starts as tensile with the same amplitude and period of Fdown. When the pile toe is fixed (Fig. 3(b)), Fup starts as compressive. As the sum of Fup and Fdown, the total force measured at the pile head, P, shows the same period but a larger amplitude compared with Fdown. If the pile toe and soil separate during the pile upward movement, there is no tensile soil resistance. Fup and P, in this case, are shown in Fig. 3(c), where the compressive component of P is larger than the tensile component, and the waveform changes under this unbalanced toe condition.
In practical piling, the soil resistance acts on both the pile shaft and toe with complex soil–pile interactions, which requires numerical methods to solve the wave equation for drivability analysis. The pile is discretized into mass points connected by springs, and the pile–soil interaction is modeled by springs and dashpots. However, current drivability analysis programs, such as GRLWEAP and Vipere, are for small-scale piles driven by a single hammer [18]. Properly expanding the usage to a large-diameter cylinder driven by multiple hammers is a critical problem in the HZMB.
《Fig. 3》
Fig. 3. Stress waves under three different toe conditions: (a) free toe (Rtoe = 0); (b) fixed toe (Vtoe_up = 0; Vtoe_down = 0); and (c) contact toe (Vtoe_down = 0; Rtoe_up = 0). T: time period of the vibration. Rtoe: toe resistance; Rtoe_up: upward toe resistance; Vtoe_up: upward toe velocity; Vtoe_down: downward toe velocity. : the force and soil resistance normalized by the maximum value of Fdown, respectively.
《2.2. Vibratory driving soil resistance》
2.2. Vibratory driving soil resistance
The ‘‘disturbed resistance” of soil during vibratory piling includes two parts: static resistance to driving, Rsd, and dynamic damping resistance, RDamp. The static resistance to driving under pile installation is usually smaller than the long-term static resistance, Rs, with two widely recognized mechanisms: ‘‘friction fatigue” and ‘‘liquefaction” [16]. Friction fatigue indicates the degradation of soil resistance under cyclic loading due to shearing contraction, particle rearrangement, and crushing [10,19]. White[20] demonstrated that friction fatigue increases with the number of loading cycles, reaching the minimum capacity value, 18%–36% of the peak, at approximately 104 cycles. For impact pile driving, the degree of friction fatigue is often related to the distance from the pile toe, as in the method of the University of Western Australia (UWA-05 method) and the method proposed by Alm and Hamre (A&H method) [21]. For vibratory piling, due to a large number of vibration cycles, constant minimum shaft friction is often assumed, quantified by a reduction factor, β [1,22]. However, the friction fatigue approach fails to consider the accumulation of pore water pressure under high-frequency vibrations, which leads to a rapid decrease in effective stress and soil resistance [23]. Holeyman et al. [24] proposed a method that interpolates the vibratory soil resistance between the long-term static resistance and the ‘‘liquified resistance,” according to the vibrating system acceleration [24].
Soil plugs are another installation factor for open-ended piles and significantly influence the effective radial stress and resistance acting on piles [25]. The plugging effect can be quantified by an incremental filling ratio IFR =  , where
  is the increment of soil plug height, and
  is the increment of penetration depth [26]. With IFR decreasing from 1 to 0, the mechanism alters from an internal–external shaft resistance system with unplugged penetration to an external shaft and base resistance system with plugged penetration. Both experimental and numerical evidence demonstrated the dependency of the plugging effect on the pile diameter [27–30]. However, the current estimation methods for vibratory soil resistance are derived from tests on closed-ended piles or small-diameter open-ended piles with soil plugs. The scale effect should be considered when extrapolating to a 22 m diameter thin-wall structure.
《3. Vibratory installation of large-diameter cylinders for the HZMB》
3. Vibratory installation of large-diameter cylinders for the HZMB
《3.1. Site characterization》
3.1. Site characterization
Before installing the cylinders, as shown in Fig. 1(b), boreholes were sunk, and standard penetration tests (SPTs) were carried out to characterize the soil stratification, soil properties, and bearing capacity of each stratum. According to borehole data, the seabed conditions at the eastern and western island sites can be divided into eight strata (L1–L8; Fig. 4(a)). Layer L3 at the eastern site is Late Pleistocene continental proluvial deposits, with the average water content, liquidity index, void ratio, and natural density of L3 being 34%, 0.31, 0.95, and 1900 kg·m–3 , respectively. The effective cohesion and friction angle of L3 measured through the consolidated undrained triaxial test are 36 kPa and 20.7°, respectively, showing that L3 is stiffer than the underlying layers. Fig. 4(a) also shows that the site condition of the eastern island is more complex than that of the western island. Due to the low bearing capacity of the muck layer (L1), dredging and backfilling with coarse sand were conducted for both sites. The SPT results of the soil adjacent to the steel cylinders are shown in Fig. 4(b). In general, the SPT N blow counts at both sites increase with depth, indicating a general trend of stronger soils over depth. The SPT N values at the eastern island site are more scattered due to the more complexity. There are abrupt increases in SPT N values between –20 and –30 m on the eastern island, contributed by L3.
《Fig. 4》
Fig. 4. Site conditions of the eastern and western artificial islands: (a) site stratification and (b) SPT blow count.
《3.2. Layout of steel cylinders and installation procedure》
3.2. Layout of steel cylinders and installation procedure
Fig. 1(b) illustrates the layout of steel cylinders for the eastern and western artificial islands, where 59 and 61 cylinders were installed to form the island enclosure, respectively, with an outer diameter of 22 m and a wall thickness of 16 mm. Each cylinder was reinforced by longitudinal and circumferential ribs to avoid buckling. The weight and height of the cylinders were in the ranges of 451.44–513.04 t and 40.5–50.5 m, respectively. Apart from the steel cylinders, auxiliary arcuate plates were installed between adjacent cylinders for lateral retaining and waterproofing, which is another innovation in the HZMB.
The procedure of installing the steel cylinders is as follows:
(1) The steel cylinder was hoisted by a floating crane with a lifting capacity of 4000 t. After the installation coordinates were settled by a positioning barge, the plane angle of the cylinder was adjusted to ensure the correct positions of the U-channel for the connection with the auxiliary arcuate plates.
(2) The tension of the crane was gradually released to control the self-weight sinking of the cylinder at a safe rate until no further sinking occurred with zero tension.
(3) The vibration system and the measurement system started for intermittent vibratory penetration with interruptions to maintain good working conditions of the hammers. Meanwhile, a nonzero tension of the crane was ensured during the entire vibratory piling process to control the penetration rate and guarantee construction safety.
(4) The vibratory piling was terminated once the designated embedment depth was reached.
(5) The cylinder was backfilled with sand instantly after penetration to ensure stability. Backfilling and vibroflotation were conducted layer by layer, and drainage was carried out afterward.
(6) Two auxiliary arcuate plates were inserted into the Uchannel of the adjacent cylinders by self-weight first and then by vibratory penetration with two APE 200-5 hammers.
(7) Backfilling and drainage were conducted in the area enclosed by adjacent cylinders and two auxiliary arcuate plates.
The vertical profiles of these steel cylinders are shown in Fig. 4(a), where the solid black bottom lines represent the final locations of the cylinders, and the dashed lines represent the depth of self-weight sinking. The cylinders for the western island were sunk by approximately 15 m by self-weight first and then driven for 5–10 m using the vibratory hammer group. In contrast, the cylinders at the eastern island sank by self-weight within 5 m but experienced vibratory penetration depths of approximately 20 m. The maximum penetration depth is 33 m at the eastern site.
《3.3. Equipment and instrumentation》
3.3. Equipment and instrumentation
As shown in Fig. 5, the vibration driving system consists of eight APE 600 hydraulic vibratory hammers that are fixed on an I-shaped ring beam, with technical specifications shown in Table 1. Two hydraulic clamps are installed under each hammer to connect with the steel cylinder. The whole system is suspended with a floating crane by two hooks for the sake of verticality adjustment. To realize the synchronicity of the eight hammers, the multistage transmission of the bidirectional gearbox is employed to counteract the phase difference when vibrators are started or shut down. All hydraulic motors share the same oil source to ensure consistent flow and pressure. In addition, resonant beams linking all the hammers are used to further improve the synchronicity of these hammers.
《Fig. 5》

Fig. 5. Photos of the vibratory driving system. (a) Vibratory hammer APE 600; (b) eight-hammer-group and resonant beam; (c) scale marking with a resolution of 0.1 m; (d) total station; (e) strain gauges; (f) distribution of strain gauges. H1–H8: the eight hydraulic vibratory hammers; S: strain gauge.
《Table 1》
Table 1 Specifications of the APE 600 hydraulic vibration hammer.

Scale marking with a resolution of 0.1 m was painted outside the steel cylinder to record the penetration depth at a unit period during the vibratory installation (Fig. 5(c)). The total station and the Global Position System (GPS) were used to monitor the coordinates of reference points on the cylinder to evaluate the verticality and plan deviation. Cylinder W36 at the western island was equipped with strain gauges to monitor its mechanical response. As shown in Figs. 5(e) and (f), resistance strain gauges were installed on the cylinder wall in four columns under hammers 1, 4, 5, and 8, with vertical spacing from 1.5 to 10.0 m. The strain gauges were configured in a single bridge form, covered with epoxy resin for waterproof, and protected by steel grooves.
《4. Performance of large-diameter cylinders during installation》
4. Performance of large-diameter cylinders during installation
Combining the vibratory penetration records and site conditions, the penetration rate and installation accuracy of the steel cylinders at both artificial islands are analyzed. The dynamic response of Cylinder W36 is studied in detail based on measured strains.
《4.1. Penetration rate》
4.1. Penetration rate
Eliminating the pausing intervals, the cumulative vibratory penetration times of cylinders at the eastern and western islands are statistically analyzed. All 61 steel cylinders at the western island were installed within ten effective minutes, with 78% of them less than 5 min. In contrast, the installation time at the eastern island was scattered: 40 out of 59 cylinders were vibratorily penetrated in 25 min, but 7 cylinders took more than 60 min to reach the design depth. Fig. 6 presents time histories of the cumulative penetration for representative cylinders. The time histories display a similar mode at the western site: rapidly rising with initial rates of 1.7–5.6 m·min–1 and then slowing down as the embedded depth increases. In contrast, some of the time histories at the eastern island show very slow initial penetration rates due to the presence of the stiff clay layer, L3. After passing through this layer, the penetration rate increases. The difference between the eastern and western islands is mainly due to the complex site conditions of the eastern site, particularly the presence of L3. As L3 is discontinuous with varying thicknesses, the time histories at the eastern island vary greatly among different cylinders.
《Fig. 6》

Fig. 6. Vibratory penetration records of typical large-diameter steel cylinders for artificial islands. (a) Western island; (b) eastern island.
The SPT N value and vibratory penetration rate of four typical cylinders are integrated. Fig. 7(a) shows the results of Cylinder W36, which was vibratorily driven from –30.6 to –42.0 m. The penetration rate is relatively large in the silty clay layer (4– 6 cm·s–1 ) and decreases slightly with penetration depth. It sharply decreases to zero after reaching the bearing stratum. Both boreholes and SPT tests show an interlayer of medium sand with high N values mixed in the silty clay layer, but it hardly affects the penetration rate. Therefore, this layer might be a local mutation instead of an interlayer covering the entire cylinder spot. Cylinder W19 sank from –27.9 to –37.0 m by vibratory driving, with SPT N values monotonically increasing from 10 to 20 and then slightly decreasing at –35 m (Fig. 7(b)). Correspondingly, the penetration rate also decreased with depth first and then increased when encountering softer soil.
The penetration of Cylinder E9 from –21.6 to –38.1 m is presented in Fig. 7(c). E9 encounters continental clay layer L3 with an SPT blow count as high as 33 at the beginning of vibratory piling. Therefore, the penetration rate is low in the initial stage, and the cumulative time to pierce through this layer is very long: approximately 75 min to penetrate 5 m. After passing through this layer and entering the silty clay layer, the penetration rate increases sharply and then decreases slightly with embedded depth. The duration for the second stage is only approximately 20 min, with a penetration of 12 m. By comparison, the seabed where Cylinder E55 is located also contains layer L3, but E55 passes through this layer by self-weight (Fig. 7(d)). The cumulative installation time of E55 is 18 min for a penetration of 20 m.
《Fig. 7》
Fig. 7. Relationships between SPT blow count and penetration rate of four cylinders: (a) W36, (b) W19, (c) E9, and (d) E55. L1: backfilled sand; L2: mucky soil; L3: clay; L4: mucky soil; L5: silty clay; L6: silty clay with sand interlayer; L7: medium sand; L8: medium coarse sand.
Although the penetration rate on the western island is relatively high, indicating an ‘‘overcapacity” of the vibration system, the eight-vibrator group is proven indispensable on the eastern artificial island due to the stiff clay layer L3. Considering the cost of accessorial structures, such as the I-shaped ring beam and hammer clampers, it is more economic to use the same vibratory penetration system for these two artificial islands, even if the soil stratifications at these two sites are different. Instead of decreasing the hammer numbers, it is more feasible to increase the tension of the crane or decrease the hammer output power to slow down the penetration at the western site for construction safety.
《4.2. Installation accuracy》
4.2. Installation accuracy
The verticality of the large-diameter steel cylinders was adjusted during vibratory installation using two hooks lifting the vibration system. Statistics of the cylinder inclination after installation are presented in Fig. 8(a). The inclinations of 100% cylinders at the western island and 95% cylinders at the eastern island are less than 1%. The difference between the two sites is attributed to the complex site conditions of the eastern island. Compared to the minimum verticality requirement for offshore pile construction, that is, 2% for offshore wind turbines [31], the verticality control of the large-diameter thin-wall cylinders in the HZMB was of excellent quality.
The statistics of the radial distance between the designated and final centers of the steel cylinders,  are presented in Fig. 8(b). It shows that 100% of the cylinders at the western site and 97% of those at the eastern site deviated with
  less than 5%, where Di is the inner diameter of the open-ended cylinder. According to the stratification in Fig. 4(a), stiff clay layer L3 is relatively thick near cylinders E10–E13 and E49–E51, and the interfaces between different soil layers are more uneven, which leads to larger deviations of these cylinders. In addition, since the steel cylinders are connected by auxiliary arcuate plates, the deviation of one cylinder could affect the positions of other connected cylinders and the auxiliary arcuate plates.
《Fig. 8》

Fig. 8. Statistics of installation accuracy of the steel cylinders. (a) Inclination; (b) plane deviation.  : distance from the designated position.
《4.3. Dynamic driving stresses in large-scale cylinders during installation》
4.3. Dynamic driving stresses in large-scale cylinders during installation
The axial driving stress in the cylinder during vibratory driving can be obtained by multiplying the measured axial strain by the Young’s modulus of steel (210 GPa). The time histories of axial stress near the top of Cylinder W36 are shown in Fig. 9(a) as an example. The waveforms are not ideally sinusoidal, indicating superpositions of the incident and reflected waves. The stress amplitude gradually increases with penetration. Based on wave equation theory, with increasing embedded depth during vibratory penetration, the soil resistance increases, which enlarges the amplitude of the stress measured near the top. Moreover, the compressive and tensile components are not equal, resulting from unbalanced soil resistance at the bottom, according to Fig. 3(c).
《Fig. 9》
Fig. 9. Axial stress measured near the top of Cylinder W36. (a) Time history; (b) spectral density distributions after fast Fourier transfer. S: axial stress; Samp: amplitude of the axial stress; W: power of the vibrational stress; f: frequency.
The fast Fourier transfer (FFT) is utilized to convert the time histories of stress into the frequency domain (Fig. 9(b)), indicating a first-order natural frequency of 12.58 Hz. For a steady forced vibration, the dominant frequency depends on the frequency of the exciting force rather than the fundamental frequency of the cylinder. Therefore, the in situ working frequency of the vibratory system to install Cylinder W36 was 12.58 Hz, which is approximately half of the rated maximum frequency of the APE 600 hammer, 23.3 Hz.
Fig. 10(a) presents the profiles of the stress envelope, that is, the maximum compressive and tensile stresses, along with the penetration depth. Both the compressive and tensile stresses gradually increase with the penetration depth, resulting from the increasing soil resistance during penetration. The maximum stress of Cylinder W36 during vibratory penetration is generally smaller than 200 MPa, which is far less than the yield stress of steel, verifying the safety of the installation process. Fig. 10(b) presents profiles of the stress amplitude of Cylinder W36 at 394 s, which were measured using the strain gauges shown in Fig. 5(f). The stress amplitudes measured by different columns of strain gauges show a consistent trend below ground level: gradually decreasing with increasing distance from the cylinder top. Since the stress amplitude reflects the vibration energy, the decreased axial stress amplitude in the cylinder with the embedment in the soil implies that a part of the vibration energy has been dissipated by the shaft friction.
《Fig. 10》
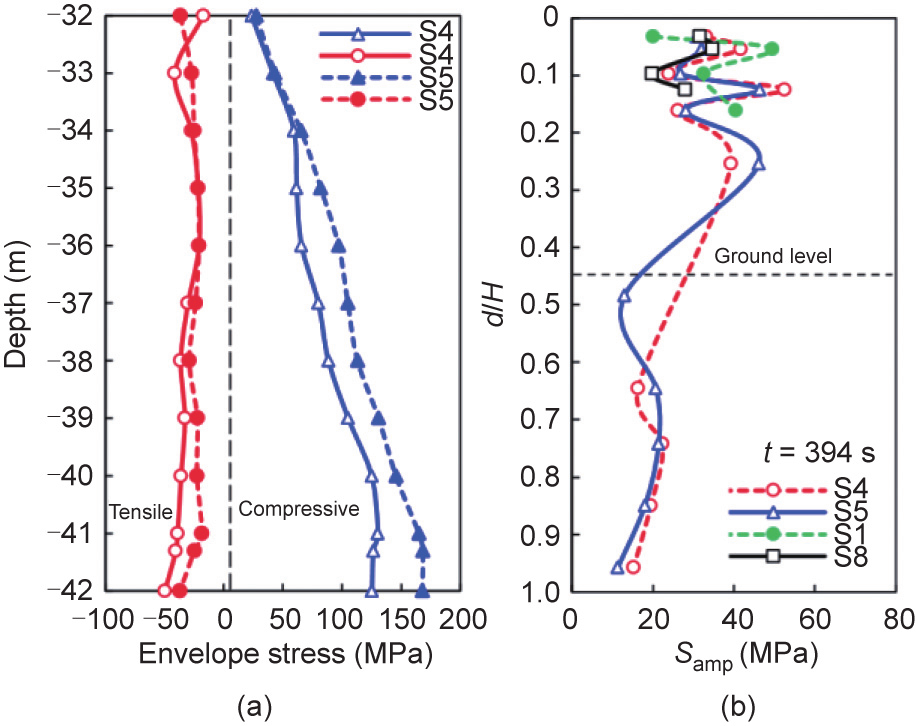
Fig. 10. Profiles of (a) stress envelope of Cylinder W36 along the penetration depth and (b) stress amplitude of Cylinder W36 along with distance from the cylinder top. d: distance from the cylinder top; H: height of the cylinder; S1–S5: stress measurement columns shown in Fig. 5(f).
《5. Drivability analysis for large-diameter cylinders》
5. Drivability analysis for large-diameter cylinders
Based on the wave equation method, drivability analysis is conducted using the drivability analysis software GRLWEAP. Three calculation methods for vibratory soil resistance are evaluated by comparing the back-analysis results with measured data. A modified method that considers scale effects is proposed for better prediction of the vibratory soil resistance.
《5.1. Basic inputs》
5.1. Basic inputs
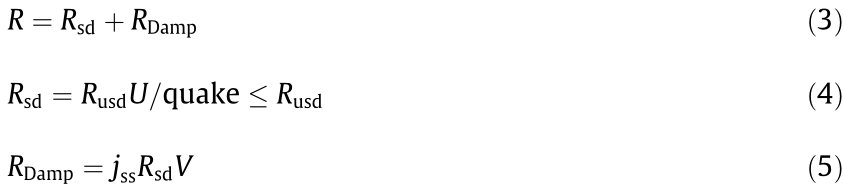
As shown in Eq. (3), the vibratory soil resistance model used in GRLWEAP consists of two parts: an elastoplastic spring to describe the static resistance to driving, Rsd, and a dashpot to represent the dynamic damping resistance, RDamp. The elastoplastic spring yields at a resistance Rusd, and the pile segment displacement, U, at the yield point is defined as a ‘‘quake.” Based on the recommendation of GRLWEAP for vibratory piling, a uniform value of quake, 2.54 mm, is used for all the soil layers. The Smith viscous damping (Eq. (5)) that is related to the velocity of the pile segment, V, and the static resistance to driving, Rsd, is used to describe the dynamic damping resistance, with recommended damping factors, jss, of 0.3 and 1.3 s·m–1 for sand and clay on the pile shaft, respectively [32,33].
An unplugged condition is applied by considering both internal and external shaft resistances and the toe resistance with an area of the steel cylinder cross-section. One APE 600 hammer and 1/8 steel cylinder are selected for analysis for the sake of simplicity. Based on the FFT on the stress time history of cylinder W36, the vibratory frequency of the hammer is taken as 12.58 Hz.
The tension of the crane suspending the hammers and the efficiency of the hammer are also necessary for drivability analysis, but they were not measured during construction. In this study, a constant crane tension of 100 kN, which is 0.12 times the total weight, is used in all cases for simplicity, and the hammer efficiency is adjusted to consider any uncertainties. Different hammer efficiencies are considered in GRLWEAP to attain a proper value that leads to the best agreement between the analysis results and the field data.
《5.2. Methods for estimating vibratory soil resistance》
5.2. Methods for estimating vibratory soil resistance
To determine the ultimate static resistance of soil, Rus, an SPTbased method, which requires both the SPT N value and soil properties, is used in GRLWEAP. The shaft and toe resistance in sand and clay can be calculated using the equations in Table 2 [30]. The profiles of Rus at the shaft and toe of Cylinder W36 are shown in Fig. 11.
《Table 2》
Table 2 SPT-based method for estimating the ultimate static resistance in GRLWEAP [30].

K0: lateral earth pressure coefficient; φ: internal friction angle of the soil; σ'v: effective vertical stress of the soil; Dr: relative density of sand; OCR: degree of consolidation of the soil.
《Fig. 11》

Fig. 11. Profiles of the ultimate static soil resistance for Cylinder W36.
For the drivability analysis of small-scale pipe piles or sheet piles, direct and indirect methods are available in engineering practice to determine the ultimate soil resistance to driving, Rusd [11].
Warrington method [34]. Based on data from 58 projects around the world, Warrington established a relationship between the SPT N value and the ultimate soil resistance to vibratory driving, Rusd, which is summarized in Table 3 [34].
《Table 3》
Table 3 Ultimate static resistance to driving for vibratory piling recommended by Warrington [34]

Jonker method [22]. As shown in Table 4 [22], a set of recommended values of the dynamic resistance reduction factor for different types of soil was summarized by Jonker in 1987 [22]. A constant reduction factor, βJonker, for a certain type of soil is used to estimate the static resistance to driving:

Mizutani method [35,36]. Considering the vibratory soil resistance between the static resistance and ‘‘liquified resistance,” an empirical method was proposed by the Construction Machinery Research Corporation, Japan, which also employs the reduction factor, β, but relates it to the acceleration of the vibration system:
《Table 4》
Table 4 Reduction factors for vibratory piling recommended by Jonker [22].

βJonker: constant reduction factor.proposed by Jonker [22].

where βmin is a minimum reduction factor under the liquified condition with recommended values of 0.15, 0.17, and 0.22 for sand, clay, and rock, respectively; m is a material-related parameter that is recommended as 0.52 for steel; η is the vibrational acceleration of the system. Based on force balance and Newton’s second law, the following relationship between β and η is derived to ensure drivability:
where Q0 is the total mass of the vibration system (hammer and pile). Combining Eqs. (7) and (8), the η value for each soil layer can be calculated. Substituting the maximum η into Eq. (7), the final β for different soil types can be determined.
《5.3. Comparison of different methods》
5.3. Comparison of different methods
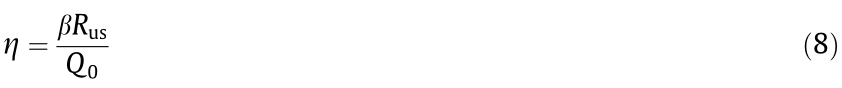
Taking the soil condition near Cylinder W36 as an example, profiles of the reduction factor at the pile shaft and toe are shown in Fig. 12(a) [22,34,35]. For the Warrington method, the shaft reduction factor is back-calculated using Eq. (6). For all the methods, the toe reduction factors are taken as four times the shaft reduction factor, but not larger than 1, for good curve fitting with field monitoring data. Combining the SPT-based static soil resistance with the dynamic reduction factor, the ultimate static resistance to driving using the above three methods for Cylinder W36 is plotted in Fig. 12(b) [22,34,35]. The Warrington method provides the largest reduction factor for the shaft resistance, while the Jonker method gives a lower boundary. The toe resistances from these methods do not vary much.
《Fig. 12》
Fig. 12. Profiles of (a) reduction factors and (b) ultimate static soil resistance to driving for Cylinder W36 [22,34,35].
Drivability analyses using the wave equation method with the above three different Rusd models were conducted. The hammer efficiency, e, is adjusted in the analyses to cover the uncertainties of the tension on the crane and the hammer efficiency in the real installation process. Different hammer efficiencies are tested in GRLWEAP to obtain a proper value that leads to the best agreement between the analysis results and the field data (e.g., the vibratory time histories and the stress profiles). For the same cylinder, the same hammer efficiency is adopted using different Rusd models for comparison.
The back analysis of Cylinder W36 is carried out with a hammer efficiency of 0.5. Fig. 13 shows the profiles of stress amplitudes at three snapshots. The analysis results below ground level show consistent trends with the measured values, where the stress amplitude gradually decreases along the depth. Comparing the three Rusd methods, the stress amplitudes calculated by the Warrington and Mizutani methods are larger than those calculated by the Jonker method at 24 and 85 s due to their overestimation of the vibratory soil resistance. At 394 s, the stress amplitude from the Warrington and Mizutani methods decreases because the cylinder cannot reach the target depth using these two methods. Fig. 14(a) [22,34,35] compares the generated time histories of the penetration depth, where the overestimation of the vibratory soil resistance by the Warrington and Mizutani methods is clearly reflected.
The same back-analysis procedure is also conducted for Cylinders W19, E9, and E55, with the calculated penetration time history curves shown in Figs. 14(b)–(d) [22,34,35]. It should be noted that the back-calculations for Cylinders E9 and E55 are divided into two stages with different hammer efficiencies to reach good agreement with field data. The small hammer efficiencies in the initial stages for Cylinders E9 and E55 (hammer efficiency e = 0.1) represent the accelerating process of the vibratory hammer and the released tensile force of the crane. By comparison, the vibratory soil resistance from the Jonker method is relatively small, resulting in a shorter installation time, while the Warrington method leads to the longest vibratory installation time. The results of the Mizutani method are in between.
《Fig. 13》
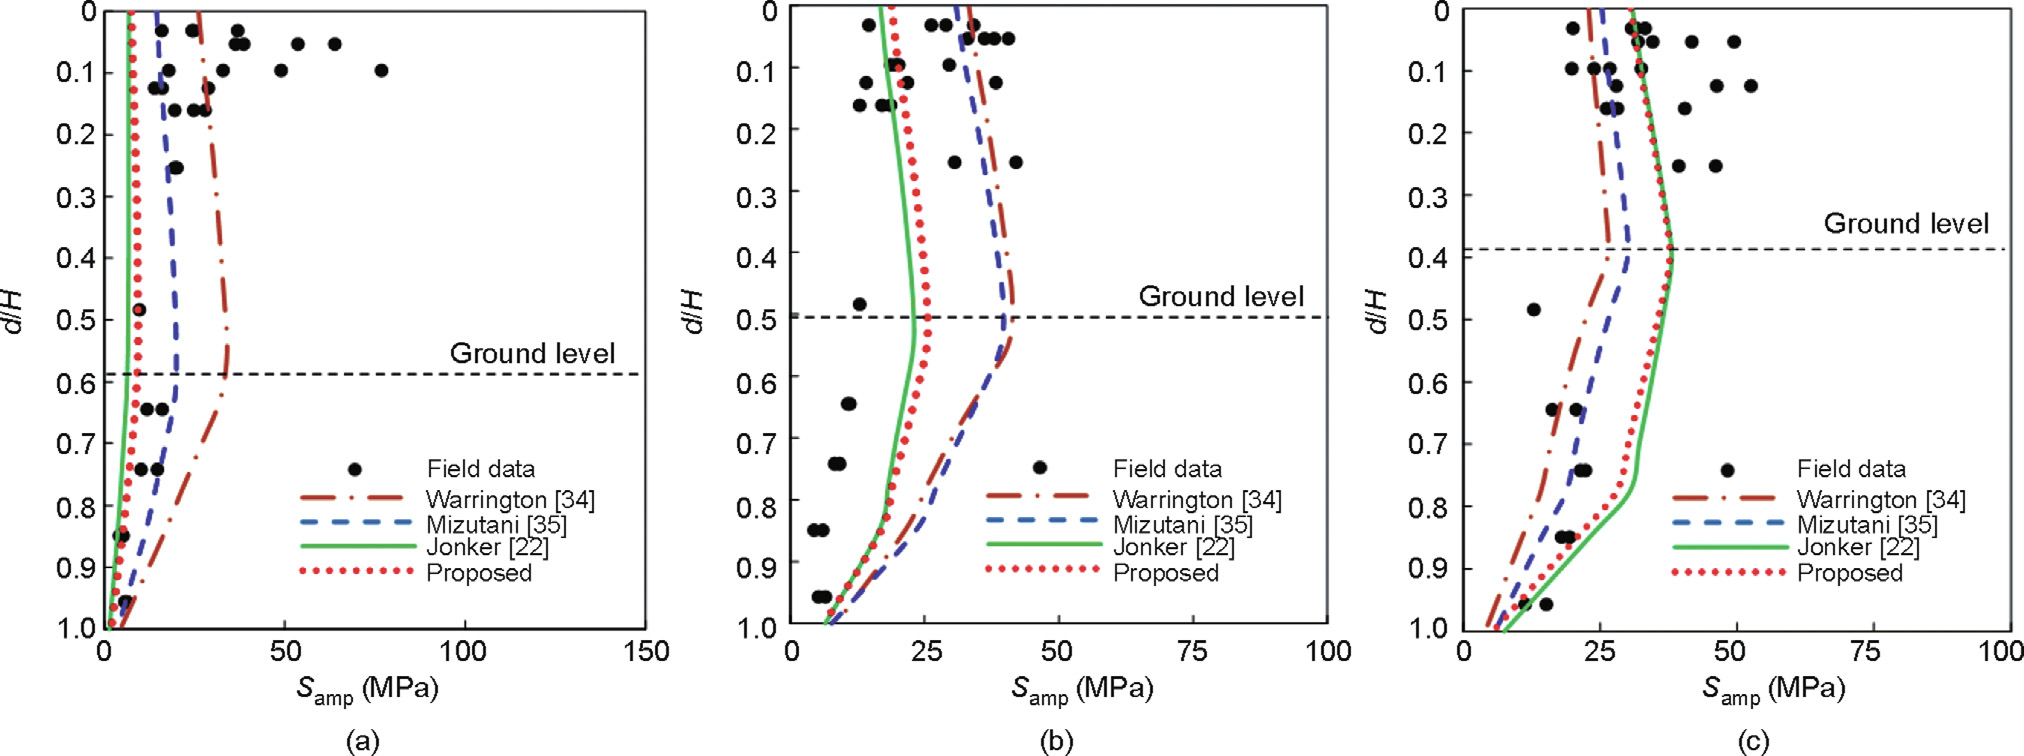
Fig. 13. Comparison of stress amplitudes of Cylinder W36 calculated by different methods with a hammer efficiency of 0.5. (a) 24 s; (b) 85 s; (c) 394 s.
《Fig. 14》
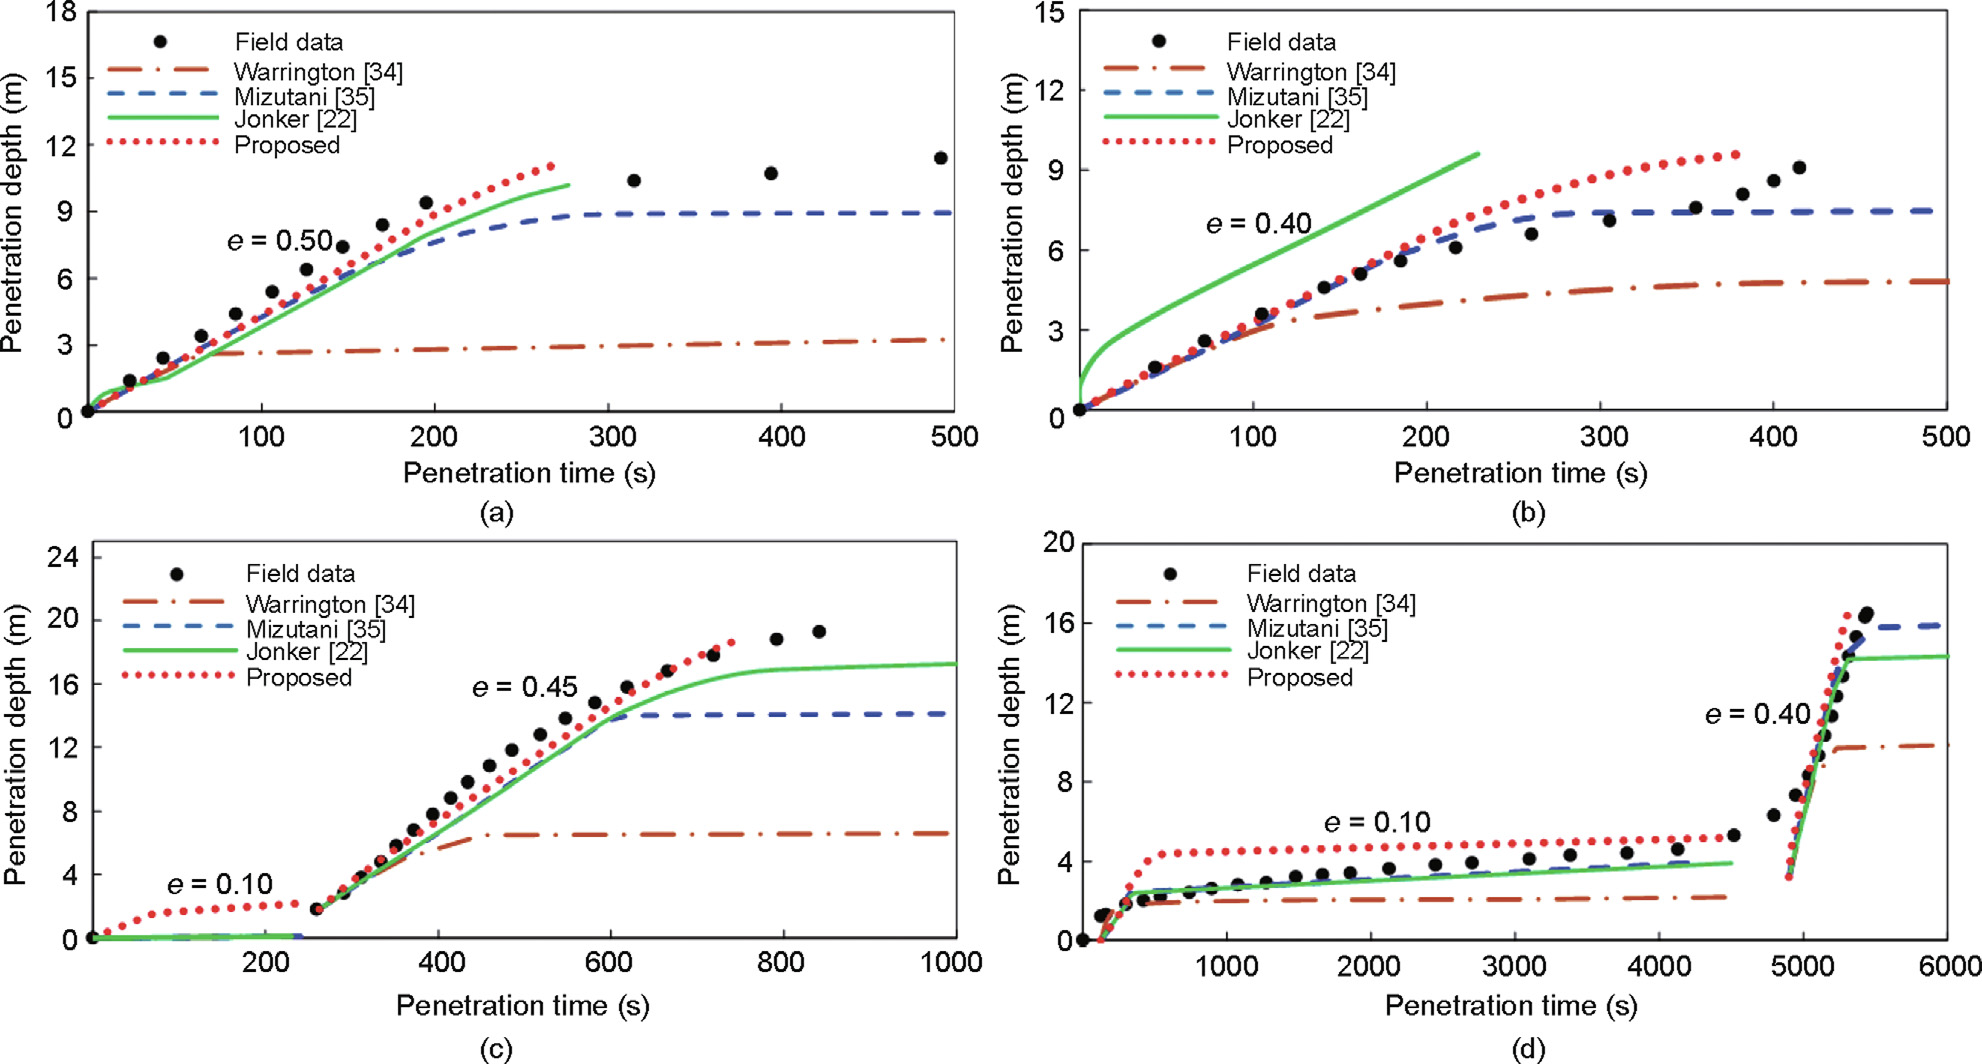
Fig. 14. Comparison of vibratory time histories calculated by different methods. (a) W36; (b) W19; (c) E55; (d) E9 [22,34,35]. e: hammer efficiency.
《5.4. Proposed method for vibratory soil resistance》
5.4. Proposed method for vibratory soil resistance
The above three methods and recommended parameters are derived from field tests on closed-ended piles or small-diameter open-ended piles with soil plugs, where a large volume of soil is displaced during installation, resulting in an increase in the effective radial stress on the pile shaft [37]. However, no plugging behavior was observed during the construction of the openended thin-wall cylinders in the HZMB, where only a minimal volume of soil was displaced, and a small increase in radial stress resulted. To consider the reduction in shaft resistance compared to that of closed-ended piles, an effective area ratio, Ar,eff, was proposed to correct the radial stress [21,38]:
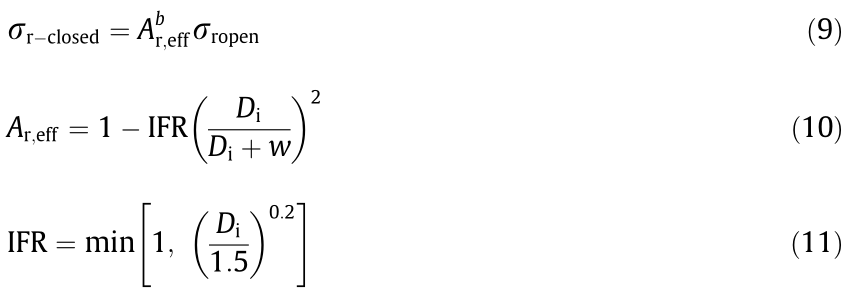
where σr-closed and σr-open are the radial stresses on the pile shaft for closed-ended and open-ended piles, respectively; IFR is the increment filling ratio of the soil plug defined in Eq. (11) when no in situ measurement is available [21]; w is the wall thickness of the openended pile, and b is an end condition index. By using the cavity expansion analogy by White et al. [38], b is derived as –(1– Kp)/2Kp, where Kp is the Rankine passive earth pressure coefficient [38].
In this paper, a normalized effective area ratio is employed to modify the minimum reduction factor in the Jonker method (Table 4 [22]):
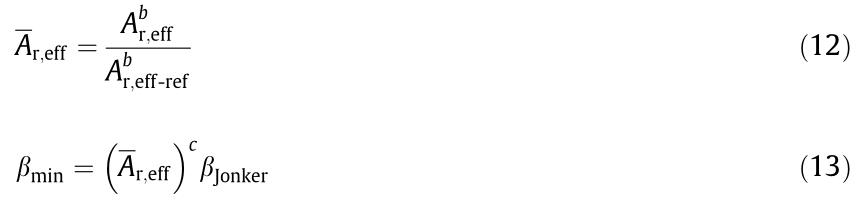
where Ar,eff-ref is a reference effective area ratio that is recommended as 0.1 for typical offshore open-ended piles [38]. An average value of 0.3 is taken for b for the seabed soil with a range of friction angles from 22° to 32°. βJonker is the reduction factor proposed by Jonker [22], as shown in Table 4. Through sensitivity analysis, a power index c = 0.3 is used in Eq. (13) to reach good agreement between the analysis results and the field data. The relationship between IFR,  and Di is plotted in Fig. 15(a). It shows that with the increasing pile diameter, IFR increases to 1 for the unplugged condition, while decreases to reflect the reduction of radial stress owing to the scale effects. For the steel cylinders in the HZMB (Di = 21.94 m, w = 16.00 mm), is calculated as 0.63. With known and βJonker values shown in Table 4 [22], the modified minimum reduction factor, βmin, can be calculated using Eq. (13).
《Fig. 15》
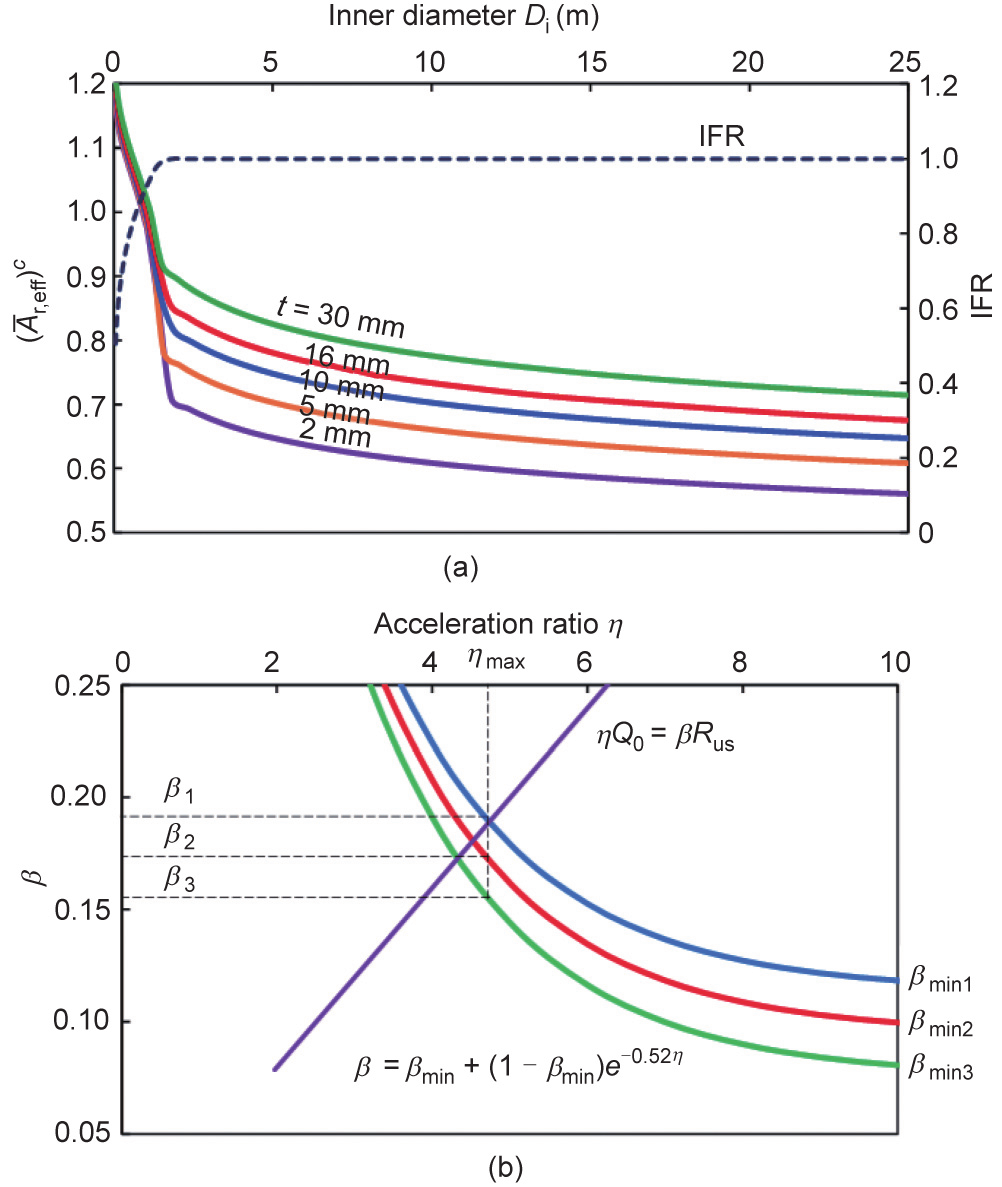
Fig. 15. Illustration of the proposed method for the reduction factor. (a) Relationships among Di, IFR and normalized effective area ratio; (b) determination of the reduction factor for different soil layers near Cylinder W36.
The coefficient βmin corresponds to the minimum vibratory driving resistance, which may not be reached during pile installation. To consider the degree of reduction that is influenced by the loading condition, Eqs. (7) and (8) of the Mizutani method are employed with the modified βmin from Eq. (13). The process of determining β using the proposed method for different soil layers neighboring W36 is shown in Fig. 15(b). The profiles of β and Rusd calculated using the new method are shown in Fig. 12, while the calculated driving stresses and penetration rates are shown in Figs. 13 and 14. The proposed method in this study considers the plug effect and scale effect and the reduction degree of soil resistance, which leads to closer results to the measured data.
Sensitivity analyses of the crane tension and the hammer efficiency are conducted using the proposed method. Fig. 16 presents penetration time histories with different hammer efficiencies and different crane tensions. Along with increasing hammer efficiency or decreasing crane tension, the penetration rate increases. The installation period is shortened from 265 to 114 s when the hammer efficiency increases from 0.5 to 0.9 (Fig. 16(a)). Meanwhile, the installation period increases to 1.5 times when the tension on the crane increases from zero to half of the total weight (Fig. 16(b)).
《Fig. 16》

Fig. 16. Comparison of penetration time histories of Cylinder W36 with different hammer efficiencies and crane tensions. (a) Sensitivity of the hammer efficiency; (b) sensitivity of the crane tension; T: tension of the crane; G: total weight of the cylinder and vibration system.
《6. Summary and conclusions》
6. Summary and conclusions
The vibratory penetration of 22 m-diameter steel cylinders for the HZMB was investigated based on geological surveys, field monitoring during installation, and analysis using wave equation theory. The following conclusions can be drawn:
(1) In the HZMB, 120 mega-cylinders with weights up to 513 t and penetration depths up to 33 m were successfully installed using an eight-vibratory hammer group. The verticality control of these large-diameter thin-wall cylinders is of very high quality: the inclinations of 100% cylinders at the western island and 95% cylinders at the eastern island are less than 1%; the plane deviations of 100% of the western island cylinders and 97% of eastern island cylinders are less than 5% of the diameter.
(2) Soil resistance is a key factor for cylinder installation. The strata at the western island are even and relatively soft; therefore, the vibratory installation time of the cylinders was short. Due to the presence of complex geological conditions and a stiff clay layer at the eastern island, the initial penetration rate of cylinders was slower, and verticality control was more difficult. The drivability of cylinders can be better predicted by appropriately considering the geological conditions.
(3) The stress amplitudes of Cylinder W36 below ground level have a clear decreasing trend with depth, indicating energy dissipation in soil due to soil resistance. The maximum stress of Cylinder W36 during vibratory penetration is smaller than 200 MPa, verifying the safety of the installation process. Through FFT on the stress time history, the in situ frequency of the vibrational system to install Cylinder W36 was found to be 12.58 Hz.
(4) A modified method with a normalized effective area ratio to calculate the vibratory soil resistance for open-ended thin-wall cylinders under unplugged conditions is proposed in this study. The static soil resistance profile, the geometry of the cylinders, and the output parameters of vibratory hammers are necessary inputs. The vibratory time histories and stress profiles calculated using the proposed method are closer to field measurements due to the proper estimation of the vibratory soil resistance and the consideration of scale effects in the proposed method.
(5) Along with the increasing hammer efficiency or decreasing crane tension, the penetration rate increases, and the installation period significantly decreases. The crane tension, hammer efficiency, cylinder acceleration, and soil pore pressure should be monitored in future field or laboratory tests to attain a good understanding of the soil structure interactions during vibratory penetration.
《Acknowledgments》
Acknowledgments
The authors acknowledge technical inputs and financial support from Tianjin Port Engineering Institute Co., Ltd. of CCCC First Harbor Engineering Co., Ltd. The work presented in this paper was supported by the National Natural Science Foundation of China (52001267), Tianjin Port Engineering Institute Co., Ltd., and Eunsung O&C Offshore Marine and Construction (EUNSUNG19EG01).
《Compliance with ethical guidelines》
Compliance with ethical guidelines
W.J. Lu, B. Li, J.F. Hou, X.W. Xu, H.F. Zou, and L.M. Zhang declare that they have no conflicts of interest or financial conflicts to disclose.


 京公网安备 11010502051620号


