
《1. Introduction》
1. Introduction
Social and economic development directly affects environmental quality, which impacts human health and long-term livelihood [1–3]. Because of the increasing urgency for sustainable development worldwide, a high-level global sustainability panel issued a report proposing that the world adopts a series of sustainable development goals (SDGs) to realize economic development, social inclusion, and environmental sustainability [4].
China has witnessed rapid development and industrialization over the past few decades [5], and it was challenging for China to maintain its high economic growth without degrading environmental quality at the end of the 20th century, given that a variety of environmental pollutants were frequently detected and that some of the pollutants had relatively high concentrations [6–10]. Thus, efforts to ameliorate a variety of environmental risks have intensified in the last 20 years. For instance, enormous attention has been given and actions are being undertaken at both national and local levels to fight against atmospheric pollution in China [11,12]. As part of these efforts, a set of laws and regulations are enforced, playing a vital role in air protection [11,13]. For example, beehive coke ovens (BCOs), which result in enormous emissions of benzo[ ]pyrene (BaP), a typical carcinogenic polycyclic aromatic hydrocarbon (PAH) indicator, were banned in 1996 by the Coal Law and were eliminated in 2011 [14–21]. As a result, the cumulative additional nonoccupational lung cancer cases related to BaP from BCOs were reduced from 9290 (± 4300) in 1982 to 3500 (± 1500) in 2015 [22]. On a large scale, the national average particulate matter with an aerodynamic diameter no greater than 2.5 μm (PM2.5), CO, black carbon, and Hg exposure concentrations declined considerably due to the rapid transition of cooking fuels and the switch to cleaner fuel types [23,24].
Actions have also been taken to improve soil quality in recent decades. Soil environmental security has been regarded as one of the key areas of national environmental security in the first 10– 20 years of the new century [25]. Soil environmental monitoring technology has been gradually standardized [26]. National and local soil surveys and monitoring have been accomplished [27]. The State Council issued the Action Plan for the Prevention and Control of Soil Pollution in 2016 [28], which has attracted much attention. However, the effects of these nationwide measures on the magnitude of important pollutant residuals in topsoil have not been well quantified.
Some of the actions mentioned above for air and soil quality improvement, such as energy structure adjustment, including the transition of cooking fuels and upgrading of coke ovens, could reduce the emissions of PAHs [22], which are ubiquitous in environmental media (e.g., air, water, soil, and sediment) [29–31] and have attracted attention worldwide [32–34]. Due to their potential carcinogenic, teratogenic, and mutagenic effects on humans and animals [31–37], PAHs are considered to be priority pollutants by both the European Community and the US Environmental Protection Agency (US EPA). Soil is an essential sink for PAHs in other environmental media because of the stable chemical structure and high hydrophobicity of PAHs [38]. Therefore, it is speculated that energy restructuring in China may reduce the content of PAHs in soil.
To test this hypothesis, we collected and integrated the monitoring data of PAHs in China’s topsoil in the past 20 years from two databases of the Web of Science (WoS) and China National Knowledge Infrastructure (CNKI) using bibliometric methods to explore the spatial and temporal distribution of PAHs in China’s topsoil. A total of 326 valid studies were referenced, and information from 1704 sampling points was sorted. The spatial distribution and composition of PAHs were analyzed nationwide, and the influence of representative socioeconomic factors, including gross regional products (GRP) per capita and population density, on PAH accumulation was explored. Furthermore, the changes in PAH concentrations in typical regions (Liaoning industrial zone, Beijing–Tianjin–Hebei region cluster, Pearl River Delta city cluster), and geographic districts during past decades were analyzed. In addition, a long-term soil resampling was performed to investigate PAH changes in Beijing in 2008 and 2019. Furthermore, the relative consistency between the change in soil PAH concentrations and sources and the adjustment of the national energy structure was analyzed, which can provide inspiration for the next step of energy structure optimization.
《2. Methods》
2. Methods
《2.1. Data collection for soil PAHs throughout the country during the past 20 years》
2.1. Data collection for soil PAHs throughout the country during the past 20 years
In this study, bibliometrics was used to collect data on soil PAH concentrations throughout the country. The keywords ‘‘China,” ‘‘Soil,” and ‘‘PAH” were searched on the WoS and CNKI, and literature published between 2000 and 2020 was selected. The target information obtained from the literature included sampling time, sampling location, urban–suburban–rural classification of the sampling sites, latitude and longitude of the sampling sites, sampling depth (0–30 cm; for detailed information, see Appendix A), number of sampling sites, soil type, land use type at the sampling sites, total concentration of the 16 priority PAHs controlled by the US EPA and concentration of each monomer. Finally, a total of 326 valid references were obtained, and information from 1704 sampling sites was collected. The details for each sampling site are provided in Dataset S1 in Appendix A.
To ensure the validity and rationality of the data, it was necessary to screen the retrieved literature data. The principles are as follows: First, the data should be representative. For example, to reflect the overall PAH concentration level of a region, serious point source pollution data near industrial areas and traffic routes should be eliminated. Second, the data sources should be reliable and comparable. For example, analytical methods for PAHs should be authoritative or recognized standardized methods [39], and instrumental analyses include ultraviolet or fluorescent highperformance liquid chromatography (HPLC) and gas chromatography mass spectrometry (GC/MS).
In this study, two methods were used to determine the coordinates of sampling sites: ① Geographical coordinates were obtained through the direct acquisition method if the reference material provided the detailed name and geographical coordinates of the sampling site, and ② geographical coordinates were obtained through name inversion [40]. In this case, GPSspg↑ was used to obtain the latitude and longitude of the sampling sites.
《2.2. Soil sampling and PAH analyses in Beijing over recent decades》
2.2. Soil sampling and PAH analyses in Beijing over recent decades
We collected soil samples from Beijing in 2008 and 2019. The sampling sites were far from factories, enterprises, main roads, and other point sources, and they contained three land use types: garden lawns in urban areas, croplands in suburban areas, and croplands and mountain meadows in rural areas. The sites were uniformly distributed in Beijing as much as possible. In 2008, 54 topsoil samples (0–30 cm; for detailed information, see Appendix A) were collected in Beijing, among which 35 samples were collected in rural areas, nine samples were collected in suburban areas and ten samples were collected in urban areas. Global position system (GPS) was used to locate these sampling sites. In 2019, a repeat sampling campaign was conducted for the sampling sites studied in 2008. In addition to the consistency of the coordinates of the same sampling site after ten years, we also ensured that the land use types around the sampling sites did not change. Overall, 108 samples were collected over the last decade.
Soil samples were air-dried at room temperature (approximately 25 °C) and then passed through 2 mm sieves to remove roots and stones. The total organic carbon (TOC) and black carbon (BC) of the soil samples were determined using an elemental analyzer (Vario El, Elementar Analysensysteme GmbH, Germany) after pretreatment using the method described in our previous work [41].
The sample pretreatment procedures of the sixteen US EPA priority PAH compounds (naphthalene (Nap), acenaphthylene (Acy), acenaphthene (Ace), fluorene (Flu), phenanthrene (Phe), anthracene (Ant), fluoranthene (Fla), pyrene (Pyr), benzo[ ]anthracene (BaA), chrysene (Chr), benzo[b]fluoranthene (BbF), benzo[k]fluoranthene (BkF), BaP, indeno[1,2,3-cd]pyrene (Ind), dibenzo[,h]anthracene (DahA), and benzo[g,h,i]perylene (BghiP)) were conducted as described in previous studies [42,43]. Briefly, airdried and homogenized soil samples were weighed, spiked with deuterated PAHs as recovery standards (Nap-d8, Ace-d10, Phed10, Chr-d12, and Pyr-d12), and extracted by accelerated solvent extraction (ASE) with mixed solvent (hexane/dichloromethane, 1:1 (v/v)). After concentration using a rotary evaporator, the extracts were cleaned up using an alumina/silica column and eluted with 1:1 hexane/dichloromethane (v/v). The eluant was further concentrated to a final volume of 500 μL and spiked with m-terphenyl as an internal standard before instrumental analyses.
↑ http://www.gpsspg.com/maps.htm.
Quantification of the 16 priority PAHs was performed using a Varian 3800 gas chromatography–4000 ion trap mass spectrometry (GC/MS) system (Varian, USA) equipped with a Varian FactorFourTM highly inert VF-5 ms capillary column (30.00 m × 0.25 mm in diameter, and 0.25 μm in film thickness). The detailed instrumental determination parameters were described in our previous study [43].
All PAHs were analyzed in selected reaction monitoring mode using the two highest characteristic precursor ion/product ion transition pairs. The correlation coefficients of the internal standard calibration curves (5–2000 μg·L–1 ) of the 16 PAHs were all higher than 0.99. The method recoveries of the 16 PAHs in soil varied from 79.8% to 102.0%. The limits of detection (LODs) for PAH analyses varied from 0.12 to 0.80 ng·g–1 . Procedural blanks were run sequentially with every batch of 20 samples, and PAH concentrations in the blanks were found to be below the detection limits. Total concentrations of 16 PAHs were expressed as  PAHs. Nonnormalized and TOC-normalized PAH concentrations were reported as ng·g–1 dry weight (dw) and μg·g–1 TOC, respectively.
《2.3. Data processing》
2.3. Data processing
The one-sample Kolmogorov–Smirnov (K–S) test was adopted to analyze whether the PAH data conformed to a normal distribution. The Mann–Whitney U test was used to check if there was a significant difference in PAH concentrations among different groups. A significance level of 0.05 was chosen for the test. Nonlinear analysis of the correlation between the PAH and GRP per unit was conducted. In this study, Microsoft Office Excel 2016 was used for data collection and sorting. SPSS 20.0 statistical software (IBM, USA) was employed for data inspection and analysis. The geographic information system software ArcGIS 10.2 (Esri, USA) was utilized to draw the spatial distribution map. Other drawing work adopted the scientific drawing and data analysis software OriginPro 9.1 (OriginLab, USA).
《2.4. PAH source analysis》
2.4. PAH source analysis
PAH diagnostic ratios, including Fla/(Pyr + Fla) and Ant/ (Phe + Ant), are used to identify the source of PAHs in topsoils [44]. According to the PAH isomer ratio principle suggested by Yunker et al. [45], an Ant/(Phe + Ant) ratio < 0.10 is usually taken as an indication of petroleum sources, while a ratio > 0.10 indicates a dominance of combustion sources. The ratio of Fla/(Pyr + Fla) for petroleum sources is below 0.40, and ratios between 0.40 and 0.50 suggest liquid fossil fuel (vehicle and crude oil) combustion, whereas ratios > 0.50 suggest grass, wood, or coal combustion.
《3. Results and discussion》
3. Results and discussion
《3.1. Spatial distribution of PAHs in China’s soil》
3.1. Spatial distribution of PAHs in China’s soil
Total PAH concentrations in soils are depicted in Fig. 1(a) based on the compiled data around the country during 2001–2019. Normal tests suggested that the total PAH concentrations ( PAHs) over different sampling sites followed a log-normal distribution (α = 0.05) (Tables S1 and S2; Figs. S1 and S2 in Appendix A). Such a distribution has been repeatedly documented for micropollutants in various environmental media [46,47]. As a result, the PAH concentrations were denoted by geometric means and geometric standard deviations at the national level. In the surveyed soil between 2001 and 2019, the geometric mean PAHs was 336 (95% confidence interval (CI), 219 to 454) ng·g–1 (dw) (n = 1704), and the arithmetic mean (average) PAHs was 874 (95% CI, 759 to 990) ng·g–1 (dw).
《Fig. 1》
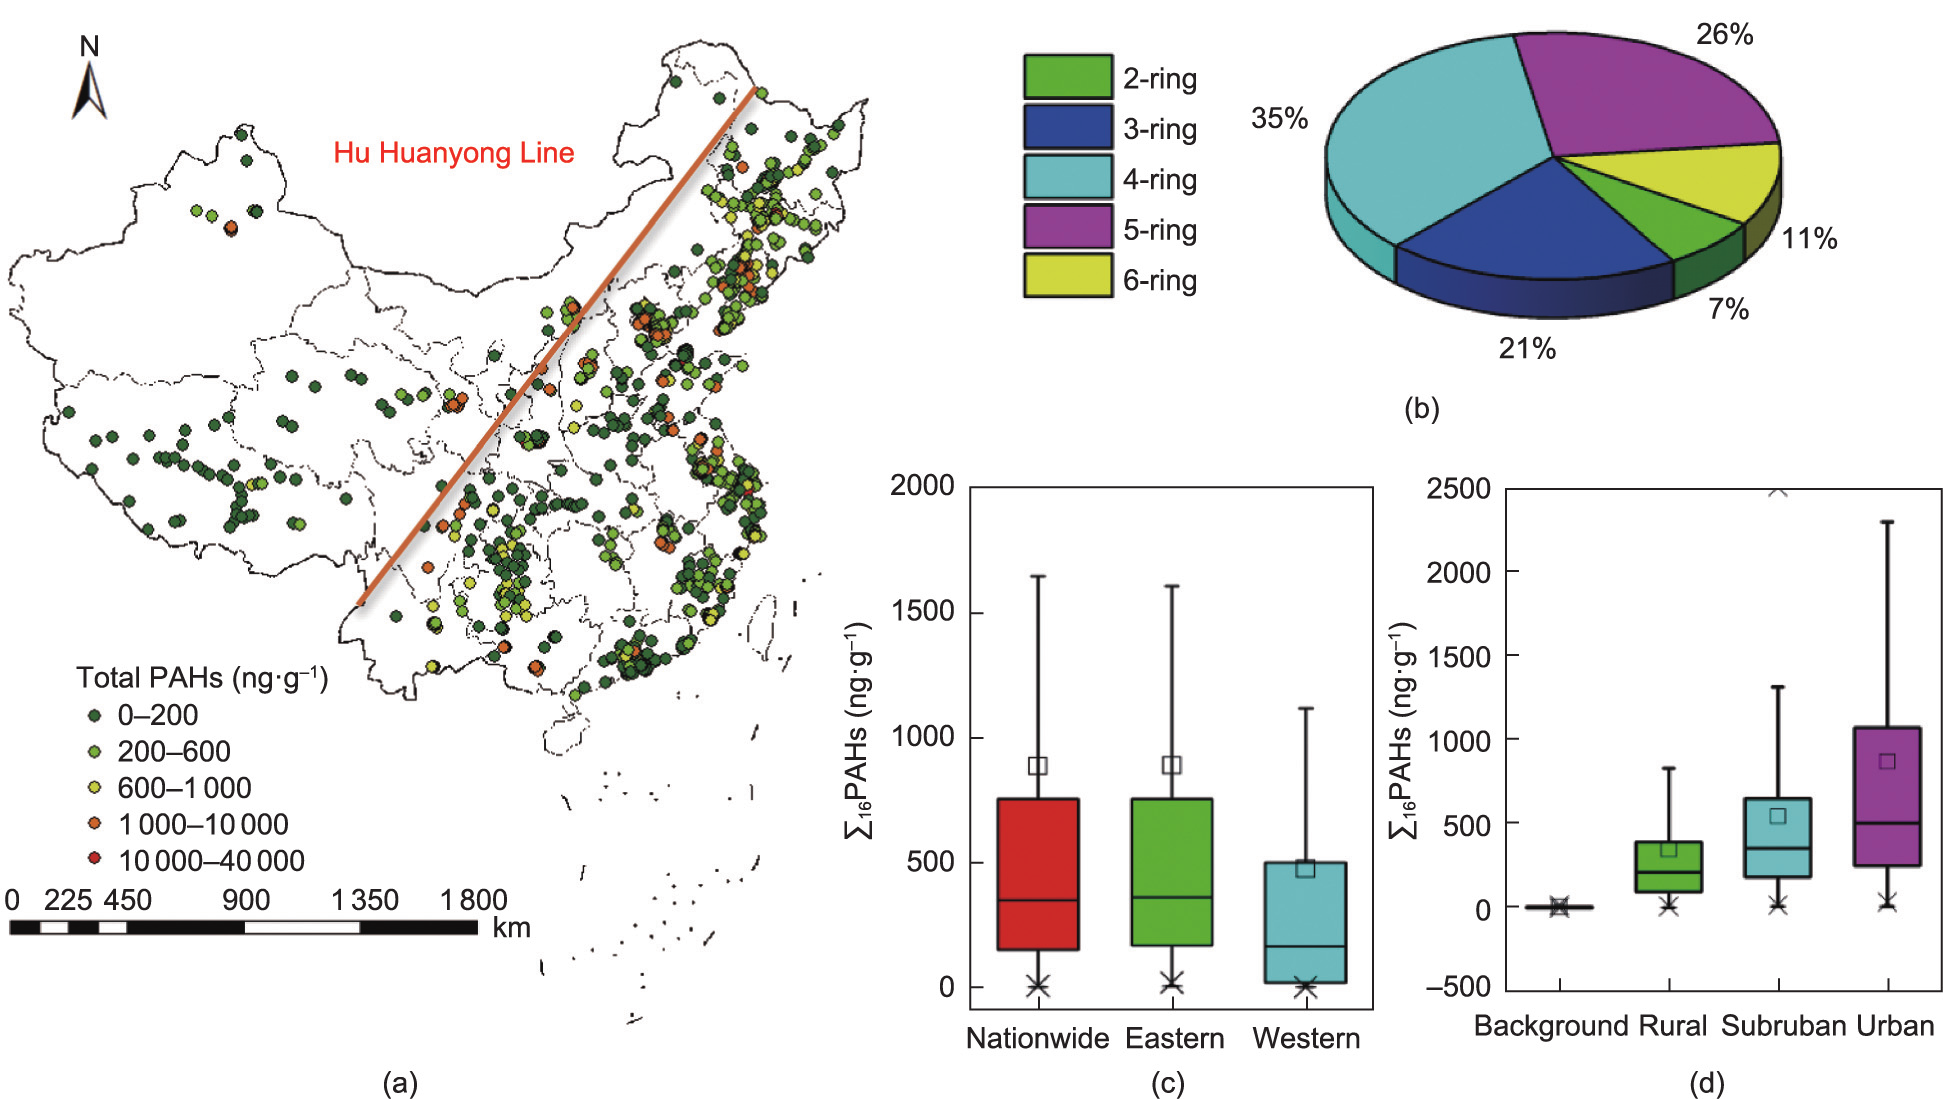
Fig. 1. (a) Spatial distribution of PAHs in China’s soil during 2001–2019, (b) composition of each PAH monomer, (c) comparison of PAH in different geographical regions, and (d) in different types of sampling sites. The Hu Huanyong Line is a geographical boundary roughly dividing China into eastern and western regions in terms of population and development. The details for each sampling site are provided in Dataset S1.
The soil concentrations of the 16 PAH monomers followed the order 4-ring > 5-ring > 3-ring > 6-ring > 2-ring PAHs (Fig. 1(b)), and 2- to 3-ring, 4-ring, and 5- to 6-ring PAHs accounted for 28%, 35%, and 37% of the total PAHs, respectively, which differed from the PAH emission profile in China, in which the corresponding proportions were 70%, 19% and 11%, respectively [48]. Highmolecular-weight (HMW) PAHs constituted a larger proportion of PAHs in the soil PAH composition profile than in the PAH emission profile. Such a difference was caused by the difference in physicochemical properties among PAHs. Being more volatile, low-molecular-weight (LMW) PAHs emitted from the sources tend to exist in the gas phase and easily undergo photochemical degradation in the atmosphere, whereas HMW PAHs are in the particulate phase and are hard to degrade [49]. Given that over 90% of the PAH burden in topsoil is from dry and wet deposition of particulate matter in the atmosphere [50], a larger percentage of highermolecular-weight PAHs is expected in surface soil than the PAH emission profile suggests.
Geographically divided by the Hu Huanyong Line, the eastern region of China is highly developed and densely populated, while the western region is less developed and sparsely populated. The PAH in the eastern soil (average, 889 (95% CI, 767 to 1011) ng·g–1 dw) was higher than that in the western soil (average, 472 ng·g–1 ; 95% CI, 341 to 604 ng·g–1 dw) (Fig. 1(c)). Moreover, significant differences existed among background, rural, suburban, and urban soil for total PAH concentrations (p < 0.01), which descended along the urban–suburban–rural gradient. The highest PAH concentration was 861 (95% CI, 784 to 938) ng·g–1 dw in urban soil, followed by 542 (95% CI, 468 to 616) ng·g–1 dw in suburban soil, 362 (95% CI, 304 to 420) ng·g–1 dw in rural soil, and 5.81 (95% CI, 4.3 to 7.3) ng·g–1 dw in background (Fig. 1(d)).
《Fig. 2》

Fig. 2. Logarithmic correlations between PAHs and (a) fossil energy consumption per unit area, (b) GRP per unit area, (c) industrial output per unit area, and (d) population density. Dots represent the measured data for each province, and the mean values (dots) and standard errors (SEs; error bars) of soil PAH concentration compiled from 2001 to 2019 were applied in the analysis. The red line denotes the fitted results.
To explore the driving factors of the spatial distribution pattern of soil PAHs, the correlations between PAH accumulation and socioeconomic factors were analyzed. As shown in Fig. 2(a) and Fig. S3 in Appendix A, the soil PAH concentration, including total PAHs, HMW PAHs (four to six rings), and LMW PAHs (two to three rings), increased with the fossil energy consumption amount of each province or city, suggesting that fossil energy consumption was the major factor controlling the soil PAH concentration. In addition, the relationships between the PAH concentrations in the surface soil, including total PAHs, HMW PAHs, and LMW PAHs, and GRP per unit area conform to a quadratic function that opens downwards (correlation coefficient r2 = 0.51) (Fig. 2(b) and Fig. S3). The PAH concentration first increased with increasing GRP per unit area, but when the GRP per unit area reached a certain level, the PAH concentration plateaued. Beijing and Tianjin are located near the vertex, while Shanghai is on the right of the parabola vertex. Beijing, Tianjin, and Shanghai are very developed cities. A similar relationship was found between PAH accumulation and industrial output per unit area of each province or city (Fig. 2(c)). Such a quadratic function that opens downwards suggested that the emission of PAHs would not increase and would even decrease with GRP and industrial output when the economy grows to a certain level due to energy structure reforms and energy efficiency improvement.
In addition, the PAH concentration also first increased with population density and then plateaued when population density reached a certain level (Fig. 2(d)). Such a relationship might be because developed cities or provinces always have high population densities and a high GRP and industrial output. The above results also indicate that soil PAH concentrations were greatly influenced by regional anthropogenic activities. Some studies have revealed that the population and gross domestic product are better indicators of regional differences in soil PAH concentrations than TOC effects in relatively large research areas [51–53].
《3.2. Change in soil PAH concentrations across the country over recent decades》
3.2. Change in soil PAH concentrations across the country over recent decades
To investigate the nationwide change in soil PAH concentrations, soil PAH concentrations collected from the literature were compiled and categorized into four periods (2001–2005, 2006– 2010, 2011–2015, and 2016–2019) in terms of the sampling years. Although no statistically significant difference in PAH concentration among samples collected in the four periods was observed, the average PAH in Chinese topsoil demonstrated a decreasing trend from 905 ng·g–1 dw in 2001–2005 to 679 ng·g–1 dw in 2006– 2010, 596 ng·g–1 dw in 2011–2015, and 517 ng·g–1 dw in 2016– 2017 (Fig. 3(a)). In addition, the changes in PAH concentrations in urban, suburban, and rural soils were investigated between 2001–2005 and 2011–2015 (Fig. 3(b)). Although no statistically significant difference was observed between the two periods, the average PAH concentrations decreased considerably from 1372 ng·g–1 dw in the 2001–2005 period to 1131 ng·g–1 dw in the 2011–2015 period for urban soil, from 640 ng·g–1 dw in the 2001–2005 period to 474 ng·g–1 dw in the 2011–2015 period for suburban soil, and from 404 ng·g–1 dw in the 2001–2005 period to 345 ng·g–1 dw in the 2011–2015 period for rural soil.
《Fig. 3》
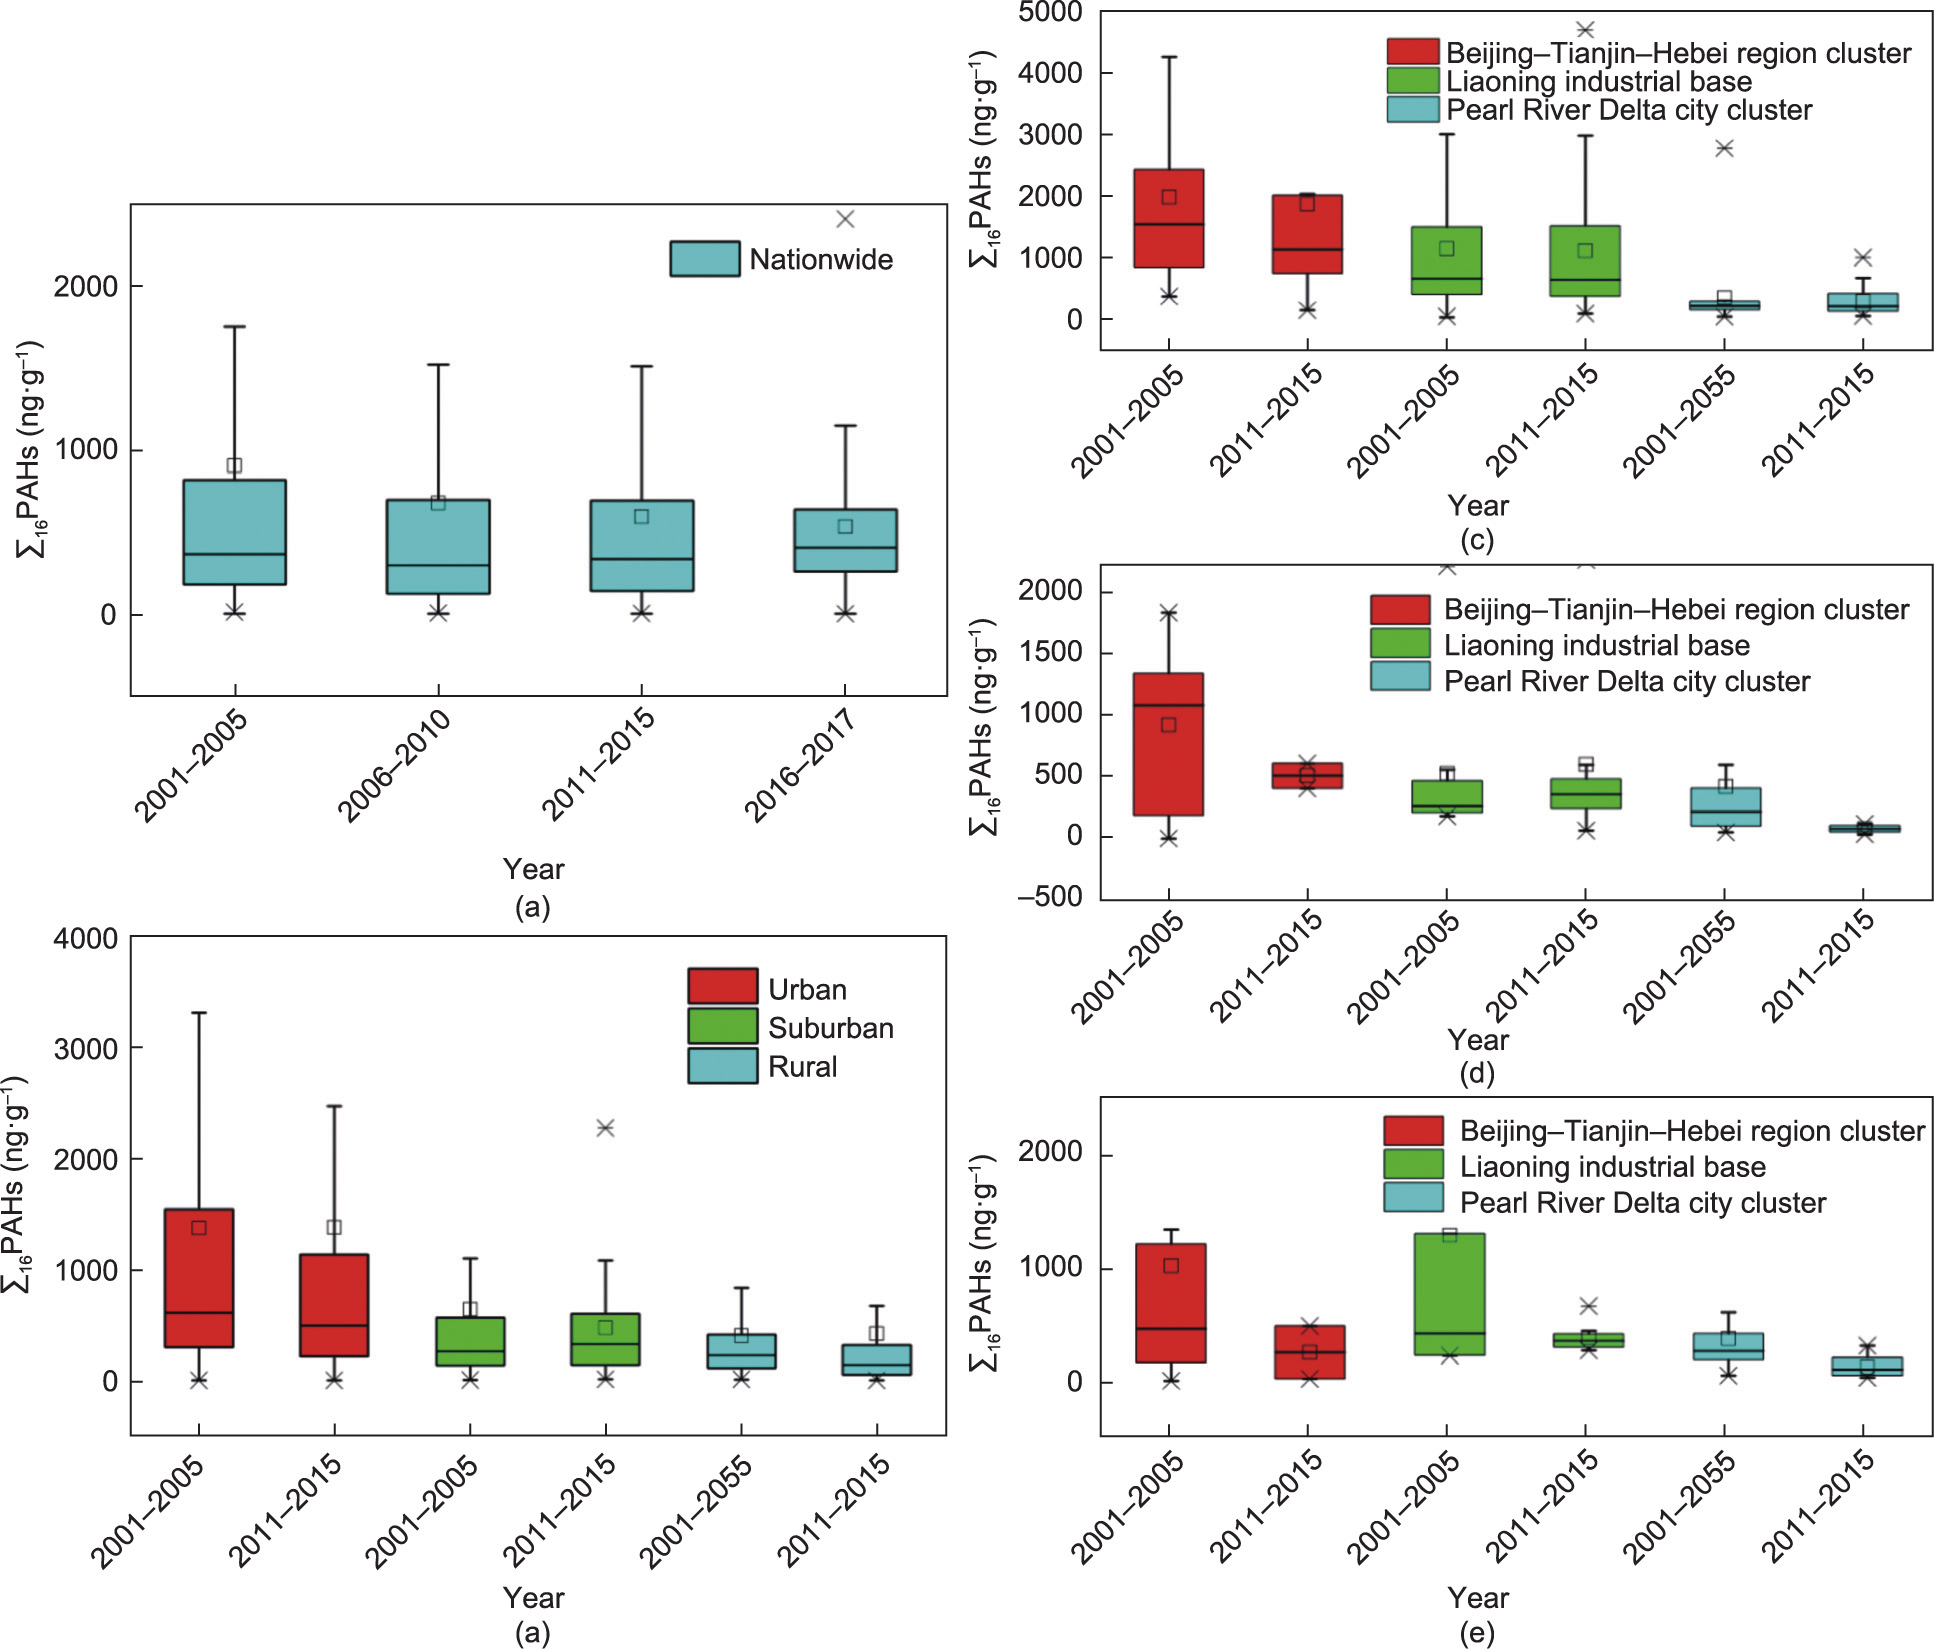
Fig. 3. (a) Temporal variation in soil PAHs across the country, (b) variations in PAHs in urban, suburban, and rural soils of China from the 2001–2005 period to the 2011– 2015 period, and the variation in PAHs in (c) urban, (d) suburban, and (e) rural topsoils in three typical regions of China from the 2001–2005 period to the 2011–2015 period.
Furthermore, three typical regions, including the Beijing– Tianjin–Hebei region cluster, the Liaoning industrial base, and the Pearl River Delta city cluster, were chosen to study the change in PAH concentrations in urban, suburban, and rural topsoil between 2001–2005 and 2011–2015 (Figs. 3(c–e)). The sampling sites from these two time periods realized basic geographical overlap for the urban (Fig. S4 in Appendix A), suburban (Fig. S5 in Appendix A), and rural samples (Fig. S6 in Appendix A) in these three regions. The results showed that the PAH in topsoil of the Beijing–Tianjin–Hebei region cluster dropped moderately from 1527 ng·g–1 (dw) in the 2001–2005 period to 1206 ng·g–1 dw in the 2011–2015 period. The same changes were also observed in the rural areas of the Liaoning industrial base. Note that the PAHs in the suburban, and rural soil of the Pearl River Delta city cluster during the 2001–2005 period were significantly higher than those during the 2011–2015 period (p < 0.01). However, the suburban area of the Liaoning industrial base and urban area of the Pearl River Delta city cluster witnessed a slight rise in the concentrations of PAHs from 2001–2005 to 2011–2015.
《3.3. Causes of the change in soil PAHs across the country during the past decades》
3.3. Causes of the change in soil PAHs across the country during the past decades
The balance of the input and output of PAHs controls the concentration of PAHs in city soils. Atmospheric deposition is the main input pathway for PAHs in soils if there are no point-source pollution neighbors [43]. The output pathways of PAHs in soils include volatilization, degradation, vegetation uptake, and leaching [54,55], which are affected by climate. Therefore, climate change can affect the output of PAHs in soils. A previous study indicated that climate warming (the temperature increased by 2.5 °C) could accelerate the output processes of soil PAHs and might decrease the individual PAH concentration in the soil of the Republic of Korea by 6% on average [56]. The temperature of China only increased by approximately 0.40 °C over the past two decades [57]; therefore, the effect of warming on soil PAHs might be less than 6%. The concentration of PAHs in soils of China declined by approximately 43% from 2001–2005 (905 ng·g–1 dw) to 2016– 2017 (517 ng·g–1 dw) (Fig. 3), indicating that the contribution of climate warming to PAH changes was limited. Therefore, the change in atmospheric deposition of PAHs, produced by fossil energy consumption and affected by the energy structure, was the dominant cause of the change in soil PAHs in China.
Across the country, the Ant/(Ant + Phe) ratio increased from 0.173 (95% CI, 0.147 to 0.199) during 2001–2005 to 0.252 (95% CI, 0.219 to 0.285) during 2011–2015, and the Fla/(Fla + Pyr) ratio slightly increased from 0.556 (95% CI, 0.542 to 0.570) to 0.570 (95% CI, 0.543 to 0.596) over the two periods (Fig. S7 in Appendix A). This result suggests that biomass and coal combustion have always been the main sources of soil PAHs. The emission factors of burning biomass, including straw and fuelwood, are lower than those of coal. For example, the emission factors (EFs) of 16 EPA priority PAHs from coals commonly used in rural China range from 6.25 to 253.00 mg·kg–1 [58]. The total emission factors of straw and firewood burning are 23.6–142.0 mg·kg–1 and 12.7–86.7 mg·kg–1 , respectively [59]. As shown in Fig. S8 in Appendix A, across the country, the proportion of energy consumption from coal and petroleum combustion has dropped significantly, while the percentage of clean energy, such as natural gas and primary electricity, has been increasing in recent decades. Correspondingly, the emission of PAHs greatly decreased. The total PAH emissions in China were estimated to be approximately 106 000 t in 2007 [16], and they decreased to approximately 32 720 t in 2016 [60]. As a consequence, the concentrations of PAHs in the topsoil of China showed a decreasing trend with the decrease in the proportion of energy consumption from coal and petroleum combustion and the increase in the percentage of clean energy during the past decades (Fig. 4). In some regions, such as the suburban area of the Liaoning industrial base and urban area of the Pearl River Delta city cluster mentioned above, the slight increase in soil PAHs might be due to the special variation in the energy structure associated with the regional economy.
《Fig. 4》
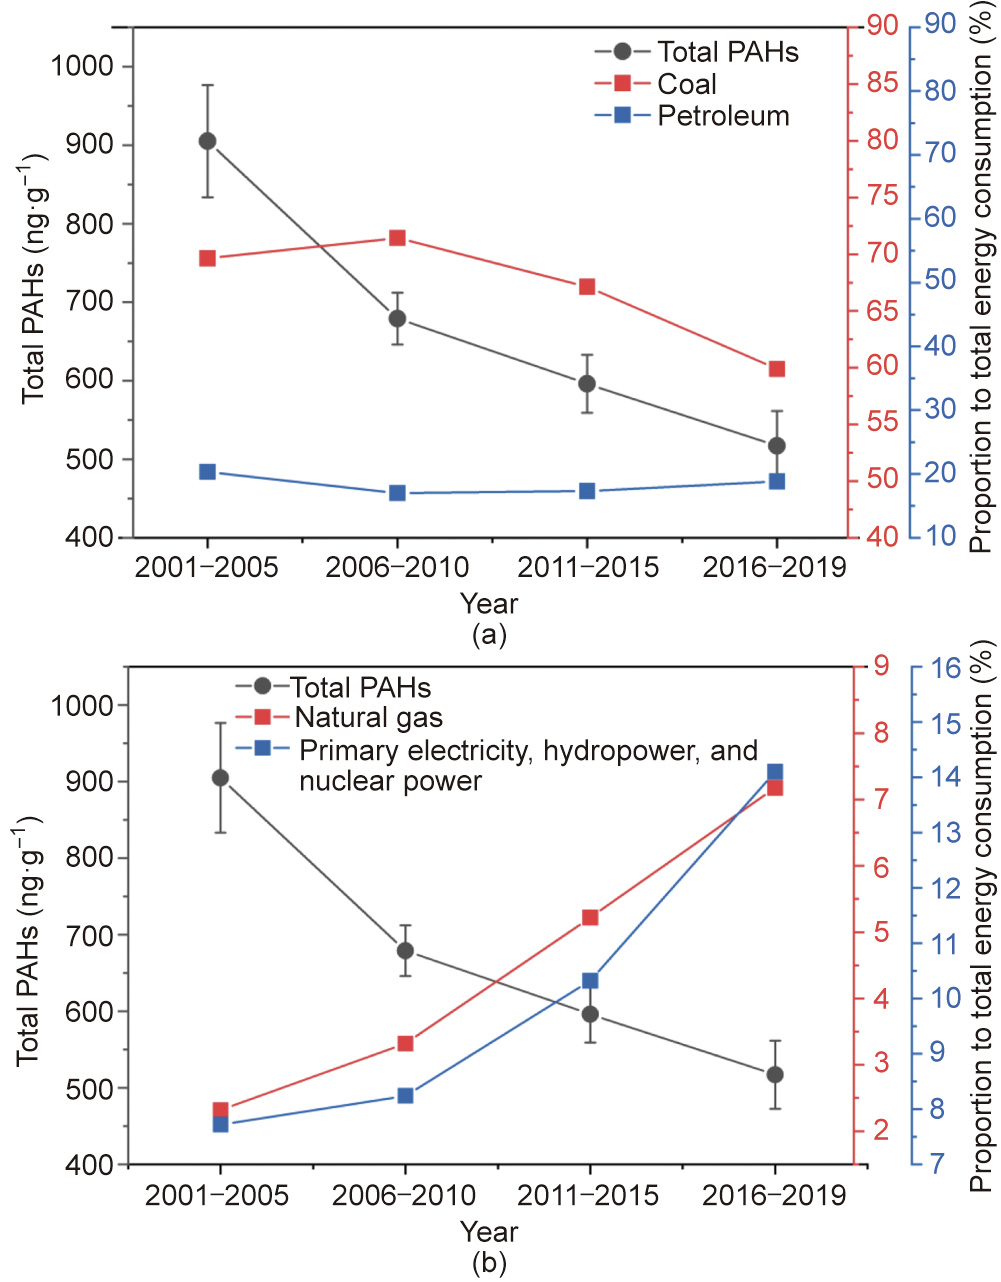
Fig. 4. Correlation between the change in soil PAHs and the change in the energy consumption structure of China between 2000 and 2019. (a) Correlation between total PAHs and the consumption of coal and petroleum; (b) correlation between total PAHs and the consumption of clean energies. The data are from the China Statistical Yearbook.
《3.4. Change in soil PAH concentrations in Beijing over the past decade》
3.4. Change in soil PAH concentrations in Beijing over the past decade
To validate the decreasing trend of soil PAH concentrations in response to the adjustment of the energy structure at a national scale during the past two decades, the change in soil PAH concentrations in Beijing over the past decade was analyzed based on the measured soil PAHs of 54 resampling sites in Beijing in 2008 and 2019 (Fig. 5(a)). The average PAHs in Beijing significantly decreased from 22.7 μg·g–1 TOC (95% CI, 15.1 to 30.3) in 2008 to 10.0 μg·g–1 TOC (95% CI, 6.5 to 13.5) in 2019 (p < 0.01, Fig. 5(b)), with a reduction of approximately 56%. Moreover, the changes in PAH concentrations in urban, suburban, and rural soils from 2008 to 2019 were investigated (Fig. 5(c)). The average PAHs in suburban and rural areas significantly decreased from 23.5 μg·g–1 TOC (95% CI, 9.4 to 37.5) to 10.4 μg·g–1 TOC (95% CI, 2.6 to 18.3) and from 13.1 μg·g–1 TOC (95% CI, 8.0 to 18.1) to 6.1 μg·g–1 TOC (95% CI, 3.5 to 8.7) over the last decade (p < 0.05), respectively, and the average PAHs in urban areas decreased from 55.5 μg·g–1 TOC (95% CI, 24.3 to 86.7) to 23.1 μg·g–1 TOC (95% CI, 8.4 to 37.8) over the last decade.
《Fig. 5》
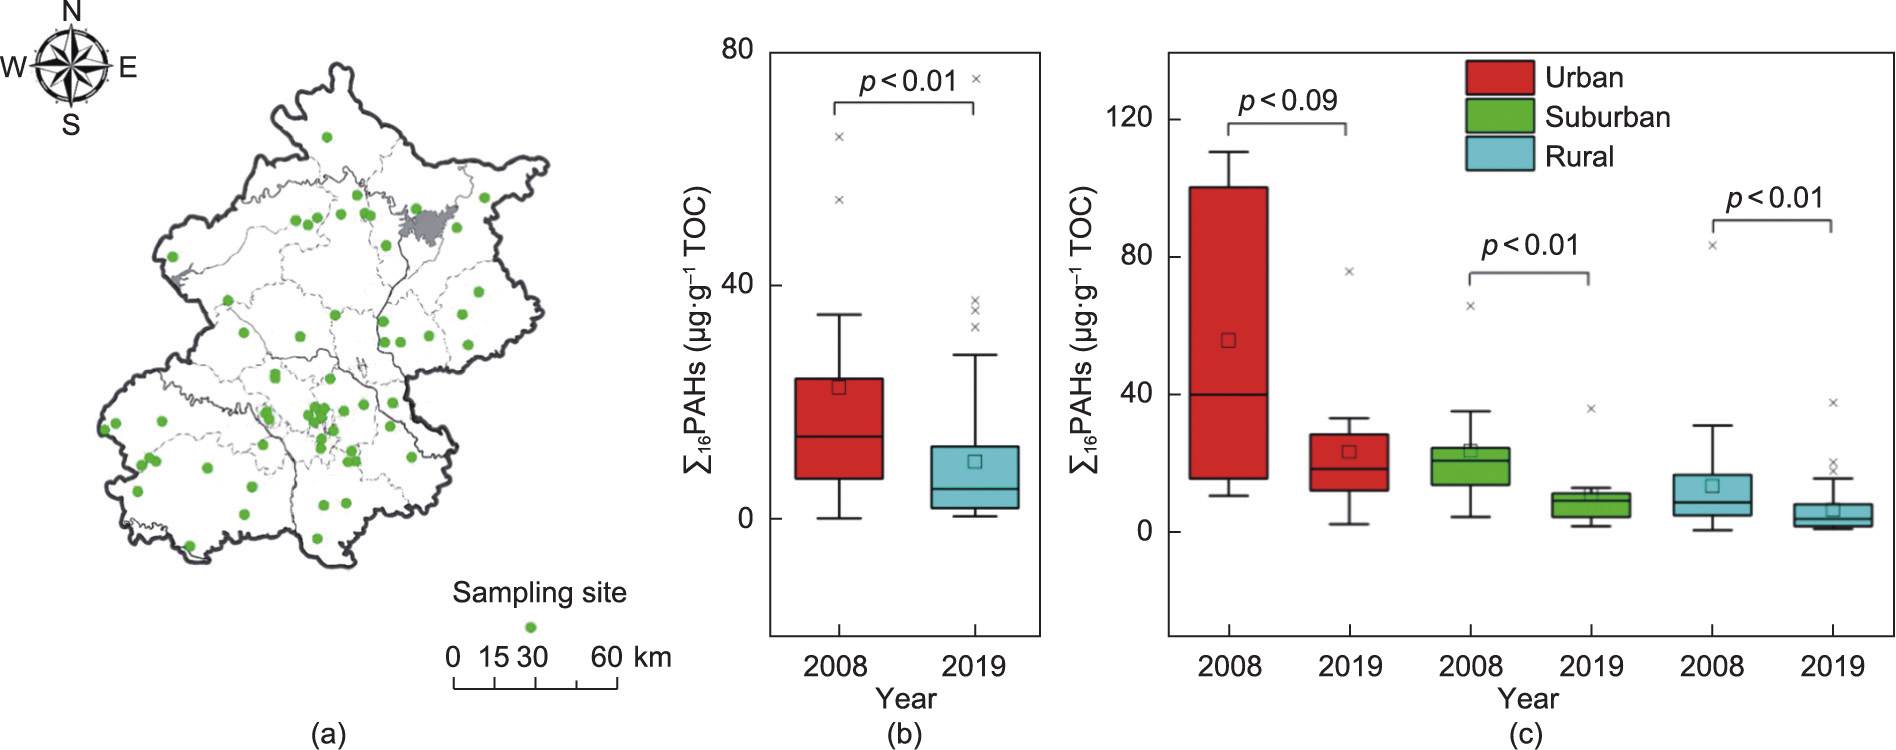
Fig. 5. (a) Geographical distributions of sampling sites in Beijing, (b) variation in TOC-normalized PAH concentration in Beijing, and (c) in three typical regions (urban, suburban, and rural areas) of Beijing in 2008 and 2019.
《3.5. Causes of the change in soil PAHs in Beijing during the past decade》
3.5. Causes of the change in soil PAHs in Beijing during the past decade
To explore the change in soil PAH sources in Beijing, the ratios of specific monomer concentrations in 2008 and 2019 were analyzed. As shown in Fig. S7, the Fla/(Fla + Pyr) ratio decreased from 0.624 (95% CI, 0.586 to 0.662) in 2008 to 0.532 (95% CI, 0.489 to 0.575) in 2019, whereas the Ant/(Ant + Phe) ratio declined from 0.178 (95% CI, 0.134 to 0.223) to 0.144 (95% CI, 0.103 to 0.185) over the same period. This result suggests that the main source of soil PAHs in Beijing is changing from coal/biomass combustion to petroleum combustion.
Fig. S9 in Appendix A shows that the coal consumption in Beijing, the most consumed energy source, decreased sharply from 75 073.8 t in 2008 to 5008.1 t in 2019. During the same period, the consumption of coke fell to zero. This may be the direct and most important reason why the combustion of coal and biomass is no longer the main source of PAHs. Among all oils consumed, crude oil and diesel oil consumption fluctuated and declined after 2010; gasoline and kerosene consumption increased year by year; and fuel oil consumption declined, with its total consumption being the lowest. In general, the consumption of oil has not decreased as much as that of coal. This is one of the reasons why the source of PAHs in Beijing’s soil is shifting from coal/biomass combustion to oil combustion. Finally, the sharp decline in the consumption of coal and some oils and the rising consumption of clean energy, such as electricity and natural gas, have led to a decrease in PAH concentrations in the topsoil of Beijing during the past decade. Black carbon is produced in conjunction with PAHs by the combustion of coal, oils, and so on. The content of black carbon in soil exhibited a similar change trend to that of PAHs in Beijing over the last decade. As shown in Fig. 6, black carbon content in soil declined in urban, suburban, and rural areas over the last decade. This further illustrates that the decline in the combustion source resulted in a decrease in PAHs in the topsoil of Beijing. As Beijing takes the lead in energy structure adjustment under the guidance of policies, the extent of the reduction in soil PAHs in Beijing (56% during the past decade) was higher than that of the Chinese mainland (43% during the past two decades).
《Fig. 6》
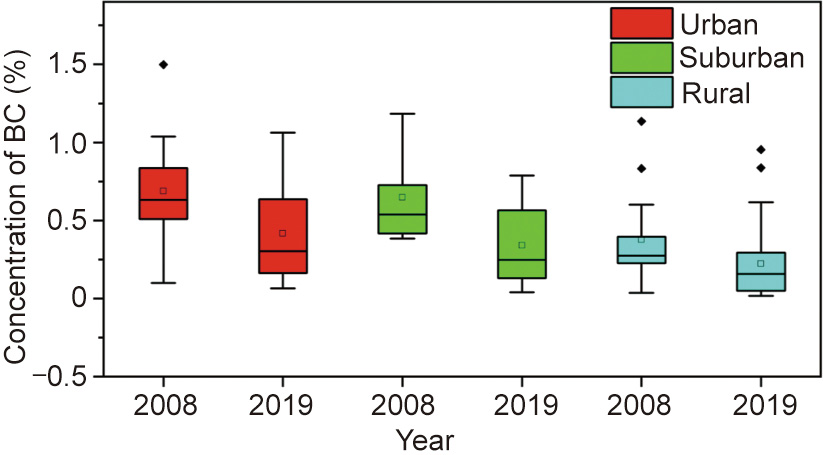
Fig. 6. Variation in black carbon (BC) concentration in urban, suburban and rural topsoils of Beijing in 2008 and 2019.
《3.6. Implications for the improvement in soil environmental quality in China》
3.6. Implications for the improvement in soil environmental quality in China
Since sampling at different times may be significantly influenced by spatial differences in PAH concentrations, sampling and determination technologies may also bring uncertainties. These influences may compensate for the increase or decrease in PAH concentrations in soil. However, we checked the latitude and longitude coordinates and land use types to make the positions of the sampling points as consistent as possible at different sampling times. In addition, the analytical methods of PAHs were comparable for different samples. The results showed that regardless of whether viewed from a large geographic area (e.g., national, urban, suburban, and rural) or from a small typical area (e.g., the Beijing– Tianjin–Hebei region cluster, the Liaoning industrial base, the Pearl River Delta city cluster, and Beijing), the PAH concentrations in the topsoil of China generally decreased over the past decades. Together with the analyses of the change in diagnostic ratios of soil PAHs and composition of energy consumption during past decades, this study demonstrated the response of PAH concentrations in soils to the adjustment of the energy structure in China.
Similar decreasing trends of PAH concentrations have been reported for other environmental media. For example, concentrations of PAHs in Chinese sludges also showed a decreasing trend from 15 700 ng·g–1 dw in 1998–2000 to 3000 ng·g–1 dw in 2011–2012 [61]. Moreover, the PAHs observed in the Yellow Sea and South China Sea sediment cores witnessed a decreasing trend from the late 1980s to 2007 [62]. Based on our own findings and this evidence, it could be conjectured that the emissions of PAHs are declining due to energy structure adjustment in China, leading to the decreasing trend of PAH concentrations in the environment. More research should be carried out to study the effect of energy structure adjustment on environmental quality as well as on carbon emissions. In addition, there are many other pollutants, especially some emerging contaminants, that are not as closely connected with the energy structure as PAHs; further research should be conducted to mitigate these pollutants in the future.
《Acknowledgments》
Acknowledgments
This work was supported by the National Key Research and Development (R&D) Program of China (2017YFA0605000) and the National Natural Science Foundation of China (52039001).
《Compliance with ethics guidelines》
Compliance with ethics guidelines
Xinghui Xia, Yanan Liu, Zhenrui Zhang, Nannan Xi, Jiaao Bao, and Zhifeng Yang declare that they have no conflict of interest or financial conflicts to disclose.
《Appendix A. Supplementary data》
Appendix A. Supplementary data
Supplementary data to this article can be found online at https://doi.org/10.1016/j.eng.2021.11.023.


 京公网安备 11010502051620号


