

《1. Introduction》
1. Introduction
In the past few decades, impressive development has occurred in large-capacity power transmission over long distances, due to technological advances and an increased demand for electric power [1,2]. Overhead transmission lines (OTLs) have always been the major means of power delivery and will continue to be the preferred alternative in the following years [3]. However, the construction of regular transmission towers takes a great deal of steel. Moreover, with the increase of voltage level, towers have grown significantly in dimension. Taking alternating current (AC) 500 kV transmission lines as an example, power transmission corridors of 45–60 m are needed. Even with compact towers, corridors of 28–43 m are necessary, resulting in the large occupation of land resources [4].
To address this issue, cross arms were introduced to power systems in Japan in the 1960s and have now been used in various countries under different voltage levels. In addition to saving land, the use of fixed cross arms eliminates the negative effect of wind [5,6]. With the widespread application of silicone rubber (SR) insulators, composite cross arms are becoming increasingly popular. Compared with steel-based material, polymer-based material is lighter and exhibits better corrosion resistance [7–9]. However, for cross arms used under high voltages such as 500 kV, a single horizontal composite insulator cannot meet the requirement of mechanical strength, considering the weight of the conductor [9– 11]. Therefore, a more complicated structure has been proposed: In addition to horizontal insulators to maintain spacing for insulation, diagonal insulators are added in order to provide tensile strength [12]. This change has now been widely accepted.
The external insulation characteristics of the composite cross arms consist of the pollution flashover characteristics along the insulator surface under a working voltage and the air gap flashover characteristics between the conductor and the tower under an impulse overvoltage. Since the flashover characteristics over long distances cannot be directly extrapolated from the results over short distances, full-scale pollution flashover tests of AC 500 kV composite cross arms have been conducted and the negative exponential relationship between the salt deposit density and flashover voltage has been confirmed [5,13]. The insulation configuration at the power frequency is mainly determined by the pollution flashover characteristics along the surface, while under an overvoltage such as a lightning overvoltage or a switching overvoltage, the air gap between the conductor and the tower is the component most likely to flashover [14–17]. Theoretical and experimental results have described the flashover characteristics of simple electrode systems such as rod-rod and rod-plane electrodes [18,19]. Researchers have also focused on the impulse flashover characteristics of towers without cross arms [20,21]. Nonetheless, the actual air gap of transmission towers cannot be well described by ideal models or previous structures, which made it necessary to conduct overvoltage flashover tests using a full-scale tower with composite cross arms. Unfortunately, the results are still very limited due to the rigorous requirements for testing. As a result, the influence of the introduction of composite cross arms on a tower’s lightning protection still remains uncertain.
A full-scale AC 500 kV model transmission tower with composite cross arms was manufactured for the investigations described in this paper. Lightning overvoltages of different polarities were applied, and the flashover characteristics were measured. The developing process of the streamer–leader discharge was recorded, and the major path of the flashover was identified. The measured flashover results were corrected to standard conditions and clearly confirmed the polarity effect of lightning flashover. The lightningwithstand level of the tower with composite cross arms was derived based on the results. The feasibility of composite cross arms was thus confirmed, and a structural optimization is proposed accordingly.
《2. Experimental setup》
2. Experimental setup
《2.1. Model transmission tower》
2.1. Model transmission tower
A full-scale AC 500 kV asymmetric transmission tower with a total height of 53 m was manufactured, as shown in Fig. 1(a), where R is 3.7 m and L1 and L2 are 6.4 and 6.9 m, respectively. The tower was designed based on a regular OTL with suspension insulators, and its dimensions were validated by simulation [9]. Since the structures of the lower two phases were symmetric, only two sets of composite cross arms on the same side of the tower were installed during the test; these are referred to as the ‘‘upper phase” and ‘‘lower phase” in this paper. Based on previous research, the influence of the omitted phase on the electric field distribution and the parasitic capacitance to the tower (or ground) of the other two phases is negligible [9,12]. Compared with regular towers, transmission corridors of 2–3 m could be saved by introducing composite cross arms. In order to better simulate the actual operating conditions, a four-conductor bundle of at least 10 m was fixed to the cross arms. In addition, grading rings were installed at both ends of the cross arms and shielding rings were installed near the conductors. Moreover, in order to reduce the tower height for the convenience of testing, only the upper component of the tower was kept, while the lower part away from the cross arms was removed. As a result, the actual height of the model tower was reduced to 17 m. Furthermore, considering that the distance between the conductor and the grounding conductor must not be less than 1.5 times the flashover distance according to test standards [22], the model tower was lifted by a jib when the lower phase was being tested, as shown in Fig. 1(b), making sure that the distance between the conductor and the grounding conductor was more than 10 m. It is worth noting that the tests for both the upper and lower phases were performed with the tower lifted to the same height.
《Fig. 1》

Fig. 1. The model transmission tower with two sets of composite cross arms on the same side for the experiment. (a) Schematic diagram; (b) actual image.
Each set of composite cross arms consisted of four insulators, as shown in Fig. 2(a). A pair of regular line composite insulators were applied for diagonal stretching, with a total length of 5032 mm. In addition, a pair of large-diameter insulators with an insulating length of 4689 mm were utilized for horizontal support. The sheath of the horizontal insulator, whose diameter was 320 mm, was made of SR composites with hydrophobic transfer ability. The selection and dimensioning of the insulators were validated by a simulation of the electromagnetic environment and pollution flashover tests [5,9]. However, the trunk of the horizontal insulators was filled with polyurethane (PU) foam for better sealing and weight reduction, instead of the glass-fiber-reinforced plastics used in line insulators. A cross-section of the horizontal insulator and the PU foam material are shown in Figs. 2(b) and (c).
《Fig. 2》

Fig. 2. (a) Structure of a set of cross arms; (b) cross-section of the horizontal insulator filled with PU foam; (c) PU foam material used for internal insulation.
《2.2. Voltage waveform settings》
2.2. Voltage waveform settings
The nominal voltage of the impulse voltage generator, which was used in the impulse overvoltage tests, was 7200 kV, and the actual waveform of the applied positive lightning overvoltage is shown in Fig. 3. According to the waveform measured, the deviations of the time to crest and the half peak value were 29.2% and –17.4%, while the voltage overshoot was 8%, all of which meet the requirements of the International Electrotechnical Commission (IEC) standard [22]. In addition, the internal capacitance of the impulse voltage generator was 18.75 pF, while the external capacitance was around 1400 pF and consisted of the capacitance of the voltage divider and the ground capacitance of the voltage divider, the high-voltage (HV) leads, the equipment, and the voltage equalizer [23,24].
《Fig. 3》

Fig. 3. Waveform of the positive lightning overvoltage generated with a time to crest of 1.50 μs and a half peak value time of 41.91 μs.
《2.3. Photographing the flashover process》
2.3. Photographing the flashover process
The process of lightning flashovers involved typical streamer– leader discharges. An observation system was set up, as shown in Fig. 4. The closing coil was used to trigger the oscilloscope upon sensing the impulse voltage. Once the oscilloscope was triggered, the high-speed camera was immediately triggered to shoot the discharge process. The images recorded were then transmitted to a personal computer (PC).
《Fig. 4》
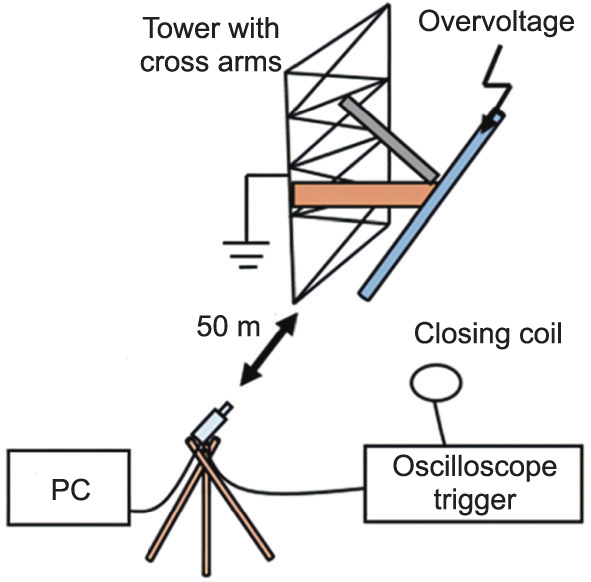
Fig. 4. Schematic figure of the setup for the observation of the lightning flashover process. PC: personal computer.
《3. Results and discussion》
3. Results and discussion
《3.1. Flashover path under lightning overvoltage》
3.1. Flashover path under lightning overvoltage
Based on the tower structure with composite cross arms, there are three possible flashover paths for the breakdown of the air gap. In Fig. 5, d1 represents an air gap flashover between the inner grading ring of the horizontal insulator and the tower, while d2 and d3 represent an air flashover between the grading rings at both ends of the horizontal insulators and diagonal insulators, respectively. The air gap distance of each flashover path is shown in Table 1.
《Table 1》
Table 1 Air gap distances of different flashover paths.

《Fig. 5》

Fig. 5. Possible flashover paths under lightning overvoltage. (a) Flashover between the tower and the inner grading ring of the horizontal insulator, d1; (b) flashover between the grading rings at both ends of the horizontal insulators, d2; (c) flashover between the grading rings at both ends of the diagonal insulators, d3.
In order to better photograph the flashover progress, the tests were all conducted in the evening. The air gap flashovers along the three different paths were photographed and are shown in Fig. 6. For both the upper phase and the lower phase, 20 positive and negative lightning overvoltages were applied until a flashover occurred [22]. The number of flashovers (N) along the various paths were counted and are shown in Table 2. The results clearly indicated that the air gap between the tower and the grading ring on the inner side of the horizontal insulators was the major flashover path (90% for the upper phase and 55% for the lower phase). This finding helped to confirm that lightning flashover would mostly occur over the shortest air gap [25]. Moreover, the distinction between different polarities suggests that this result is more evident under a positive voltage, whereas the results under negative voltage show more diversity.
《Fig. 6》

Fig. 6. Typical air gap flashover images of different flashover paths. (a) d1m (flashover to the middle of the tower); (b) d1s (flashover to the side of the tower); (c) d2; (d) d3.
《Table 2》
Table 2 Number of flashovers over various paths.

neg: negative lightning overvoltages; pos: positive lightning overvoltages.
Further observation showed that there are convex nuts at the middle of tower. In addition, there are bolts at both sides of the tower with lengths of about 10 cm, for the ease of climbing the tower. Therefore, due to these small units, a structure with several tips is formed on the side of the tower. The tips further reduce the insulating distance, making the streamer–leader discharge easier to form. The detail of the flashover caused by the tips is shown in Fig. 7.
《Fig. 7》

Fig. 7. Tip structures on the tower result in a decrease of flashover voltage. (a) Convex nuts at the middle of tower; (b) bolts at both sides of the tower.
《3.2. Flashover process under lightning overvoltage》
3.2. Flashover process under lightning overvoltage
The flashover processes of both the upper phase and lower phase under a negative overvoltage were shot, as shown in Figs. 8 and 9. With the increase of voltage in Fig. 8(b), streamer discharge first occurred from the grading ring of the horizontal insulators near the conductor, toward the grading ring near the tower. Next, as shown in Fig. 8(c), five streamer channels occurred toward different directions. The luminescence of the streamer discharge was faint but uniform, with a width of 1.0–1.3 m according to the picture. Then, dendritic leaders appeared at both ends of some of the streamer channels, as shown in Fig. 8(d). Finally, as shown in Fig. 8(e), the leader extended along the direction of the streamer channels and eventually formed the main discharge with an intense glow. Moreover, considering that the formation of the streamer over the gap (which was around 4 m) took about 10 μs, the developing speed of the negative steamer was on the order of 107 –108 cm·s–1 , based on the images. The process shown in Fig. 9 is similar to that shown in Fig. 8. The three flashover paths mainly differed in terms of the location of the flashover; the processes of the air breakdown were uniform.
《Fig. 8》

Fig. 8. Flashover process of the upper phase (shooting speed: 180 064 fps; shooting interval: 5.55 μs; exposure time: 4.82 μs). (a) –3.05 μs; (b) 2.50 μs; (c) 8.05 μs; (d) 13.61 μs; (e) 19.16 μs.
《Fig. 9》
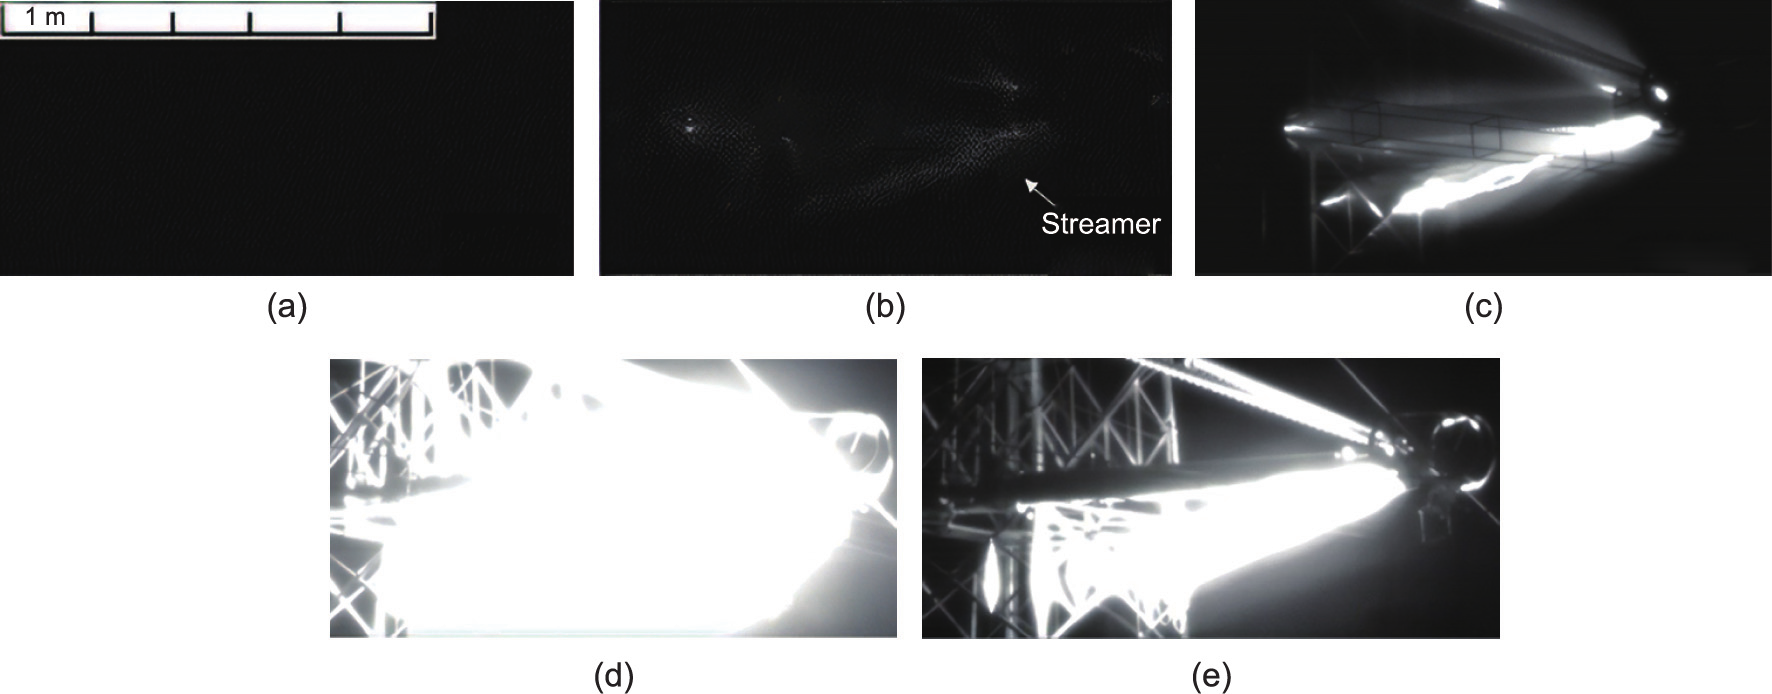
Fig. 9. Flashover process of the lower phase (shooting speed: 130 140 fps; shooting interval: 7.68 μs; exposure time: 7.11μs). (a) –3.75 μs; (b) 3.93 μs; (c) 11.61 μs; (d) 19.29 μs; (e) 25.96 μs.
《3.3. Flashover characteristics under lightning overvoltage》
3.3. Flashover characteristics under lightning overvoltage
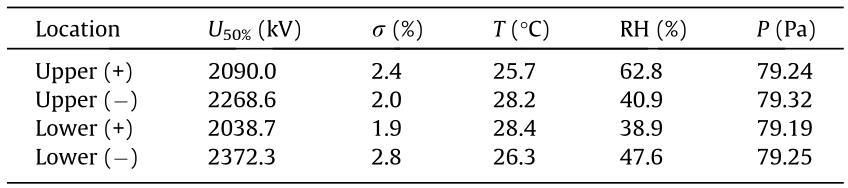
Since a single discharge has great randomness, an up-and-down method was applied to obtain the 50% probability flashover voltage, U50% [26]. Each series of tests involved 20 lightning flashovers. The results of all 80 lightning flashover tests are shown in Fig. 10 and belong to the same set as the results shown in Table 2. Since the condition of the air plays an important role in determining the flashover characteristics, the air temperature T, relative humidity RH, and pressure P were recorded at the beginning, middle, and end of each series of tests. The average value of three measurements was taken as the condition of the air for the series, as shown in Table 3, where σ represents the variance of the flashover voltages.
《Fig. 10》

Fig. 10. Lightning flashover characteristics of composite cross arms conducted by the up-and-down method.
《Table 3》
Table 3 Flashover voltages and the condition of the air for the lightning overvoltage tests.
《3.4. Correction of test results for air humidity》
3.4. Correction of test results for air humidity
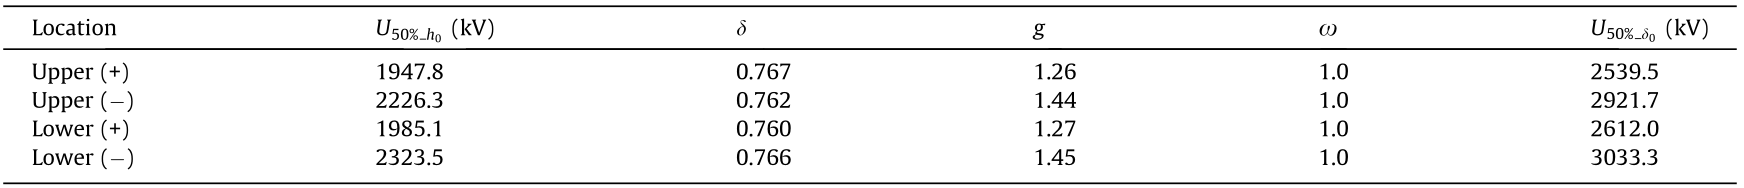
Since the condition of the air significantly influences the flashover process, the test results needed to be corrected to standard air conditions (i.e., temperature T0 = 20 °C, pressure P0 = 101.3 kPa, and absolute humidity h0 = 11 g·m–3) in order to be comparable [28]. In general, the flashover voltage along the surface or over the air gap rises with an increase in air humidity: The higher the humidity, the greater the number of electrons captured by water molecules and the smaller the average free path of electrons. However, once the relative humidity reaches 80% or higher, the discharge becomes destructive and irregular, especially for discharges on the surface. According to Ref. [22], the flashover voltage under standard humidity U50%_h0 based on U50% can be derived as follows:

where h, δ, and ω denote the actual absolute humidity, relative air density, and correction factor for humidity, respectively, while k is an intermediate parameter. Among them,

where P and T represent the air pressure and temperature measured, respectively. Next, another intermediate parameter g is defined as follows:

Then, ω is determined by the value of g according to Table 4 [22]. And L denotes the length of the shortest flashover path. The flashover voltages after being corrected for air humidity are shown in Table 5. The results suggest that humidity plays a minor role in the findings reported here.
《Table 4》
Table 4 Correction factor ω for air humidity and correction factor m for air density determined by g.

《Table 5》
Table 5 Flashover voltages and condition of the air during the lightning overvoltage tests.

《3.5. Correction of test results for air density》
3.5. Correction of test results for air density
Like humidity, air density strongly influences the flashover characteristics. Previous research has shown that the flashover voltage is higher in denser air [5]. The tests in this paper were conducted in Kunming, China, which has an altitude of about 2100 m. The correction factor for altitude is specified in the IEC standard, which is valid in areas that are no more than 2000 m high [22]. Thus far, there has been little test experience and no widely accepted method for higher altitudes. In our case, the current correction formula for 2000 m or lower was extended and used, since the altitude in this research was only slightly beyond the range. Therefore, the flashover voltage under standard air density  was derived as follows:

where m denotes the correction factor for air density, which can be derived according to Table 4. The flashover voltages after being corrected for air density are shown in Table 6. The results suggest that the influence of air density on flashover voltage was much more significant than that of air humidity in this research. As a comparison, when cross arms are not used, the insulating length of a typical suspension composite insulator is about 4152 mm [27]. Previous research indicates that the U50% of an insulator under positive lightning impulse is around 2567 kV (corrected to standard conditions). This suggests that the application of composite cross arms would not reduce the lightning protection performance in terms of flashover voltage.
《Table 6》
Table 6 Flashover voltages after correction for air density.
Based on the results corrected to standard conditions, the flashover voltages of the lower phase were slightly higher than those of the upper phase; this occurred because the air gap distance of the major flashover path 1 for the upper phase was shorter than that for the lower phase. Moreover, the flashover voltages under negative polarity were significantly higher (about 15%) than those under positive polarity. These findings coincide with the test results from other researchers using simplified electrodes or scaling electrodes [28].
It is well known that the breakdown of an air gap requires not only sufficient voltage, but also sufficient time under lightning overvoltage. In this research, breakdown occurred at the wave tail of the lightning impulse, as shown in Fig. 11(a). The relationship between breakdown voltage and flashover time is shown in Fig. 11(b) and confirms that the lower the voltage, the longer the time required for the gap breakdown. The findings also confirm the polarity effect, considering the significant difference shown in the results. Furthermore, since the three flashover paths had different volt-second characteristics, the test results showed an obvious variation, especially for the upper phase under positive voltage.
《Fig. 11》

Fig. 11. (a) Waveform of lightning flashover for the upper phase under positive overvoltage; (b) relationship between breakdown voltage and flashover time.
《3.6. Lightning-withstand ability》
3.6. Lightning-withstand ability
Based on the test results and the structure of the transmission tower, the lightning-withstand level and the probability of lightning trip-out were derived [29]. According to operation experience, most lightning strikes have negative polarity and strikes on the tower are in the majority, which corresponds to applying a positive overvoltage to the conductor [28]. Therefore, the calculation was based on positive flashover voltages of the upper phase. In general, there are two kinds of lightning strike locations: strikes on the tower and strikes on the conductor. For the complete tower with composite cross arms used in this research, the lightningwithstand level for a lightning strike on tower  was calculated as follows [28,30]:
where q denotes the coupling coefficient between the ground wire and the conductor. For the tower used in this research,

where q0 and q1 respectively denote the coupling coefficient of the double ground wire to the outer conductor, and the corona correction factor for the lightning strike on the tower top, whose values are specified in Ref. [24]. In addition, β denotes the current shunting coefficient of the lightning strike on the conductor, which refers to the ratio of current flowing through the tower to the total lightning current, and Rg (Ω) represents the ground resistance of the tower. For the AC 500 kV tower used in this research,

Moreover, Lt (μH) represents the equivalent inductance of the tower, which is related to the tower height. Here,

where  represents the wavefront time, which is usually 2.6 μs when dealing with lightning protection; hs(m) denotes the height of the suspension point of the conductor, which was 38 m and was also the height of the composite cross arms; ht(m) denotes the height of the tower, which was 53 m; and hc(m) and hg(m) respectively denote the average height of the conductor and the ground wire. In this research,
where  denote the sag of the conductor and the ground wire, respectively. Based on the data above,

The lightning-withstand level for a strike on conductor  was derived as follows [24]:

where Z represents the surge impedance of the OTL, which is determined by the conductor material, structure of the bundle, and so forth. In China, the respective OTL surge impedance of AC 220, 330, and 500 kV is typically 400, 303, and 278 Ω [28]. Thus,

In China, the typical probability (R) that the amplitude of lightning current will exceed I can generally be derived as follows [28]:

Then, the probability of the lightning current exceeding the lightning-withstand level for a strike on the tower (R1) and a strike on the conductor (R2) are

If the lightning current exceeds the lightning-withstand level, a flashover will occur over the insulation part of the transmission lines. However, the duration of the lightning overvoltage is only a few tens of microseconds; it is too short for the high-voltage switches to operate. As a result, tripping is only caused when the flashover channel that is broken down by the impulse voltage develops into a stable power frequency arc. The processes involved above have a certain randomness. Thus, in addition to the lightning-withstand level, the probability of lightning trip-out, n, is also used as an integrated index to evaluate the lightning protection performance of transmission lines:

where η denotes the arc over rate, that is, the probability of an air gap developing into a power frequency arc after flashover under impulse voltage. N denotes the estimated total number of lightning strikes on transmission lines of 100 km in one year. For the tower used in this research, which was in a typical plains area of China:

Moreover, assuming that the shielding angle α = 14° , then the probability of a strike on the tower Rt, and the risk of shielding failure Rα, could be derived by the Monte–Carlo method, considering the tower structure:

As a result, the total trip-out rate is the sum of the lightning trip-outs caused by both strikes on the tower and strikes on the conductor:

For comparison, the lightning trip-out rate of a regular AC 500 kV transmission tower is 0:081, which means that, on average, there are 0.081 trip-outs per 100 km of transmission lines annually [28]. These findings suggest that the introduction of composite cross arms would result in the degradation of lightning protection performance. Considering the factors influencing n, a smaller protection angle could be used to enhance the lightning-withstand ability.
《4. Conclusions》
4. Conclusions
In this paper, a full-scale AC 500 kV transmission tower with composite cross arms was manufactured and applied under a lightning overvoltage of different polarities, which simulated the actual operation condition well. The discharge process was recorded, and the flashover characteristics were measured. Based on the results, which were corrected to standard conditions, the lightningwithstand level was calculated. Several conclusions were derived and are presented below.
• It has been confirmed that lightning flashover mostly occurs over the shortest air gap; the tip structures on the tower make the formation of the streamer easier.
• Air humidity and density both influence the lightning flashover characteristics. Air density, which is determined by air temperature and pressure, played the major role in the lightning flashover characteristics recorded here.
• A significant polarity effect was observed for the full-scale transmission tower based on the measured results. Under negative lightning overvoltage, the U50%, is about 15% higher than that under positive voltage.
• The lightning-withstand ability of the transmission tower was degraded after the application of composite cross arms. Thus, a protection angle smaller than 14° is recommended.
《Acknowledgments》
Acknowledgments
The authors would like to acknowledge the National Natural Science Foundation of China (51977116) for the support for this work.
《Compliance with ethics guidelines》
Compliance with ethics guidelines
Qian Wang, Xidong Liang, Yufeng Shen, Shuming Liu, Zhou Zuo, and Yanfeng Gao declare that they have no conflict of interest or financial conflicts to disclose.


 京公网安备 11010502051620号


