
《1. Introduction》
1. Introduction
Currently, protein therapeutics are dominant in both approved drugs and thousands of biopharmaceutical products that are under clinical development worldwide [1]. Several small recombinant proteins, such as cytokines and hormones, are used clinically to treat various diseases. They are rapidly cleared from circulation via renal filtration because of their small molecular size (< 50 kDa) and short terminal half-life (generally in the range of minutes to hours) [2]. One way to maintain an effective therapeutic concentration is to administer drugs at high doses and frequencies. However, this could lead to a high initial peak followed by a fluctuating concentration, which may cause dose- and fluctuation-related complications and issues related to patient compliance and increased cost [3]. Extending the half-life of a drug is a more effective way to maintain therapeutic concentration. In recent years, several technologies, including PEGylation, fatty acid conjugation, albumin fusion, and fusion with the fragment crystallizable (Fc) region of immunoglobulin G (IgG), have been developed for this purpose [4]. These technologies have been applied in a wide range of protein therapeutics and have been demonstrated to improve their therapeutic efficacy owing to their enhanced halflife in circulation. Notably, even with a prolonged drug half-life, achieving long-term therapeutic exposure for chronic disorders requires multiple protein doses, highlighting the requirement for an alternative approach for delivering therapeutics to the site of action for a longer duration in a commercially feasible manner.
Alternatively, gene therapy delivers the genes of therapeutic proteins to target cells and tissues that subsequently produce long-term drug expression, and therefore represents a viable solution to the challenges present in protein-based therapeutics [5,6]. The first gene therapy product based on an adeno-associated virus (AAV) gene delivery approach was approved for the treatment of lipoprotein lipase deficiency [7]. Following this, AAV has become the most widely used vector for gene therapy in clinical trials because of its relatively desirable safety profile and low propensity to integrate into the host genome [8,9]. However, the efficacy of gene expression requires improvement to reduce manufacturing costs and the administration dosage required for a therapeutic response. The benefits of half-life extension have been demonstrated in traditional protein-based therapeutics, however, the impact of drug half-life on the efficacy of gene therapy has received little attention [10–15].
To assess the effects of extending drug half-life in gene therapy, two biologics that have short half-lives were selected as proof-ofconcept (a small-sized bifunctional protein and cytokine), and several biological molecules with distinct circulatory half-lives were engineered. Remarkably, the bispecific antibodies (BsAbs)-soluble monomeric IgG1 fragment crystallizable (sFc) (n118-sFc-mD1.22) and Fc–fibroblast growth factor 21 (FGF21) proteins had considerably higher concentrations when encoded by AAV vectors in vivo. The increased drug concentration could be translated into improved therapeutic efficacy, as the AAV-delivery of half-lifeextended FGF21 resulted in a remarkable reduction in liver injury and blood glucose, and improved glucose tolerance and insulin sensitivity in two different type 2 diabetes mellitus (T2DM) models. These results demonstrate the therapeutic potential of gene therapy with prolonged drug half-life for advancing the treatment of human diseases.
《2. Materials and methods》
2. Materials and methods
《2.1. Animals》
2.1. Animals
All animal procedures were approved by the Fudan University Institutional Animal Care and Use Committee, and the animals were housed in a room with a 12 h light–dark cycle at 22 °C. Male wild-type (WT) BALB/c mice, aged 6–8 weeks, were purchased from Shanghai LingChang Biotechnology Co., Ltd. (China). Sixweek-old male diabetic db/db (C57BLKS/J-Leprdb/Leprdb) and nondiabetic db/m mice (C57BLKS/J-Leprdb/+) were purchased from GemPharmatech Co., Ltd. (China). The db/db and db/m mice were littermates obtained from heterozygous breeding. Recombinant adeno-associated virus serotype 8 (rAAV8) was administered via tail vein injection (i.v.). All mice were randomized based on weight for each experiment.
《2.2. Proteins, plasmids, and cells》
2.2. Proteins, plasmids, and cells
Recombinant Fc  receptor IIIa (Fc
 RIIIa; cluster of differentiation 16a (CD16a)), n118, human immunodeficiency virus type 1 (HIV-1) envelope (Env) glycoprotein (gp140), an engineered one domain soluble CD4 (mD1.22), and sFc were produced by our group as previously described [16]. Briefly, the CD16a-binding single-domain antibody n118 and the engineered single-domain mD1.22 were expressed in the Escherichia coli strain HB2151 and purified using Ni-NTA resin (QIAGEN, Germany). The CD16A and gp140 genes were cloned into the pSecTag 2B vector, transiently expressed in Expi293 cells (Invitrogen, USA), and purified with Ni-NTA resin. The sFc gene was cloned into the pComb3x vector, expressed in HB2151, and purified using protein G resin (Roche Applied Science, Germany). Chinese hamster ovary ZA (CHO-ZA) cells were purchased from Invitrogen. The CHO-ZA-single chain gp160 (gp160sc) cell line was a stable cell line developed in our laboratory expressing HIV-1 gp160 and was cultured in CD OptiCHO medium (Invitrogen) containing 31.5 μg·mL–1 zeocin and 2 mmol·mL–1 glutamine. CD16a-expressing Jurkat T cells were purchased from Promega (USA).
《2.3. Generation and purification of fusion proteins》
2.3. Generation and purification of fusion proteins
The BsAb-sFc gene was obtained by fusing the n118, sFc, and mD1.22 genes through overlapping extension polymerase chain reaction (PCR). The SfiI-digested BsAb-sFc gene was cloned into the linearized pComb3x vector containing the His-tag (HHHHHH) and FLAG-tag (DYKDDDDK). Transformation of sanger-validated vectors into HB2151. A freshly transformed colony was added to 5 mL 2× yeast extract-tryptone (YT) medium with 100 μg·mL–1 ampicillin and 0.2% (w/v) glucose, incubated at 37 °C with vigorous shaking at 250 revolutions per minute (rpm) for 3–4 h, and then transferred into 500 mL Super Broth (SB) medium with 100 μg·mL–1 ampicillin for incubation until the optical culture density reached 0.6 at 600 nm. Next, 1 mmol·mL–1 isopropyl-1-thio-β-d-galactopyranoside was added to induce protein expression, and the culture was further incubated overnight at 30 °C and 250 rpm. Bacteria were collected by centrifugation and proteins were purified using a protein G column according to the manufacturer’s instructions. The n118-mD1.22 gene was generated by fusing the n118 and mD1.22 genes by overlapping extension PCR. The n118-mD1.22 (BsAb) protein was expressed using a protocol identical to that of BsAb-sFc and purified using Ni-NTA resin according to the manufacturer’s instructions. Protein purity was verified by sodium dodecyl sulfate-polyacrylamide gel electrophoresis (SDS-PAGE), and protein concentration was measured spectrophotometrically (NanoVue; GE Healthcare, USA).
《2.4. Binding kinetics measured by bio-layer interferometry (BLI)》
2.4. Binding kinetics measured by bio-layer interferometry (BLI)
The binding kinetics of the proteins (BsAb-sFc, BsAb) with gp140 or CD16a were measured by BLI using an Octet-Red 96 device (Pall ForteBio, USA). CD16a or gp140 proteins at a concentration of 30 μg·mL–1 in sodium acetate buffer were immobilized onto activated Amine Reactive 2nd Generation (AR2G) biosensors and incubated with protein dilutions in phosphate-buffered saline (PBS) containing 0.02% Tween 20. The proteins were diluted threefold from 500 to 0.69 nmol·mL–1 . The experiments were conducted as follows (at 37 °C): ① equilibration step (10 min), ② activation of AR2G by 1-ethyl-3-(3-dimethylaminopropyl) carbodiimide hydrochloride/N-hydroxysuccinimide (5 min), ③ loading step (5 min), ④ quenching with ethanolamine (5 min), ⑤ baseline step (5 min), ⑥ association of proteins (5 min), and ⑦ dissociation of proteins (5 min). The curves were fitted using ForteBio Data Analysis software (Pall ForteBio).
《2.5. Antibody-dependent cell-mediated cytotoxicity (ADCC) reporter assay》
2.5. Antibody-dependent cell-mediated cytotoxicity (ADCC) reporter assay
The ADCC reporter bioassay (Promega) was used to evaluate the ADCC activity of the fusion proteins. Jurkat T-CD16a cells encoding the luciferase reporter gene were used as the effector cells. A CHObased cell line stably expressing HIV-1 Env gp160 (CHO-ZAgp160sc cells) was used as the target cell. Target cells were plated on 96-well plates at a density of 2.5 × 10⁴ cells per well in 25 μL Roswell Park Memorial Institute 1640 (RPMI1640) medium (Gibco, USA). Fusion proteins were serially diluted from an initial concentration of 1 μmol·L–1 . Next, effector cells were added at a density of 2.5 × 10⁵ cells per well in 25 μL RPMI1640 medium. The assay was performed using the Bio-Glo luciferase assay system (Promega) and a luminescence counter (Infinite M200 Pro; TECAN, Switzerland) after overnight incubation at 37 °C. The fusion proteins incubated with Jurkat T-CD16a cells in the absence of target cells or in the presence of gp160-negative CHO-ZA cells served as negative controls.
《2.6. HIV-1 neutralization assay》
2.6. HIV-1 neutralization assay
Pseudoviruses were generated by co-transfecting 293 T cells with pNL4-3.Luc.R-E-backbone and Env clones, and the supernatants were harvested after 48 h, centrifuged at 376 reactive centrifugal force (RCF) for 5 min, and stored at –80 °C. A panel of 19 Env clones was generated, and a standard inoculum of 200 median tissue culture infective dose (TCID50) of each pseudovirus was used to test the potency and breadth of the two neutralizing proteins (BsAb-sFc and BsAb). Pseudovirus neutralization was evaluated using a luciferase-based assay. Each protein was tested in duplicate using a five-fold serial dilution. The 50% inhibitory concentration (IC50) of each protein was calculated to determine anti-HIV-1 potency.
《2.7. Pharmacokinetics》
2.7. Pharmacokinetics
BALB/c mice were housed at the animal facility of Fudan University (China). All animals were intravenously injected with 0.5 mg protein samples on day 0. Plasma samples were collected via orbital bleeding at 6, 8, 10, and 12 h, and 1, 2, 3, 4, and 5 days after injection. Plasma protein concentrations were determined using enzyme-linked immunosorbent assay (ELISA) with standard curves generated using the original protein stocks and protein CD16a.
《2.8. Vector construction》
2.8. Vector construction
Recombinant CD16a, BsAb, gp140, and BsAb-sFc were produced by our group as previously described [17], and amplification was performed using the n118-forward primer: 5' -CCGGAATTCGAGGTGCAGCTGGTGGAGTCT-3' , and mD1.22-reverse primer: 5' - GAAGATCTTTACTTATCGTCGTCATCCTTGTAATCATGGTGATGGTGATGATGGCCCACCACACCAGCTGCAC-3' . The FGF21 gene sequence can be found in Ref. [18]. Both FGF21 and Fc-FGF21 genes were synthesized by GenScript, and amplification was performed using genespecific primers. The primers included FGF21-forward primer: 5' - AGAATTGGATCGGCTAGCGGTACC-3' , and FGF21-reverse primer: 5' -GAGGTTGATTGTCGAAGATC-3' . The PCR reaction was carried out under the following optimized conditions: initial denaturation at 95 °C for 3 min, followed by 30 cycles of denaturation at 95 °C for 30 s, annealing at 56 °C for 60 s (or 90 s), and elongation at 72 °C for 30 s. The amplified products were electrophoresed on 1% agarose and gel-purified. Next, based on the principle of gene homologous recombination, BsAb, BsAb-sFc, FGF21, and Fc-FGF21 were inserted into an AAV8 carrier vector under the control of the chicken beta-actin hybrid (CAG) promoter using a one-step PCR cloning kit (Novoprotein, China).
《2.9. Virus production》
2.9. Virus production
rAAV8 was generated by triple transfection of 293T cells and iodixanol gradient purification. Briefly, 293 T cells were transfected with PEIpro transfection reagent (Polyplus, France) at a 1:1 ratio to DNA. The pHelper, RC8, and AAV8 plasmids were transfected at a 1:1:1 molar ratio. The supernatant and cells were collected 72 h post-transfection and treated using a previously described method [19]. Crudely purified rAAV8 stock was treated with 50 U·mL–1 (U: units) benzonase (30 min, 37 °C) and then subjected to an iodixanol gradient (15%, 25%, 40%, and 60%) in centrifuge tubes (Beckman Coulter, USA). It was then ultracentrifuged at 112 700 RCF for 4 h. The 40% fraction was collected, concentrated, buffer exchanged in ultrafiltration tube (UFC 910096; 100 kDa; Millipore, USA) with 1× PBS, and washed three times with water containing (0.1%, 0.001%, and 0.0001%) pluronic-F68 (BBI Life Science, China). The rAAV8 was stored at –80 °C before use.
《2.10. rAAV8 quantification and ELISA》
2.10. rAAV8 quantification and ELISA
After the AAV8 was purified, viral DNA was extracted using the QIAamp Viral RNA Mini Kit (QIAGEN) and quantified using real-time reverse transcription polymerase chain reaction (RT-qPCR), which was performed using the CFX 96 Real-Time System (BioRad, USA) with TB Green (a Takara Bio DNA intercalator that emits green fluorescence, Japan). Primers were designed against mD1.22 or FGF21 (FGF21-forward primer: 5' -CAGCTGAAGGCCCTGAAGCCT3' ; FGF21-reverse primer: 5' -CCTAAAAGAACAGGCCTCGGG-3' ; mD1.22-forward primer: 5' -ACCTGCACCGCCAGCCAGAAG-3' ; mD1.22-reverse primer: 5' -GCTCCTCCTGCTGTCCACCCT-3' ). Plasma FGF21 and Fc-FGF21 concentrations were measured using an ELISA kit (R&D Systems Inc., USA).
《2.11. Insulin tolerance test (ITT) and glucose tolerance test (GTT)》
2.11. Insulin tolerance test (ITT) and glucose tolerance test (GTT)
After fasting for 6 h, the mice were intraperitoneally injected with insulin (Novolin®R) or glucose. A dose of either 2 IU·kg–1 (IU: international unit) body weight insulin or 1 g·kg–1 body weight glucose was used for db/db mice, while a dose of either 0.4 IU·kg–1 body weight insulin or 1.5 g·kg–1 body weight glucose was used for diet-induced obese (DIO) mice. Blood glucose was measured using a glucometer (Yuwell, China) at 0, 15, 30, 45, 60, 90, and 120 min after injection.
《2.12. Serological analysis》
2.12. Serological analysis
Blood was collected via orbital bleeding, and the serum was separated by centrifugation (2041 RCF for 10 min at 4 °C). All serum indices were determined using an automated biochemical analyzer (ADVIA XPT; Siemens Healthcare Diagnostic, Inc., Germany).
《2.13. Liver biochemical analysis》
2.13. Liver biochemical analysis
Liver total cholesterol (CHOL; TC) and free CHOL (TG) levels in the mice were measured using commercially available detection kits (Promega) after homogenization using a homogenizer (Shanghai Biheng Biotechnology Co., Ltd., China).
《2.14. Quantitative computed tomography scan of the whole body》
2.14. Quantitative computed tomography scan of the whole body
To visualize whole-body adipose tissue accumulation and distribution, including subcutaneous, visceral, and brown fat, wholebody micro-computed tomography (μCT) scans were performed on the mice. A detailed three-dimensional image of the internal structure of the mouse was captured using high-resolution X-ray μCT scanning (Quantum FX; PerkinElmer, USA). The mice were anesthetized with 1.5%–2.5% isoflurane and positioned on the scan platform. The X-ray source was set to a current of 72 μA and voltage of 90 peak kilovolt (kVp). The scan was initiated from a nearby computer terminal and lasted 4 min per mouse. Image segmentation was conducted using a volume-editing tool and volumes were quantified using the region of interest module within the software package (AnalyzeDirect, USA). Adipose content and distribution were calculated using Analyze 12.0 software.
《2.15. Bone analysis》
2.15. Bone analysis
Bone volume and architecture were evaluated using μCT. Mouse tibiae were preserved in PBS and scanned using an eXplore Locus CT scanner (General Electric, USA) at 36 μm resolution. The X-ray source was set to a current of 88 μA and voltage of 90 kVp. The trabeculae were analyzed in 1 mm3 of the proximal tibial epiphysis. Bone parameters were calculated using the MicroView 3D Image Viewer and Analysis Tool (AnalyzeDirect).
《2.16. Statistical analysis》
2.16. Statistical analysis
All data are expressed as mean ± standard error of mean (SEM). Statistical analyses were performed using SPSS17.0 software (SPSS, USA). After the normal distribution test, analysis of variance (ANOVA) was used for comparisons between groups and for multiple comparisons between two differences (least significant difference). Differences were considered statistically significant at p < 0.05.
《3. Results》
3. Results
《3.1. Engineering small-sized bifunctional proteins against HIV-1》
3.1. Engineering small-sized bifunctional proteins against HIV-1
Curing HIV/acquired immunodeficiency syndrome (AIDS) remains a medical challenge because the virus rebounds quickly after cessation of combination antiretroviral therapy (cART). Substantial efforts have been made to develop the cure of HIV-1, including Xencor’s antibody half-life prolongation technology (XtendTM), which extends the antibody half-life using Fc variants (M428L/N434S) [20,21], and bispecific immunoglobulin-like immunoadhesin construction [22]. However, these methods show a relatively delayed viral rebound in short-term therapeutic settings when combined with cART. A single injection of AAVtransferred protein suppresses the rebound of the virus for a long time, resulting in excellent therapeutic effects [23,24]. This observation prompted us to engineer a novel long-lasting protein for improved therapeutic effects by AAV delivery in vivo.
First, we developed a bifunctional protein against HIV-1 (Fig. 1(a)). Briefly, mD1.22 was an engineered single-domain CD4 that had a high affinity to HIV-1 gp140 [25], and n118 was a fully human single-domain antibody derived from our phage-display library (data not shown) that can bind to CD16a on natural killer cells with high affinity. The fusion of mD1.22 and n118 using a flexible 3× GGGGS linker resulted in a bifunctional protein, designated as BsAb. To extend the half-life of this protein (28 kDa) while retaining access to sterically restricted epitopes on HIV-1 [26], a previously engineered sFc was used to generate a bifunctional protein, BsAb-sFc. BsAb-sFc bound to both CD16a and gp140 with high avidity, similar to that of BsAb (Fig. 1(b) and Fig. S1(a) in Appendix A). Remarkably, the pharmacokinetic results showed that the halflife of the sFc-fusion bifunctional protein BsAb-sFc reached up to 21 h, which differed from BsAb which was rapidly removed from the mouse circulation, indicating its potential to provide better protection in vivo (Fig. 1(c)).
In addition, protein aggregation tendencies were evaluated using dynamic light scattering. The results showed that BsAb-sFc displayed higher solubility and thermal stability than that of BsAb (Figs. S1(b) and (c) in Appendix A). SDS-PAGE also showed that BsAb-sFc and BsAb were relatively stable at 4 °C for seven days (Fig. S1(d) in Appendix A). Furthermore, BsAb-sFc was confirmed as a potent mediator of ADCC (Fig. 1(d)). Both BsAb and BsAb-sFc showed broad and potent neutralizing activity against a panel of 19 HIV-1 pseudoviruses with diverse clades and geographic origins (Fig. 1(e) and Fig. S1(e) in Appendix A). Taken together, our findings support BsAb-sFc as a potential anti-HIV-1 therapeutic agent.
《Fig. 1》

Fig. 1. AAV8-mediated gene delivery of anti-HIV-1 bifunctional proteins. (a) Diagram representing the design of two anti-HIV-1 bifunctional proteins, BsAb (n118-mD1.22) and BsAb-sFc (n118-sFc-mD1.22). (b) The binding affinity of BsAb-sFc and BsAb to gp140 was measured by Octet-Red 96 device. (c) Pharmacokinetics of BsAb and BsAb-sFc. (d) ADCC activity was measured by monitoring luciferase activity of Jurkat T-CD16a cells after incubation with BsAb-sFc and BsAb. (e) Neutralization titers of BsAb and BsAbsFc against a panel of 19 HIV-1 pseudovirus subtypes. (f) Diagram representing the AAV8 vector and experimental design used in the animal studies. (g) Representative images of the AAV8-RFP (red) infected Huh7 and HepG2 cells. DAPI staining was also performed (blue). A merged image of the double staining is presented. (h)–(j) Expression of AAV8-BsAb and AAV8-BsAb-sFc in animals administered with (h) 1 × 10¹¹, (i) 1 × 10¹², and (j) 1 × 10¹³ vector genomes (vg) per mouse. Control mice also received the same AAV8-RFP. All values are expressed as mean ± SEM. NK: natural killer; RLU: relative light unit; RFP: red fluorescent protein; DAPI: 4' ´ ,6-diamidino-2-phenylindole; ITR: inverted terminal repeat; KD: dissociation constant; Poly(A): polyadenylic acid; G4S: glycine-serine (GGGGS) linker. *** represents for p < 0.001.
《3.2. Enhanced expression level of half-life extends bifunctional protein by AAV8-delivered gene therapy》
3.2. Enhanced expression level of half-life extends bifunctional protein by AAV8-delivered gene therapy
Next, the potential of BsAb-sFc and BsAb for gene therapy was explored. The AAV8 was modified to encode the sequences of red fluorescent protein (RFP; control), BsAb-sFc, and BsAb, whose expression was under the control of the CAG promoter (Fig. 1(f)) [27]. AAV8-RFP expression in Huh7 and HepG2 liver cancer cell lines was detected, and the results showed that the AAV8-RFP could successfully infect cells and express the RFP protein. Moreover, the positive rate of cells increased with increasing virus dose (Fig. 1(g), Figs. S1(f), (g), and S2(a) in Appendix A). Therefore, different doses of AAV8-BsAb and AAV8-BsAb-sFc were injected intravenously into BALB/c mice. Our results showed that the concentrations of BsAb-sFc and BsAb were positively correlated with the dose of the AAV8 in vivo (Figs. 1(h)–(j)). In addition, the BsAb-sFc concentration was considerably higher than that of BsAb (Figs. 1(h)–(j)). Overall, extending the half-life of AAV8-expressed proteins could increase their blood concentration in vivo. After infection with the AAV8-BsAb-sFc, the anti-BsAb-sFc antibody in mouse sera was detected at different times, and the results showed that the anti-BsAb-sFc antibody concentration did not increase with increasing BsAb-sFc protein concentrations (optical density at 405 nm (OD405) < 0.5) or with time (Fig. S2(b) in Appendix A). Moreover, to test whether long-term expression of AAV8-BsAbsFc and AAV8-BsAb in vivo would lead to organ damage, the viscera of mice in the highest dose group were analyzed using hematoxylin and eosin (H&E) staining. The results showed that no pathological features were detected in the organs of the highdose groups, demonstrating the safety of long-term AAV8 expression in vivo (Fig. S3 in Appendix A).
《3.3. The enhanced expression level of half-life-extended FGF21 by AAV8-delivered gene therapy》
3.3. The enhanced expression level of half-life-extended FGF21 by AAV8-delivered gene therapy
To validate our observations further, another AAV8-based gene therapy was developed. FGF21, a key regulator of glucose and lipid metabolism [28], has emerged as a promising therapeutic agent for T2DM treatment. Owing to the short half-life of native FGF21 (30 min in mice and 2 h in monkeys), considerable efforts have been made to improve its pharmacokinetic properties. For example, a long-acting FGF21 (RG) analog was developed by Hecht et al. [18]. The FGF21 (RG) protein containing 2 points mutations, the leucine to arginine substitution at position 98 (L98R) and the proline to glycine replacement at position 171 (P171G). However, current FGF21 analogs in clinical development still require periodic administration to maintain clinical benefits, which may depend on patient compliance and raise immunological issues.
Here, our results demonstrated that Fc fusion remarkably prolonged the half-life of FGF21 (RG), hereafter referred to as FGF21, in mice (Fig. S4(a) in Appendix A). Next, we used AAV8 vector to deliver RFP (control), FGF21, and Fc-FGF21 genes to BALB/c mice via the tail vein at 1 × 10¹⁰, 1 × 10¹¹, and 1 × 10¹² vector genomes (vg) per mouse, respectively (Fig. 2s(a)). During the 12-week monitoring period, AAV8-Fc-FGF21-treated mice gained remarkably less body weight than that of the AAV8-FGF21-treated mice in the high-dose groups (Figs. 2(b)–(d) and Figs. S4(b)–(d) in Appendix A). To determine whether AAV8 prolonged the half-life of FGF21, the serum concentrations of FGF21 and Fc-FGF21 were measured. The results showed that the serum concentration of Fc-FGF21 in the three-dose groups was significantly higher than that of FGF21 (Figs. 2(e)–(g)). The increase in circulating Fc-FGF21 and FGF21 was primarily due to the transgene expression in the liver (Figs. 2(h)–(j)). Importantly, the message RNA (mRNA) levels of Fc-FGF21 were lower than those of FGF21 in the high- and low-dose groups. These results further demonstrated that extending the half-life of FGF21, which was expressed by AAV8, increased Fc-FGF21 concentration, which suppressed body weight gain in mice. Furthermore, the liver weight of AAV8-FcFGF21 mice was lower than that of AAV8-FGF21 mice at high doses (Figs. 2(k)–(m) and Figs. S4(b)–(d)). Taken together, AAV8-FcFGF21 treatment was more advantageous than AAV8-FGF21 in increasing serum concentrations and reducing body and liver weight.
《Fig. 2》
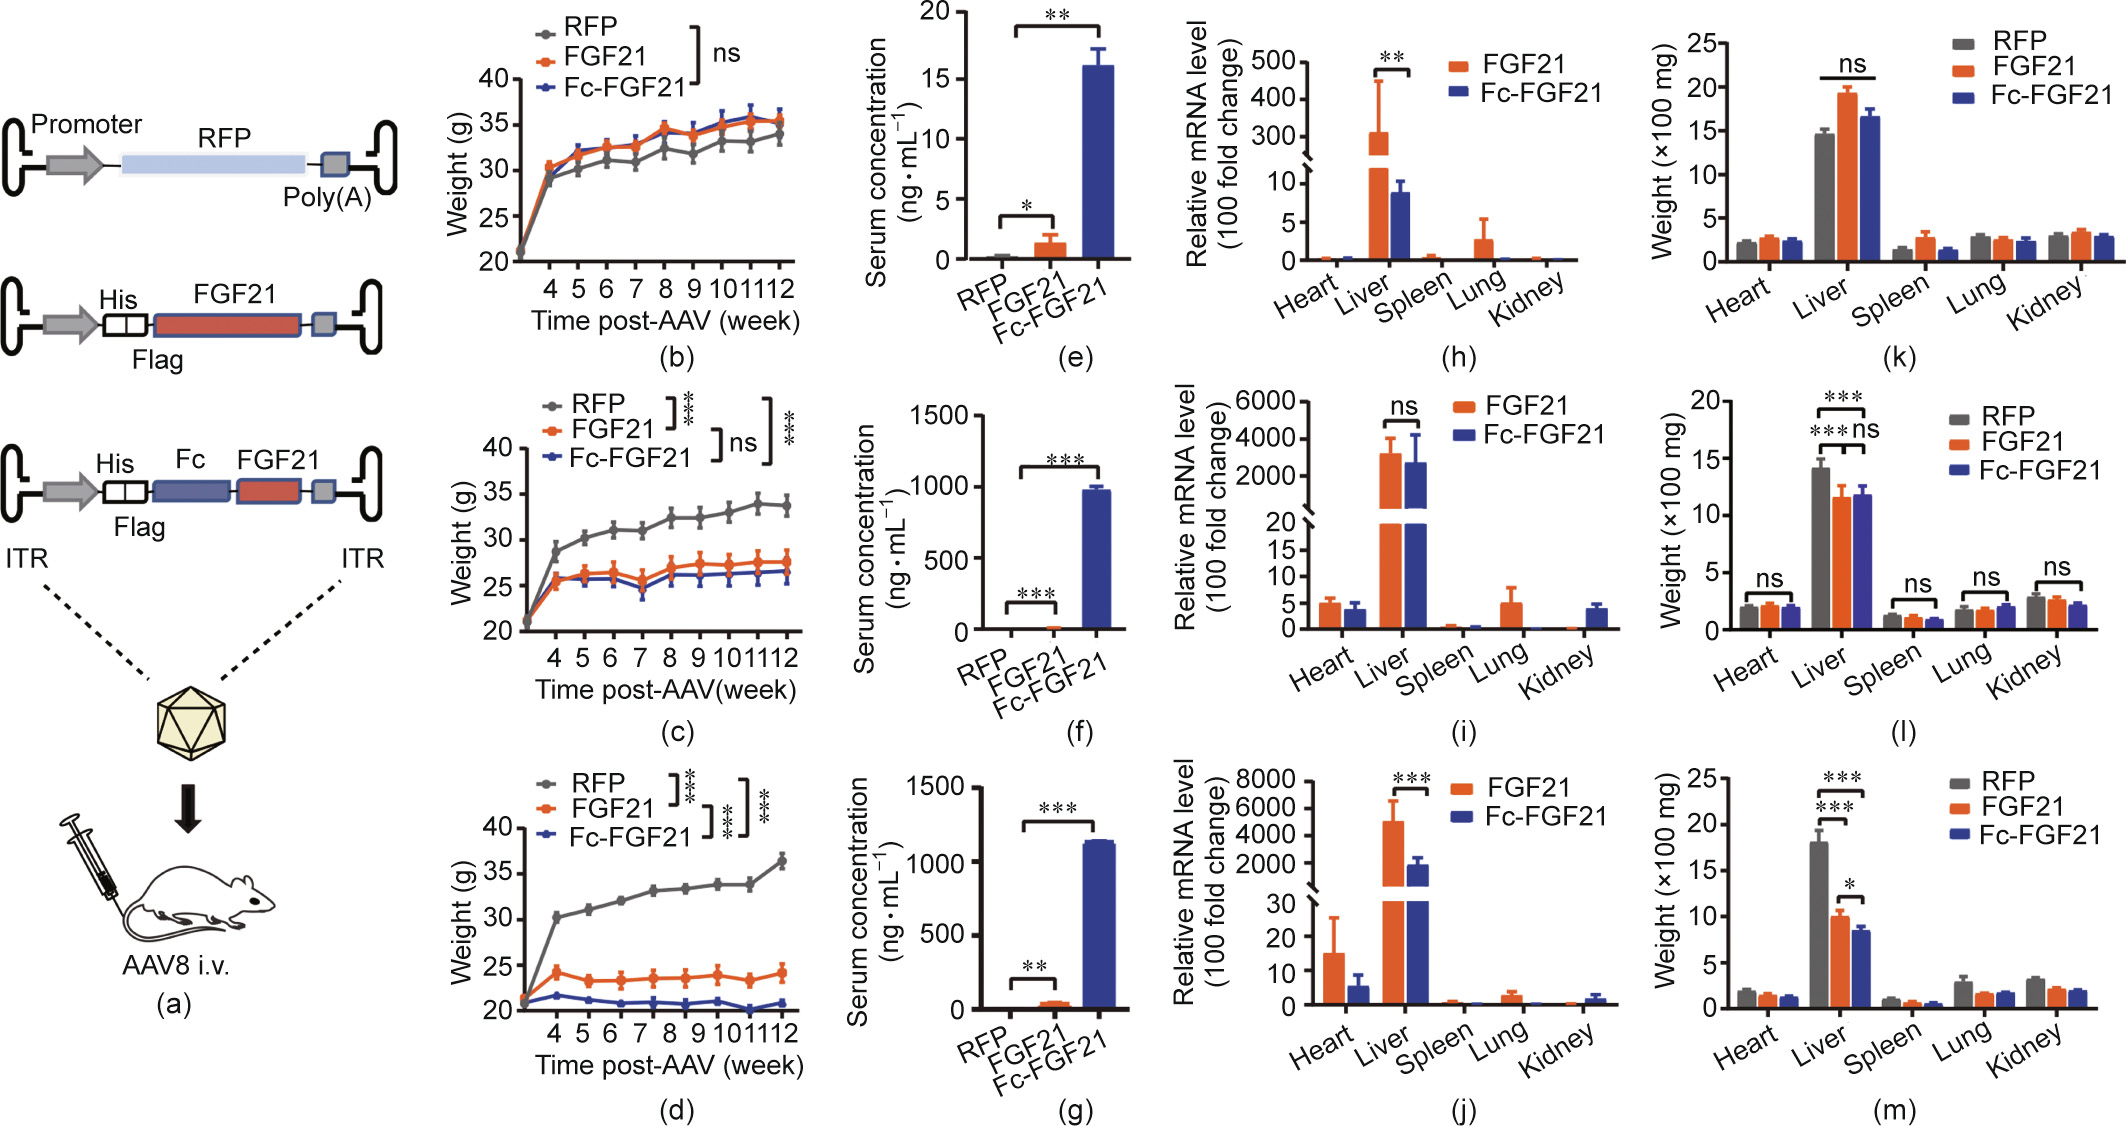
Fig. 2. In vivo expression of AAV8-FGF21 and AAV8-Fc-FGF21. (a) Diagram representing the AAV8 vector and experimental design. (b)–(d) Changes in body weight of the animals after AAV8-FGF21 or AAV8-Fc-FGF21 administration. (e)–(g) Serum levels of FGF21 and Fc-FGF21 at different time points after virus administration. (h)–(j) The message RNA (mRNA) levels in each organ treated with different doses of AAV8-FGF21 or AAV8-Fc-FGF21 detected by RT-qPCR (relative mRNA levels). (k)–(m) Weight of the heart, liver, spleen, lung, and kidney from mice treated with AAV8-FGF21 or AAV8-Fc-FGF21. BALB/c mice administered with (b, e, h, k) 1 × 10¹⁰, (c, f, i, l) 1 × 10¹¹, and (d, g, j, m) 1× 10¹² vg per mouse of AAV8-FGF21 or AAV8-Fc-FGF21. Control mice also received the same AAV8-RFP. All values are expressed as mean ± SEM. ns: no significance. ** represents for p < 0.01; *** represents for p < 0.001.
《3.4. Comparison of the effect of different AAV8-delivered FGF21 doses on bone and fat》
3.4. Comparison of the effect of different AAV8-delivered FGF21 doses on bone and fat
Based on these results, AAV8-Fc-FGF21 mice showed a marked decrease in body weight. Fat was analyzed using μCT images of mice. No remarkable decrease in adipose tissue volume was observed in the low- (Figs. S5(a) and (b) in Appendix A) and middle-dose groups (Figs. S5(c) and (d) in Appendix A). In contrast, in the high-dose groups, the visceral adipose volume in the AAV8- Fc-FGF21 group was lower than that in the AAV8-FGF21 group (Figs. S5(e) and (f) in Appendix A). In conclusion, the decrease in visceral fat volume in the AAV8-Fc-FGF21 group was greater than that in the AAV8-FGF21 group, which further verified that prolonging the half-life of FGF21 could increase its concentration in vivo and reduce the volume of adipose tissue.
To examine the effect of chronic FGF21 or Fc-FGF21 exposure on bones, μCT scanning of the tibiae was performed. Our results showed that almost no differences were documented in the lowdose group (Fig. S6 in Appendix A), while both AAV8-FGF21- and AAV8-Fc-FGF21-treated mice showed a reduction in certain bone parameters such as bone volume (BV) and BV/tissue volume (TV) in the middle-dose group, while mice also showed risk of developing osteoporosis as indicated by decreased trabecular number (Tb.N) and increased trabecular separation (Tb.Sp) (Fig. S7 in Appendix A). In addition, AAV8-Fc-FGF21-treated mice showed more severe bone loss such as lower bone surface (BS) and TV in the high-dose group than AAV8-FGF21-treated mice (Fig. S8 in Appendix A). In summary, chronic FGF21 or Fc-FGF21 exposure leads to loss of bone mass, particularly in the trabecular bone. Bone loss was more severe than that of FGF21 when the Fc-FGF21 concentration was persistently high at 1300 ng·mL–1 (Fig. 2(g) and Fig. S8).
《3.5. Fc-FGF21 overproduction improves blood glucose level, and reverses insulin resistance and glucose tolerance in db/db mice》
3.5. Fc-FGF21 overproduction improves blood glucose level, and reverses insulin resistance and glucose tolerance in db/db mice
To evaluate the therapeutic effect on obesity, a single injection of Fc-FGF21 or FGF21 with 1 × 10¹¹ vg per mouse was administered to the genetic model of leptin-receptor-deficient db/db mice [29], which is a non-insulin-dependent diabetes mellitus model of T2DM that displays characteristics of hyperglycemia, insulin resistance, and obesity [30]. The results showed that mice in the Fc-FGF21 group (designated as KO-FcFGF21) had a 1.8% body weight gain compared with their initial weight, which was less than the 13.8% gain of the FGF21 group (designated as KO-FGF21; Fig. 3(a) and Fig. S9 in Appendix A). Notably, the leptin receptor appears to be required for the effect of FGF21 on body weight, as all treated groups showed little weight loss in db/db mice [31]. The blood glucose levels in the KO-Fc-FGF21 group returned to normal after six weeks of treatment and was better than those in the KO-FGF21 group (Fig. 3(b)). Similarly, the ITT and GTT results showed more effective improvement in insulin sensitivity and glucose tolerance in the KO-Fc-FGF21 group (Figs. 3(c) and (d)). Taken together, these results indicated that Fc-FGF21 had a better therapeutic effect in the db/db mouse model. Furthermore, by comparing the concentrations of FGF21 and Fc-FGF21 in the serum of mice, we found that the Fc-FGF21 concentration was remarkably higher than that of FGF21 (Fig. 3(e)). However, there was no obvious difference in the mRNA levels between the two groups (Fig. 3(f)). Thus, it is reasonable to speculate that the increased Fc-FGF21 concentration was the result of half-life extension. Furthermore, these results showed that Fc-FGF21 improved glucose regulation and insulin sensitivity in db/db mice.
《Fig. 3》
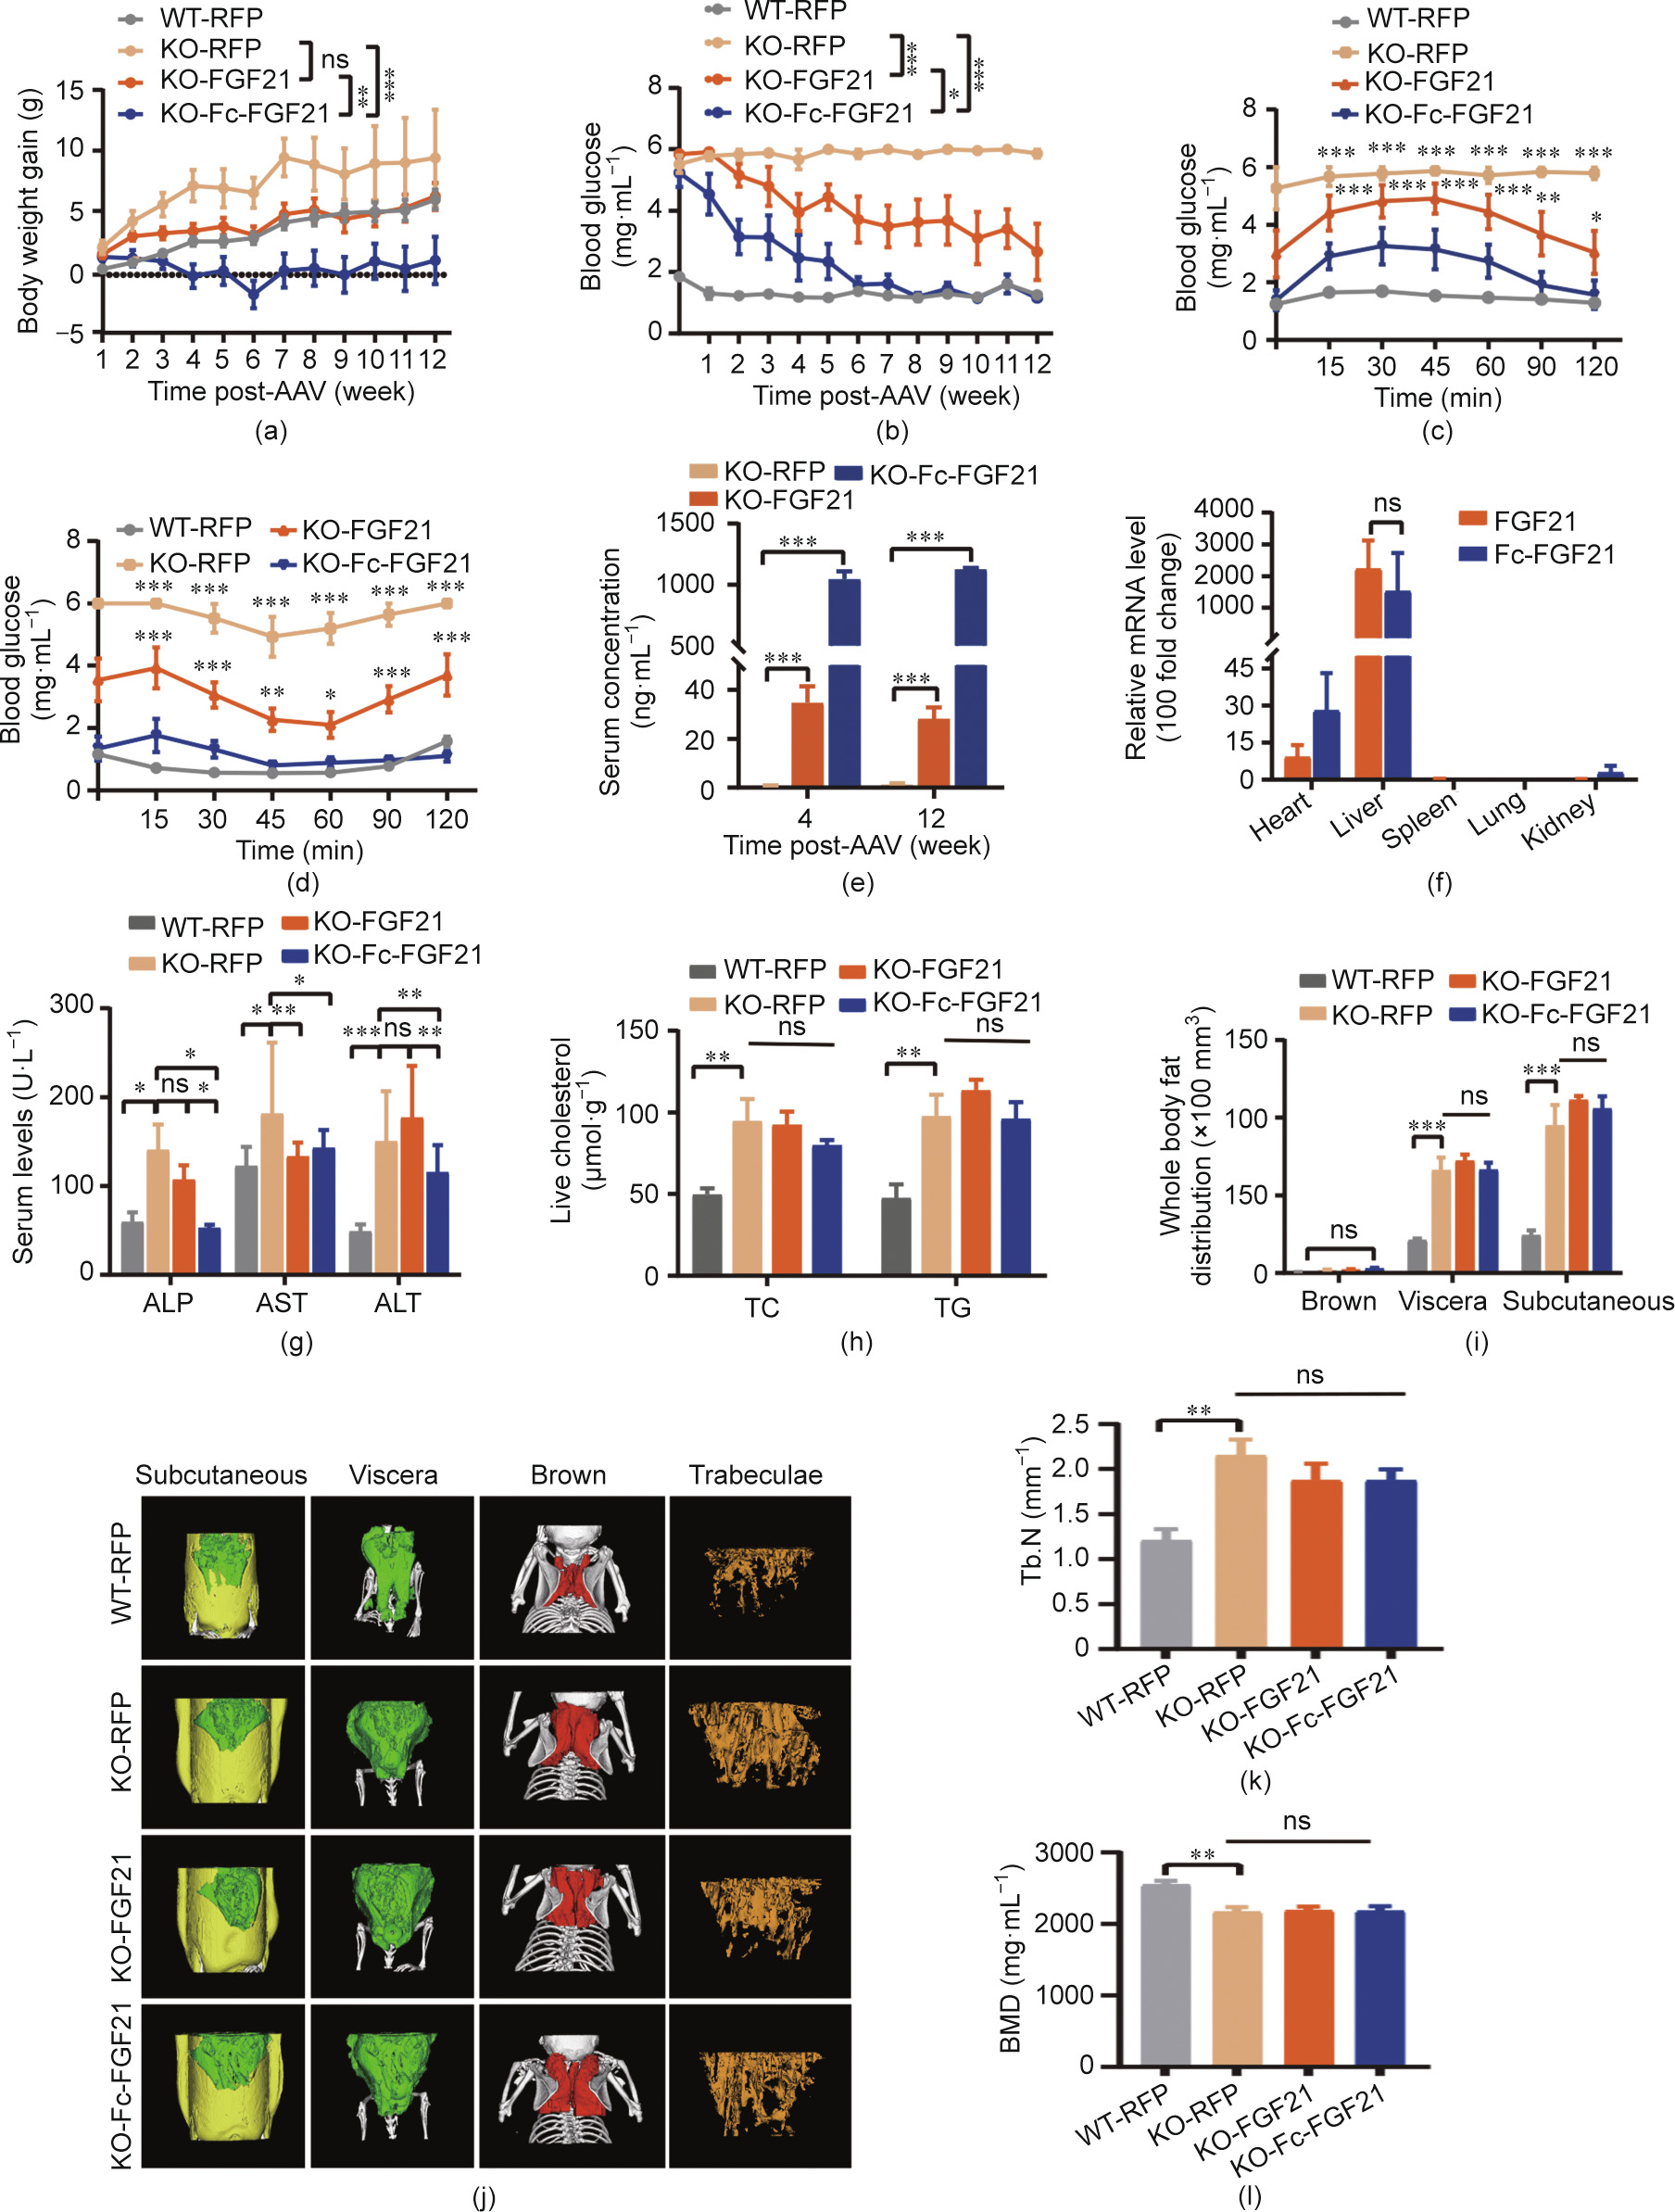
Fig. 3. AAV8-delivered gene therapy in the db/db mouse model. The (a) body weight and (b) blood glucose were measured in different groups of mice at different times. Control groups include wild-type mice (n = 6) and db/db mice (n = 6) injected with the AAV8-RFP, and the other db/db mice in the experimental groups were injected with the AAV8-FGF21 (n = 6) or AAV8-Fc-FGF21 (n = 6). All the mice were treated with 1 × 10¹¹ vg per mouse virus. (c) GTT was studied after an intraperitoneal injection of glucose (1 g·kg–1 body weight). (d) ITT was studied after an intraperitoneal injection of insulin (2 U·kg–1 body weight). (e) Serum levels of FGF21 at different time points after AAV8 vector administration. (f) The mRNA levels in the organs of mice treated with AAV8-FGF21 or AAV8-Fc-FGF21 were measured by RT-qPCR (relative mRNA levels). (g) Serum levels of alkaline phosphatase (ALP), aspartate aminotransferase (AST), and alanine aminotransferase (ALT). (h) Liver TC and TG levels. (i) Quantification of different adipose tissue. (j) μCT 3D images of subcutaneous (yellow), visceral (green), and brown fat (red) distribution and the trabecular bone of the tibial. (k, l) Quantification of (k) trabecular number (Tb.N) and (l) bone mineral density (BMD). All values are expressed as mean ± SEM. * represents for p < 0.05; ** represents for p < 0.01; *** represents for p < 0.001.
《3.6. Fc-FGF21 alleviates dyslipidemia and liver injury in db/db mice》
3.6. Fc-FGF21 alleviates dyslipidemia and liver injury in db/db mice
Obesity is an important cause of lipid abnormalities, therefore, lipid levels in the KO-Fc-FGF21 and KO-FGF21 groups were measured. There was no evident improvement in the majority of lipid indicators, however, Fc-FGF21 remarkably alleviated dyslipidemia by reducing the concentration of triglycerides (TRIG) and lowdensity lipoprotein CHOL (LDL; Fig. S10 in Appendix A). In addition, liver function was evaluated using serum markers, which showed that except for aspartate aminotransferase (AST), the serum levels of alanine aminotransferase (ALT) and alkaline phosphatase (ALP) were lower in the KO-Fc-FGF21 group, indicating that KO-FcFGF21 could improve liver function (Fig. 3(g)). Liver TC and TG levels were not significantly decreased in the KO-Fc-FGF21 group (Fig. 3(h)), however, liver weight was lower than that in the KOFGF21 group (Figs. S11(a) and (b) in Appendix A). Histological analysis by H&E also indicated a better therapeutic effect of KO-FcFGF21 in reducing hepatic lipid accumulation (Fig. S11(c) in Appendix A). In conclusion, Fc-FGF21 had better therapeutic effects than FGF21 in alleviating dyslipidemia, decreasing serum LDL and TRIG concentrations, increasing high-density lipoprotein CHOL (HDL), and reducing lipid accumulation in the liver.
《3.7. Fc-FGF21 treatment enhances the energy expenditure in db/db mice》
3.7. Fc-FGF21 treatment enhances the energy expenditure in db/db mice
FGF21 increases energy expenditure and reduces body weight [32]. During feeding of db/db mice, the symptoms of polydipsia and polyuria in the KO-Fc-FGF21 group improved. Although there was no reduction in body weight in the KO-Fc-FGF21 group, the body weight gain was inhibited. We hypothesized that the weight gain reduction in mice was due to inhibited fat synthesis and enhanced carbohydrate metabolism by Fc-FGF21. Therefore, the metabolic indices of each group were examined using a metabolic cage experiment. The results showed that significant decreases in both O2 consumption and CO2 production were observed in KOFGF21- and KO-Fc-FGF21-treated mice and approximated the level of normal mice (Figs. S12(a) and (b) in Appendix A). Notably, the respiratory exchange ratio (RER) also found to shift from the dysregulated caused by obesity, toward normal levels in the KO-FcFGF21 group, and the KO-Fc-FGF21-treated mice did not display an increase in heat production and movement distance, strongly suggesting that the observed suppression of weight gain was due to metabolic changes (Figs. S12(c), (d), and (e) in Appendix A). These results indicated that the improvement in energy metabolism by Fc-FGF21 in db/db mice was predominantly through increasing carbohydrate metabolism and inhibiting continued fat synthesis, which was more effective than that of FGF21.
《3.8. Fc-FGF21 treatment does not reduce the fat volume in db/db mice nor lead to bone loss, but alleviates inflammation in white adipose tissue (WAT)》
3.8. Fc-FGF21 treatment does not reduce the fat volume in db/db mice nor lead to bone loss, but alleviates inflammation in white adipose tissue (WAT)
According to the results, high Fc-FGF21 and FGF21 concentrations promoted weight loss and fat degradation in the WT mice. However, there was minimal weight loss in the db/db mice. Thus, we examined fat volume using μCT scanning. Quantification of fat showed that neither FGF21 nor Fc-FGF21 effectively reduced the volume of subcutaneous fat (yellow), visceral fat (green), and brown fat (red; Figs. 3(i) and (j)). In addition, H&E staining demonstrated no reduction in WAT volume and no improvement in lipid lipolysis of brown adipose tissue (BAT; Figs. S13(a) and (b) in Appendix A). Since obesity can cause inflammation in WAT, macrophages were labeled with F4/80, and macrophage infiltration was analyzed by immunostaining. The results showed that the number of infiltrating macrophages in the WAT of the KO-Fc-FGF21 group was less than that of the KO-FGF21 group, suggesting that inflammation in WAT was significantly repressed in the KO-Fc-FGF21 group (Figs. S13(c) and (d) in Appendix A).
The results revealed that high concentrations of Fc-FGF21 and FGF21 induced bone loss in WT mice, and the mouse tibiae were analyzed using μCT scanning. Tb.N was significantly higher (Fig. 3(k)), Tb.Sp was lower, and trabecular thickness (Tb.Th) showed an increasing trend in all db/db mice compared to WT control group mice (Figs. S14(a) and (b) in Appendix A). Moreover, the parameters for assessing bone mass, including bone mineral density (BMD), BS/BV were reduced, while the other parameters including BS, BV, BS/TV, and BV/TV were also remarkably increased (Fig. 3(l) and Figs. S14(c)–(h) in Appendix A). In addition, there were no apparent changes of bone parameters in both KOFGF21-and KO-Fc-FGF21-treated mice compared to KO-RFP control group mice. We speculate that the bigger size of db/db mice may have led to an increase in bone volume as well, which caused an increase in bone parameters. The above results indicated that, in the db/db mouse model, neither Fc-FGF21 nor FGF21 reduced fat volume in mice, nor caused side effects, such as bone trabeculae and bone mass reduction.
《3.9. Fc-FGF21 reduces body weight and improves insulin sensitivity and glucose tolerance in the DIO mouse model》
3.9. Fc-FGF21 reduces body weight and improves insulin sensitivity and glucose tolerance in the DIO mouse model
The above results suggest that, although a high concentration of Fc-FGF21 was achieved, the therapeutic effect was insufficient in the db/db mouse model. It is well known that mice fed a high-fat diet (HFD) for a long time develop T2DM with increased body weight and WAT and insulin resistance [33]. Hence, the therapeutic effects of AAV8-delivered FGF21 or Fc-FGF21 were explored in a DIO mouse model. Using the same administration method as described for the db/db mice, the animals treated with Fc-FGF21 (designated as HFD-Fc-FGF21) had a 45.9% reduction in body weight, which was higher than the 27.1% lost in the FGF21- treated group (designated as HFD-FGF21; Fig. 4(a) and Fig. S15 in Appendix A). In addition, insulin sensitivity and catabolic ability of glucose were also better in the HFD-Fc-FGF21 group than in the HFD-FGF21 group (Figs. 4(b)–(d)). In conclusion, the prolonged half-life of FGF21 increased the serum concentration of Fc-FGF21, which contributed to a dramatic reduction in body weight, improved insulin resistance, and enhanced glucose metabolism in the DIO mouse model.
《Fig. 4》
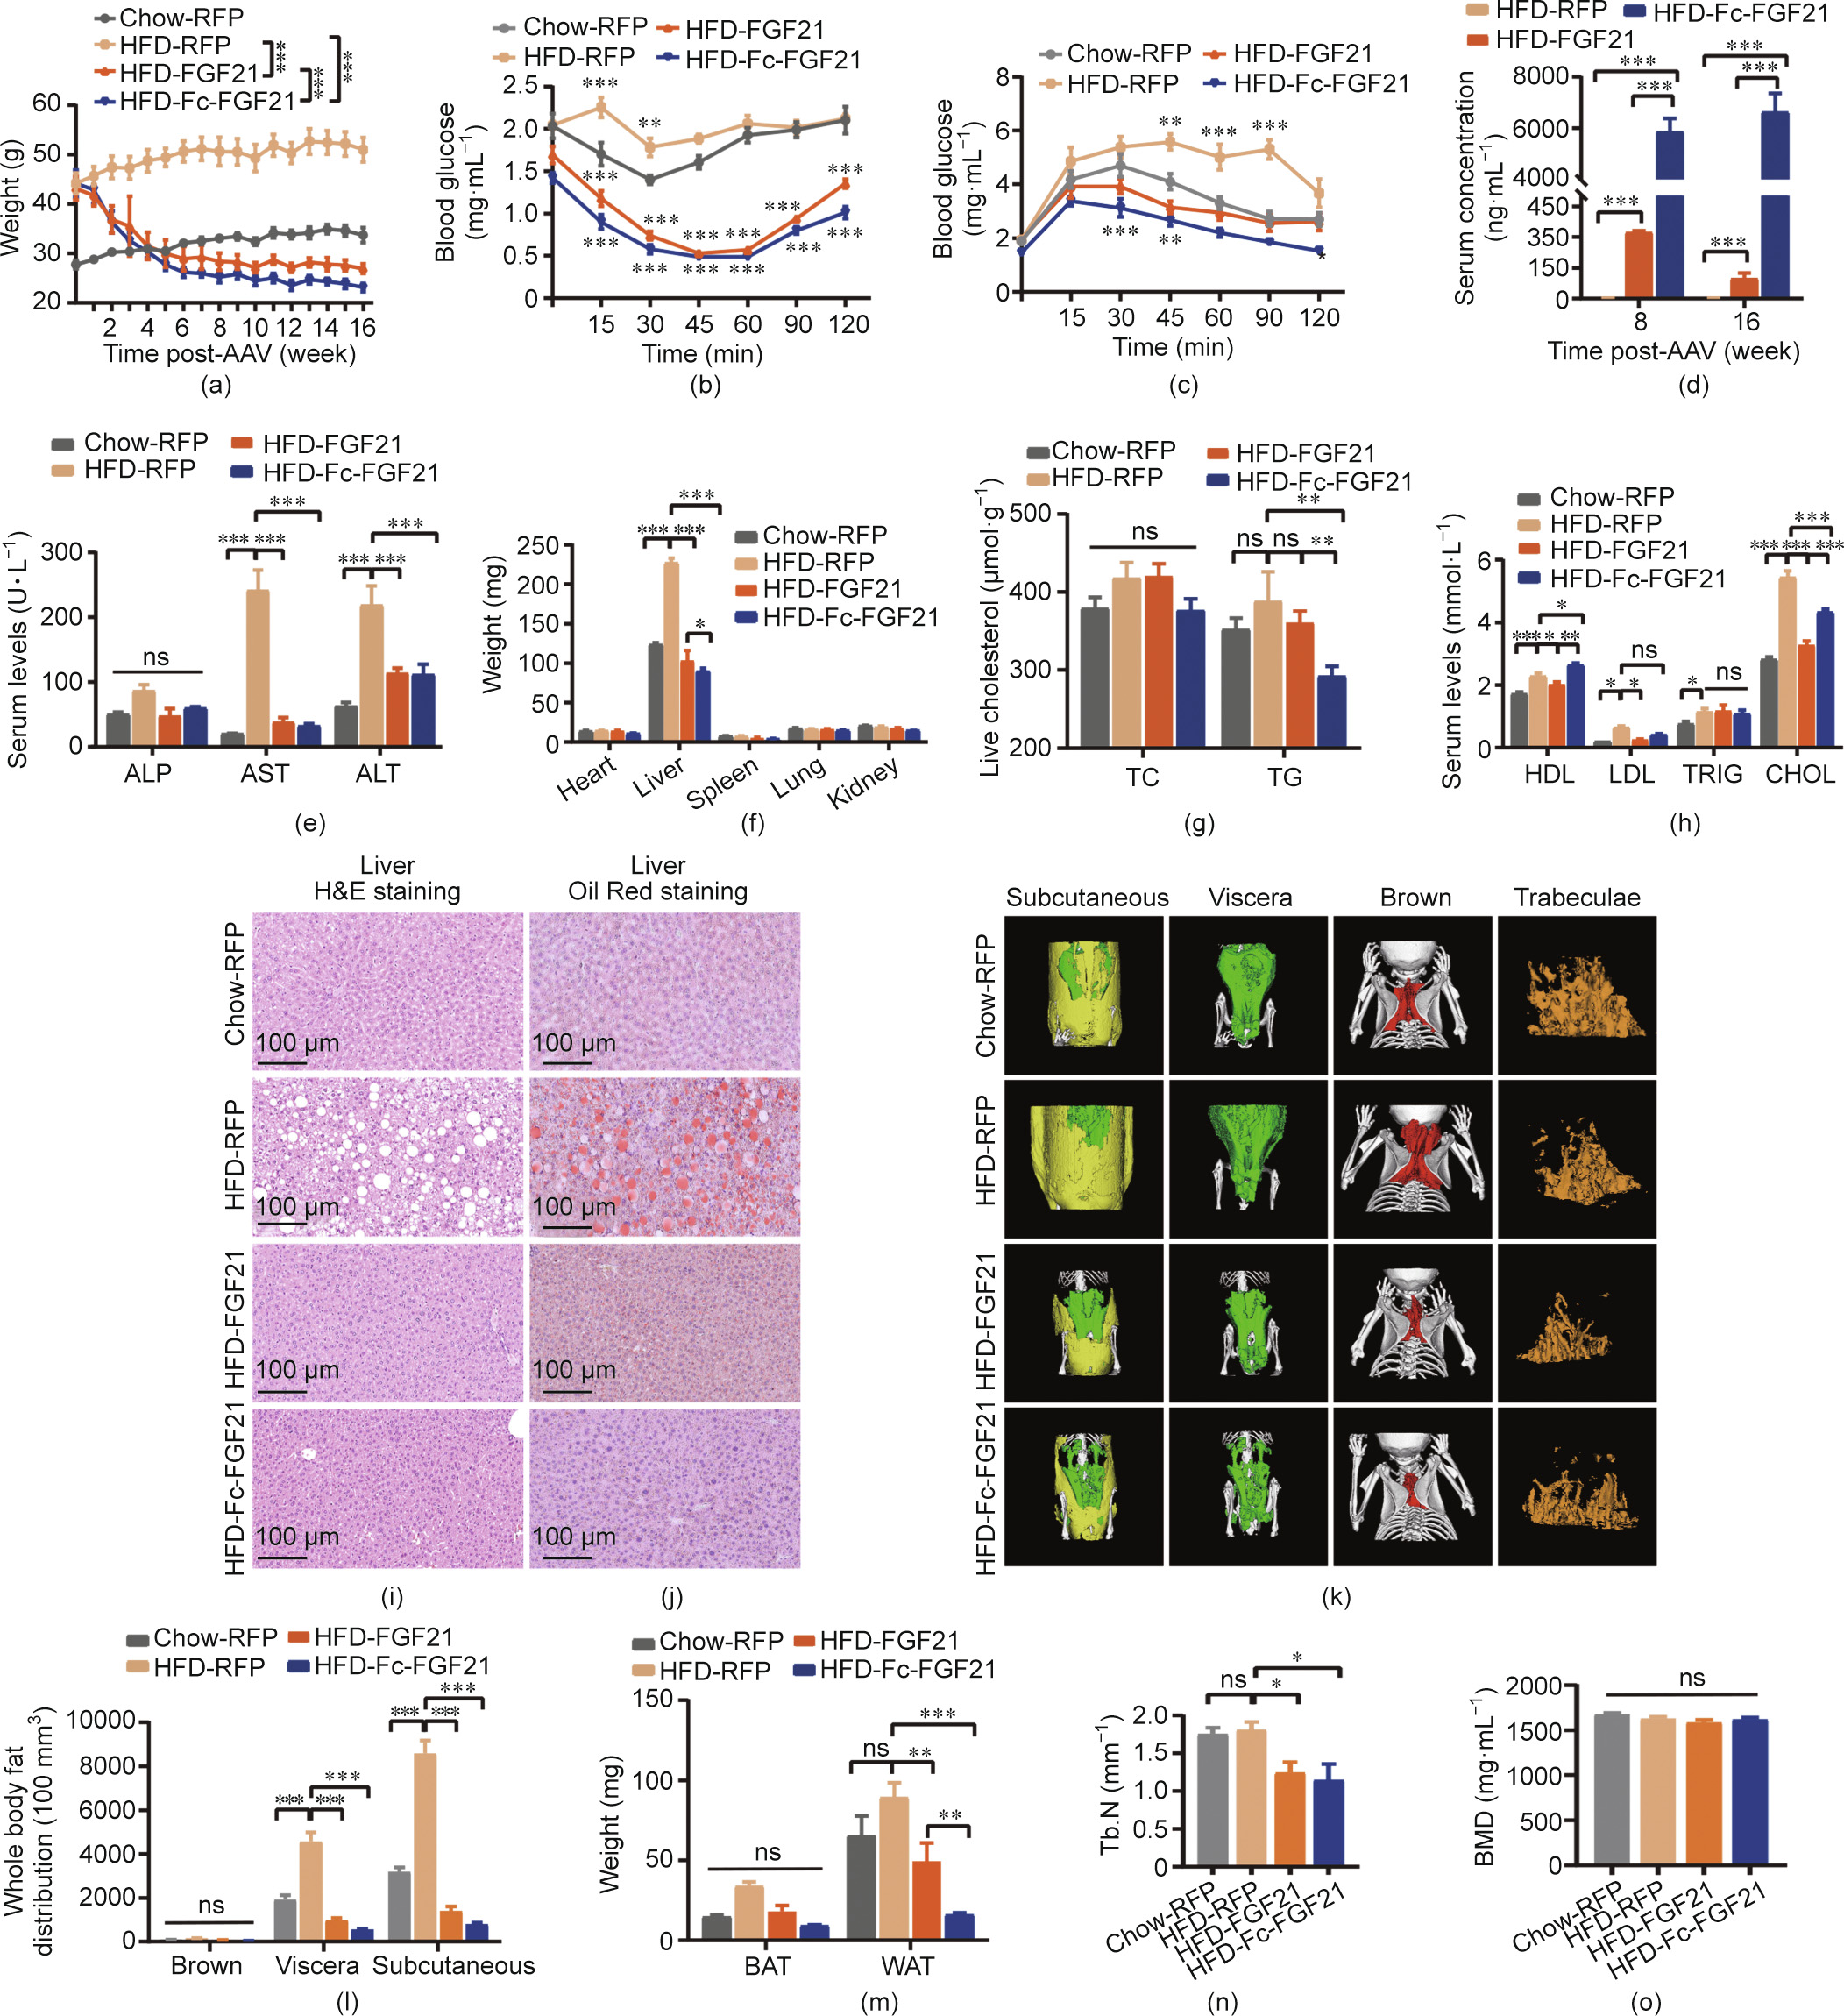
Fig. 4. AAV8-delivered gene therapy in the DIO mouse model. The (a) body weight was measured in different groups of mice at different times. Control groups include wildtype mice (n = 6) and DIO mice (n = 6) injected with the AAV8-RFP, and the other DIO mice in the experimental groups were injected with the AAV8-FGF21 (n = 6) or AAV8-FcFGF21 (n = 6). All the mice were treated with 1 × 10¹¹ vg per mouse virus. (b) An ITT was conducted in all experimental groups after an intraperitoneal injection of insulin (0.4 U·kg–1 body weight). (c) A GTT was conducted in the groups after an intraperitoneal injection of glucose (1.5 g·kg–1 body weight). (d) Serum levels of FGF21 and Fc-FGF21 at different time points after virus administration. (e) Serum levels of ALP, AST, and ALT. (f) Weight of the heart, liver, spleen, lung, and kidney obtained from mice treated with AAV8-RFP, AAV8-FGF21, and AAV8- Fc-FGF21. (g) Liver TC and TG levels. (h) Variables of lipid serum levels of HDL, LDL, TRIG, and CHOL. (i, j) H&E and Oil Red staining of the liver. (k) μCT 3D images of subcutaneous (yellow), visceral (green), and brown adipose tissue (red) distribution and the image of the trabecular bone of the tibial. (l) Quantification of different adipose tissue. (m) Weight of the WAT depots obtained from mice treated with AAV8-RFP, AAV8-FGF21, and AAV8- Fc-FGF21. (n, o) Quantification of BMD and Tb.N. All values are expressed as mean ± SEM. ns: no significance; * represents for p < 0.05; ** represents for p < 0.01; *** represents for p < 0.001.
《3.10. Fc-FGF21 improves liver function and lipid profiles in a DIO mouse model》
3.10. Fc-FGF21 improves liver function and lipid profiles in a DIO mouse model
Liver function in mice was investigated because a chronic HFD could lead to fatty livers. The liver serum marker results showed that ALT and AST levels in the experimental groups were normal (Fig. 4(e)). Despite this, the liver weight was lower in the HFDFc-FGF21 group than in the HFD-FGF21 group (Fig. 4(f) and Fig. S16(a) in Appendix A). Therefore, liver CHOL was measured, and the results demonstrated that AAV8-Fc-FGF21 performed better in reducing TC and TG levels in the HFD-induced obesity mouse model (Fig. 4(g)). Fc-FGF21 showed better hypolipidemic effects in the DIO mouse model than in db/db mice, with a marked reduction in serum CHOL and LDL concentrations also trended to decline, although no significant different (Fig. 4(h)). In addition, serum cholinesterase (CHE) reduced to normal in experimental mice and no significant differences were found in the other parameters including serum adiponectin, albumin protein (ALBP), total protein (TP), low-density lipoprotein cholesterol (LDLP), creatine kinase (CK), and uric acid (UA) compared to WT control mice, but urea nitrogen (UN) was considerably increased (Figs. S16(b)–(i) in Appendix A). The higher level of UN may be due to the rapid degradation of lipids in experimental mice. Furthermore, H&E staining analysis showed that there were larger fat vacuoles in the liver tissues of HFD-RFP control mice, while the fat vacuoles disappeared in the HFD-Fc-FGF21 group, and there was no difference in normal tissues from the sections (Fig. 4(i)). Oil Red staining also demonstrated that the liver tissue in the HFD-Fc-FGF21 group was from the same as that in normal mice (Fig. 4(j)). Overall, Fc-FGF21 treatment effectively reduced hepatic fat accumulation and facilitated recovery from liver damage in the DIO mouse model.
《3.11. Fc-FGF21 decreases adipose volume and reverses HFD-induced WAT cell hypertrophy in the DIO mouse model》
3.11. Fc-FGF21 decreases adipose volume and reverses HFD-induced WAT cell hypertrophy in the DIO mouse model
Our results indicated that Fc-FGF21 treatment decreased the body weight of DIO mice by 45.9%. Therefore, we further investigated the fat volume of mice after treatment. Using μCT, the subcutaneous (yellow) and visceral fat (green) of the AAV8-FcFGF21-treated mice was shown to decrease (Figs. 4(k) and (l)). In addition, the WAT weight in the HFD-Fc-FGF21 group was lower than that in the HFD-FGF21 group (Figs. 4(m) and Fig. S17(a) in Appendix A). Furthermore, H&E staining showed that the volume of white adipocytes was lower in the HFD-Fc-FGF21 group, and the decrease in lipid accumulation in BAT was less than that in the HFD-FGF21 group (Figs. S17(b) and (c) in Appendix A). This indicates that Fc-FGF21 enhances fat degradation to reduce body weight and improve liver function in mice, and reverses HFDinduced hypertrophy in WAT cells, which is better than gene therapy with FGF21.
As our results demonstrated that high concentrations of FcFGF21 and FGF21 caused bone loss in WT mice but not in db/db mice; therefore, we further explored whether bone loss occurred in the DIO mouse model. The results showed a remarkable decrease in Tb.N in the HFD-FGF21 and HFD-Fc-FGF21 groups, with no effect on Tb.Th and Tb.Sp (Fig. 4(n) and Figs. S18(a) and (b) in Appendix A). In addition, the bone mass parameters BMD, BV, TV, and BS/BV did not change significantly, but the other parameters, including BS, BV/TV, and BS/TV decreased noticeably, indicating that HFD-FGF21 and HFD-Fc-FGF21 treatment resulted in bone loss in the DIO mouse model (Fig. 4(o) and Figs. S18(c)–(h) in Appendix A). In conclusion, although the concentration of Fc-FGF21 was substantially higher than that of FGF21, bone loss was not more severe than that of FGF21.
《4. Discussion and conclusions》
4. Discussion and conclusions
In this study, using bifunctional (BsAb-sFc) and therapeutic proteins (Fc-FGF21) as examples, we provided evidence for the beneficial effects of the prolonged half-life of AAV8-expressed smallsize proteins in increasing their concentrations in vivo and further enhancing the efficacy and safety of the treatment. First, bifunctional antibodies were constructed, and our experimental results showed that both BsAb and BsAb-sFc potently neutralized HIV-1, and BsAb-sFc displayed a considerably longer half-life in vivo. Next, BsAb and BsAb-sFc were delivered by AAV8 and their concentrations at different doses were compared in vivo. These results showed that extending the half-life of the therapeutic protein at the same dose significantly increased protein concentration.
To validate this finding further, FGF21, which also has a short half-life, was selected to compare the differences between FGF21 and Fc-FGF21 delivered by AAV8 at different doses in vivo. The results were consistent with those of AAV8-expressing bifunctional proteins, with Fc-FGF21 showing a more significant reduction in body weight, fat volume, and liver weight at the same dose of AAV8. We further evaluated the efficacy in a leptin receptor-deficient db/db mouse model. The results showed that the weight gain of AAV8-Fc-FGF21-treated mice was controlled, and blood glucose levels decreased to normal levels. In addition, insulin sensitivity and glucose tolerance improved. The fat volume of the mice was not lowered, however, liver function and metabolic levels were improved, and there were no side effects, such as a reduction in BMD or bone trabeculae. Fc-FGF21 gene therapy was also more effective than that with FGF21 in the HFD-fed mouse model, including reduction in body weight, liver weight, fat weight, fat volume, and adipocyte size.
The therapeutic effects of FGF21 in models of obesity have been previously reported [32,34,35]. However, clinical studies of FGF21 analogs have not yielded effective results in improving blood glucose, such as when using animals, likely because of the relatively short half-life of protein-based therapeutics [31,36]. Whether the continuous expression of FGF21 by gene therapy could be a potential new treatment remains to be determined. Notably, according to the results of our experiments, FGF21 or Fc-FGF21 delivered by AAV8 reduced the number of bone trabeculae in the HFD-fed mouse model. In this regard, the concentration of Fc-FGF21 delivered by AAV8 remained effective after reducing the dose of AAV8 to achieve a therapeutic effect, however, the occurrence of side effects would be considerably reduced.
Multiple small proteins and peptides have been used clinically for the treatment of various diseases. However, their short halflife is considered to be a bottleneck in the development of therapeutic agents. As of 2020, 13 Fc fusion protein drugs have been approved by regulatory authorities in major markets [37]. However, even with Fc modification to prolong the half-life of a drug, it still needs to be administered frequently, which cannot fundamentally solve the problem. Therefore, the ‘‘one-and-done” therapeutic approach with durable pharmacology and efficacy is becoming increasingly attractive to patients and is a key feature of AAV gene therapy. Although the exponential growth of clinical trials using AAV vectors suggests that AAV has become a promising programmable vector to improve human health, the limitations and challenges of this gene delivery platform have to be recognized, including the high cost of AAV manufacturing and immunological barriers to delivery [38,39]. Furthermore, because a low capsid dose of vectors is more likely to be neutralized by autoantibodies, which is a result of unwanted innate immune responses and will compromise therapeutic efficacy, adequate vector dosage is frequently considered necessary for effective treatment [40]. However, the paradox is that the systemic toxicity induced by AAV vectors is also dose dependent. It has been observed that intravenous administration of high-dose AAV resulted in severe adverse events in two nonhuman primate studies, compromising the efficacy [41,42]. Therefore, there is an urgent requirement in the field of gene therapy to develop new strategies for reducing manufacturing costs and administration dosages. Based on our findings, we hypothesized that increasing the half-life of gene therapy drugs may be a way to reduce the required dose of the AAV, thereby solving the high dose toxicity and reducing the high cost of AAV gene therapy. Our study provides novel insights into optimizing current gene therapies and facilitates the expansion of its application to common diseases.
《Acknowledgments》
Acknowledgments
This study was supported by the National Key Research and Development Program of China (2019YFA0904400) and the National Natural Science Foundation of China (81822027, 81630090, and 81902108). The authors are grateful to Ms. Xiao Guo of the Joint Live Small Animal Imaging Laboratory of Fudan University Shanghai Medical College-PerkinElmer Company for her technical support with the use of high-resolution X-ray μCT scanning.
《Authors’ contribution》
Authors’ contribution
Yanling Wu and Tianlei Ying designed the experiments. Huifang Wu, Dan Hu, Quanxiao Li, Chunyu Wang, Xiaoyi Zhu, Binfan Chen, Keke Huang, and Ailing Huang conducted the in vitro and in vivo experiments. Wei Li and Dimiter S. Dimitrov performed the ADCC assays. Ping Ji and Jinghe Huang performed the HIV-1 neutralization assays. Huifang Wu and Tianlei Ying wrote the manuscript. All authors have contributed to the manuscript and approved the submitted version.
《Compliance with ethics guidelines》
Compliance with ethics guidelines
Huifang Wu, Dan Hu, Quanxiao Li, Chunyu Wang, Xiaoyi Zhu, Wei Li, Binfan Chen, Ping Ji, Keke Huang, Ailing Huang, Jinghe Huang, Dimiter S. Dimitrov, Yanling Wu, and Tianlei Ying declare that they have no conflict of interest or financial conflicts to disclose.
《Appendix A. Supplementary data》
Appendix A. Supplementary data
Supplementary data to this article can be found online at https://doi.org/10.1016/j.eng.2022.02.009.


 京公网安备 11010502051620号


