

《1. Introduction》
1. Introduction
With the rapid development of global economy and changes in lifestyles, the prevalence of type 2 diabetes mellitus (T2DM) has shown a sustained increasing trend [1,2]. It was estimated that there were 537 million people with diabetes (aged 20–79 years) worldwide in 2021, and this number is expected to reach 783 million by 2045 [3]. The increasing prevalence of diabetes will inevitably lead to an increase in the proportion of complications of diabetes, especially cardiovascular disease (CVD), which is acknowledged to be the leading cause of comorbidity and death among patients with T2DM [4]. Undoubtedly, effective management of T2DM is necessary to delay the occurrence of CVD and improve the quality of life of people with diabetes.
Lifestyle intervention is the cornerstone of management for patients with T2DM, often involving increased physical activity, reduced sedentary (SED) behavior, and restrictions on energy intake [5,6]. Regular physical activity is an important component of glycemic control and overall cardiovascular fitness in individuals with diabetes [5,7]. Higher intensity physical activity (e.g., moderate-to-vigorous-intensity physical activity (MVPA)) could have additional benefits toward cardiorespiratory fitness and glycated hemoglobin A1c (HbA1c) in T2DM patients [8]. Previous studies have illustrated that both a higher level of physical activity and decreased SED behavior are associated with a lower risk of CVD [9,10], and high levels of SED time have been independently associated with modest increases in CVD risk regardless of physical activity level [11]. Increased MVPA time and decreased SED time have been found to be important behaviors for promoting a favorable cardiometabolic risk profile in adults with type 2 diabetes [12,13], and the reallocation of SED time to MVPA time is also of vital importance [14].
China has the largest number of diabetes patients (140.9 million) in the world, with T2DM accounting for most cases [3]. Numerous studies from Western countries have reported significant associations of MVPA time and SED time with CVD risk factors among patients with T2DM [8,12–14], but such data from China are sparse. Moreover, a low MVPA time and high SED time are correlated [9], and it is necessary to combine both in order to analyze the association with CVD risk. Related studies on physical activity have focused primarily on changes in cardiometabolic risk factors [13,15] and have provided little evidence on the association with multifactorial control status [16], which refers to the multiple risk factors (i.e., poor blood glucose control, dyslipidemia, abnormal blood pressure (BP), and overweight/obesity) of diabetes patients that can be well managed to achieve control objectives. Multifactorial control status is an important monitoring indicator for diabetes patient management [5].
We therefore conducted a cross-sectional study based on the representative T2DM population in China to explore the association of MVPA time and SED time with CVD risk and multifactorial control status. Furthermore, we examined whether the association of SED time with a higher risk of CVD changed with the level of physical activity.
《2. Methods》
2. Methods
《2.1. Study design and population》
2.1. Study design and population
Data were obtained from the Multifactorial Intervention on Type 2 Diabetes (MIDiab) study, which involved 150 primary community health centers from both rural and urban areas, covering major geographic areas of 12 provinces/autonomous regions and three municipalities in the mainland of China. The protocol has been described previously [17]. The MIDiab study aimed to explore new regulations and guidelines involving a multifactorial intervention strategy to improve the current poor control rate of diabetes and diabetic vascular complications in China. The study protocol adhered to the 1964 Declaration of Helsinki and its later amendments and was approved by the Ethics Committee of Shandong Provincial Hospital, China. All participants provided written informed consent.
We used a cluster random sampling method to select a sample of people with diabetes aged between 35 and 75 years. According to geographical areas, six stratifications were formed: northeast, north, east, southwest, northwest, and south–central areas, and 2–4 provinces were selected from each stratification. Then, 1–5 cities were selected based on city development from each province/autonomous region. From each city, 2–8 communities were randomly selected. We included all the eligible T2DM patients from these communities as our sample. The diagnosis of diabetes was carried out according to the 1999 World Health Organization (WHO) Criteria [18]. A total of 9859 patients were recruited, without any sex or ethnic restriction. We removed participants that were missing important information, including age, height, weight, blood lipid concentrations, etc., and those without complete physical activity questionnaire information. We also excluded those with a total physical activity time of over 960 min·d–1, assuming that they slept at least 8 h·d–1 [19]. Finally, 9152 individuals were included in the analysis. A detailed flow chart is provided in Fig. 1.
《Fig. 1》

Fig. 1. Flow chart of data screening.
《2.2. Data collection》
2.2. Data collection
Data collection was conducted at local community health centers in the participants’ residential areas by trained staff according to a standard protocol. A questionnaire including information on sociodemographic characteristics, lifestyle factors, and medical history was administered by trained interviewers. Education attainment was categorized as less than high school (< 9 years) or as high school or above (≥ 9 years). Smoking status was categorized as never, former, or current smoking. Current alcohol drinkers were defined as people who drank alcohol at least once a week in the previous 12 months. Participants were also asked about their drug use in the previous six months.
Blood samples were collected from all participants between 8:00 a.m. and 10:00 a.m. after overnight fasting for at least ten hours. Lipid profile measurements (total cholesterol (TC), triglycerides (TGs), low-density lipoprotein cholesterol (LDL-C), and high-density lipoprotein cholesterol (HDL-C)) were performed by means of the terminal method using an autoanalyzer (AU 5800; Beckman, USA). HbA1c was measured via high-performance liquid chromatography using a glycosylated hemoglobin analyzer (MQ6000; Shanghai Huizhong Medical Treatment Technology Co., Ltd., China). All samples were tested at Kingmed Diagnostics Group Co., Ltd. (Jinan), China.
According to a standard protocol, body weight and height were measured in kilograms and centimeters, respectively. Body mass index (BMI) was calculated as weight in kilograms divided by height in meters squared. Waist circumference (WC) was measured midway between the lower edge of the costal arch and the upper edge of the iliac crest with the participants in the standing position, and the average value of three measurements was used. BP was measured using an electronic BP monitor on the nondominant arm three times consecutively with a one-minute interval between measurements, while the participant remained in a seated position after five minutes of rest in a quiet environment, and the average was used for data analysis.
《2.3. Assessments of physical activity and SED behavior》
2.3. Assessments of physical activity and SED behavior
Each questionnaire was conducted by a trained interviewer through a face-to-face survey. Physical activity was estimated using the International Physical Activity Questionnaire (IPAQ) on the intensity, duration, and frequency of physical activity. The IPAQ is a self-report questionnaire that assesses physical activity in the last seven days [20]; it classifies the activity into four intensity levels: sitting, walking, moderate intensity (e.g., lifting light objects, table tennis, or social dance), and vigorous intensity (e.g., lifting heavy objects, running, or swimming). A standardized question was used to ask patients about their physical activity information, taking moderate-intensity physical activity as an example: ‘‘How often and how long do you engage in moderate-intensity physical activity in a typical week (only calculate at least ten minutes each time)?” In this study, we used MVPA time (min·week–1 ) and SED time (h·d–1) as exposure factors.
According to the WHO 2020 guidelines on physical activity [21], adults—even those with chronic conditions and those living with disability—are recommended to perform at least 150–300 min of moderate-intensity physical activity, at least 75–150 min of vigorous-intensity physical activity, or at least 150 min of MVPA weekly for substantial health benefits. Thus, physical activity level was characterized as low, moderate, or high according to the minimum recommended MVPA time per week. More specifically, a low physical activity level was defined as < 150 min·week–1 (i.e., less than the minimum recommended MVPA time); a moderate physical activity level was defined as 150 to < 450 min·week–1 (i.e., 1–2 times the minimum recommended MVPA time); and a high physical activity level was defined as ≥ 450 min·week–1 (i.e., three or more times the minimum recommended MVPA time).
SED behavior was defined as any waking behavior characterized by an energy expenditure ≤ 1.5 metabolic equivalent units (METs) while in a sitting or reclining posture [22]. SED time was also estimated by using the IPAQ. Participants were classified into three categories according to their total SED time per day: low SED time was defined as < 4 h·d–1, moderate SED time was defined as 4 to < 8 h·d–1, and high SED time was defined as ≥ 8 h·d–1.
《2.4. Outcome variables》
2.4. Outcome variables
The primary outcome was the history of major cardiovascular events, which were defined as a composite of coronary heart disease, nonfatal stroke, and nonfatal myocardial infarction. The participants’ medical history was collected using a questionnaire. Participants who self-reported a history of any of the three diseases in the questionnaire were identified as having a CVD risk.
The secondary outcome was the multifactorial control status, for which the indicators we chose were HbA1c, LDL-C, BP, and BMI. According to the Standards of medical care for type 2 diabetes in China 2019 [5], the control targets for these four indicators were as follows: HbA1c < 7%; BP < 130/80 mmHg (1 mmHg = 133.3 Pa); LDL-C < 2.6 mmol·L–1 (without atherosclerotic CVD (ASCVD)) or < 1.8 mmol·L–1 (with ASCVD); and BMI < 24 kg·m–2 . The multifactorial control rate was the ratio of the number of patients with multiple risk factors reaching control targets to the total number of the study population, multiplied by 100%. The same method was used to calculate the control rate of a single factor.
《2.5. Statistical analysis》
2.5. Statistical analysis
The characteristics of the study population are presented as the means ± standard deviations (SDs), medians (interquartile ranges (IQR)), and proportions. For group comparisons, an independent sample t test and one-way analysis of variance (ANOVA) were used for normally distributed continuous variables, while the Mann– Whitney U test and Kruskal–Wallis test were used for nonnormally distributed variables. The χ2 test was used to compare categorical variables. The Bonferroni method was applied to correct P values from multiple comparisons. The odds ratios (ORs) and 95% confidence intervals (CIs) of CVD risk associated with MVPA time and SED time were estimated using mixed-effect logistic regression models, with CVD risk as the dependent variable, MVPA time and SED time as the independent variable, and the geographical regions of China as the random effect (random intercept and constant slope). To test whether lipid-lowering drugs affected the associations between MVPA time, SED time, and CVD risk, we repeated the mixed-effect logistic regression analyses after excluding patients who accepted intensive lipid-lowering therapy. To account for potential confounding effects of sex and age (< 65 and ≥ 65 years), regression models were created to compare the effects of MVPA time and SED time on CVD risk in different sex and age groups. The relationship of MVPA time and SED time with the control status of four risk factors was also assessed using mixed-effect logistic regression models. The adjusted P value was used to examine multiple secondary outcomes (BP, BMI, LDL-C, and HbA1c under control) by controlling the false discovery rate (FDR) with the commonly used Benjamini–Hochberg method.
Statistical analyses were performed with SPSS version 25.0 (SPSS Inc., USA). Two-sided P values less than 0.05 were considered to be statistically significant.
《3. Results》
3. Results
《3.1. Baseline characteristics》
3.1. Baseline characteristics
The baseline characteristics of the study population grouped by preexisting CVD status are provided in Table 1. Overall, the participants had a mean ± SD age of (60.87 ± 8.44) years, 44.5% were women, and 25.1% had CVD. Compared with participants without preexisting CVD, those with CVD were older, had a lower MVPA time, and had a longer diabetes duration. Participants with preexisting CVD tended to have a higher BMI, WC, systolic BP (SBP), diastolic BP (DBP), and HbA1c level, and a lower TC and LDL-C level. The proportion of the use of lipid-lowering drugs was higher in the CVD group than in the non-CVD group (33.9% versus (vs) 18.1%, P < 0.001); it should be noted that the change in blood lipids may be related to intensive lipid-lowering therapy among patients with CVD [2].
The sociodemographic, anthropometric, and clinical characteristics of the T2DM patients according to the different MVPA times and SED times are shown in Table 2. Most patients had a low physical activity level, and 7.9% had a high SED time. Compared with patients in the low-MVPA group, those with a high MVPA time had a lower BMI, SBP, and TGs, while patients in the high-SED group had a higher BMI and TGs than those in the low-SED group. The proportion of drug use (e.g., antihypertensive agents, lipidlowering drugs, and insulin) was lowest in the high-MVPA group and the low-SED group. There was a higher proportion of overweight/obese patients with both high SED time and low MVPA time (Table S1 in Appendix A).
《Table 1》
Table 1 Baseline characteristics of the study population according to preexisting CVD status.


Values are presented as the means ± SDs, proportions, or medians (IQR). P values are for the t test or χ2 test comparing the two groups.
SBP: systolic BP; DBP: diastolic BP.
a Education attainment refers to high school or above.
b Missing the information of insulin use, n = 164.
《Table 2》
Table 2 Sociodemographic, anthropometric, and clinical characteristics of the study population according to different MVPA times and SED times.

P values were calculated by ANOVA or the χ2 test for each MVPA time or SED time group.
a Missing the information of insulin use, n = 164.
《3.2. Multifactorial control rates in different subgroups》
3.2. Multifactorial control rates in different subgroups
With higher MVPA time, the multifactorial control rate showed a positive trend (Fig. 2(a)). The control rates of both BP and BMI were higher in the high-MVPA group than in the low-MVPA group (BP: 29.1% vs 25.9%, P = 0.034; BMI: 35.1% vs 30.9%, P = 0.011). The control rate of HbA1c was higher in the moderate-MVPA group than that in the low- and high-MVPA groups. The high-MVPA group had better control rates of LDL-C than the moderate- and low-MVPA groups. The control rate of BMI was lowest in the group with the longest SED time (≥ 8 h·d–1) (Fig. 2(b)). It was notable that only 3.1% of the study population achieved all target control levels for BP, BMI, HbA1c, and LDL-C (Fig. 2).
《Fig. 2》
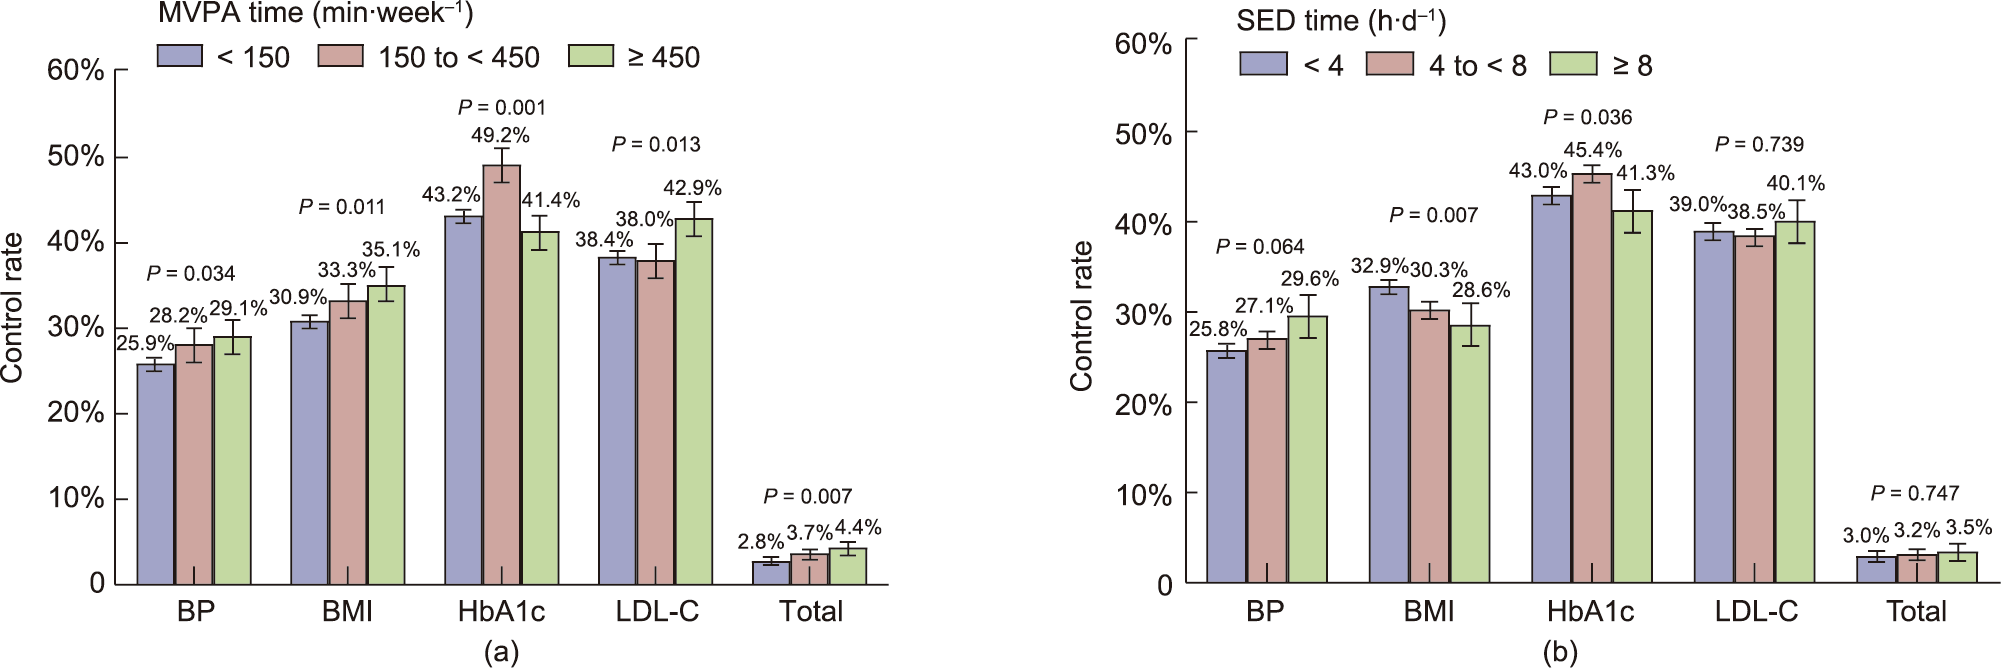
Fig. 2. Multifactorial control rates of the study population, grouped by (a) MVPA time and (b) SED time. P values are for the χ2 test across the three categories of MVPA time or SED time. A P value < 0.05 is considered significant.
《3.3. Associations between MVPA time, SED time, and CVD risk》
3.3. Associations between MVPA time, SED time, and CVD risk
The mixed-effect logistic regression analysis revealed the association between MVPA time, SED time, and CVD risk after adjustment for potential confounders (Table 3). High MVPA time was associated with a reduced risk of CVD (OR (95% CI), 0.830 (0.704–0.978)) (model 2). The association between high physical activity levels and CVD risk did not change substantially even after further adjustment for SED time (model 3). The rate of patients with high MVPA time was higher in the non-CVD group than in the CVD group (Fig. S1 in Appendix A). Regarding SED behavior, a high SED time (≥ 8 h·d–1) was significantly associated with a higher risk of CVD (OR (95% CI), 1.266 (1.047–1.530)) (model 2). Importantly, this association remained after further adjustment for MVPA time (model 3). In summary, low MVPA time (< 150 min·week–1 ) and high SED time (≥ 8 h·d–1) were significant independent risk factors for CVD.
We examined the relationship between MVPA time, SED time, and CVD risk in different sex and age groups (Tables S2 and S3 in Appendix A). In men and in the < 65-year group, a high MVPA time was associated with a lower risk of CVD (both P < 0.05). A positive association between SED time and CVD risk was found in men and in the older age group (both P < 0.05).
《Table 3》
Table 3 Individual associations of MVPA time and SED time with CVD risk.
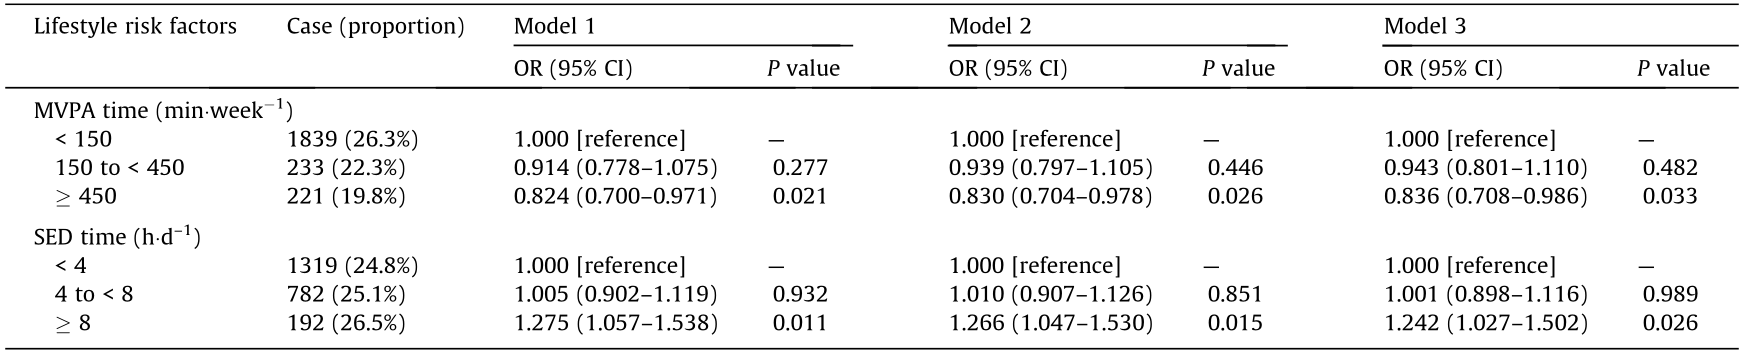
Estimated using mixed-effect logistic regression with China’s geographical region characteristics as the random effect (random intercept and constant slope).
Model 1: adjusted for age, sex, and BMI.
Model 2: Model 1 + diabetes duration, per capita monthly income, smoking status (current or former smoker vs never smoker), current drinking (yes vs no), and education attainment (below high school vs high school or above).
Model 3: Model 2 + SED time (when examining MVPA time) or MVPA time (when examining SED time).
Reference group refers to group with MVPA time ≥ 450 min·week–1 and SED time < 4 h·d–1 .
《3.4. Associations between MVPA time, SED time, and multifactorial control status》
3.4. Associations between MVPA time, SED time, and multifactorial control status
The associations between MVPA time, SED time, and multifactorial control status are shown in Fig. 3. A higher level of physical activity had a positive effect on the control of BMI and HbA1c. Compared with the low-MVPA group, the high-MVPA group was more likely to achieve the target BMI level (OR (95% CI), 1.260 (1.100–1.442)) (Fig. 3(b)). Those who sat for more than 8 h·d–1 were less likely to achieve the target BMI level than those who sat for less than 4 h·d–1 (OR (95% CI), 0.807 (0.678–0.960)) (Fig. 3(b)).
《Fig. 3》
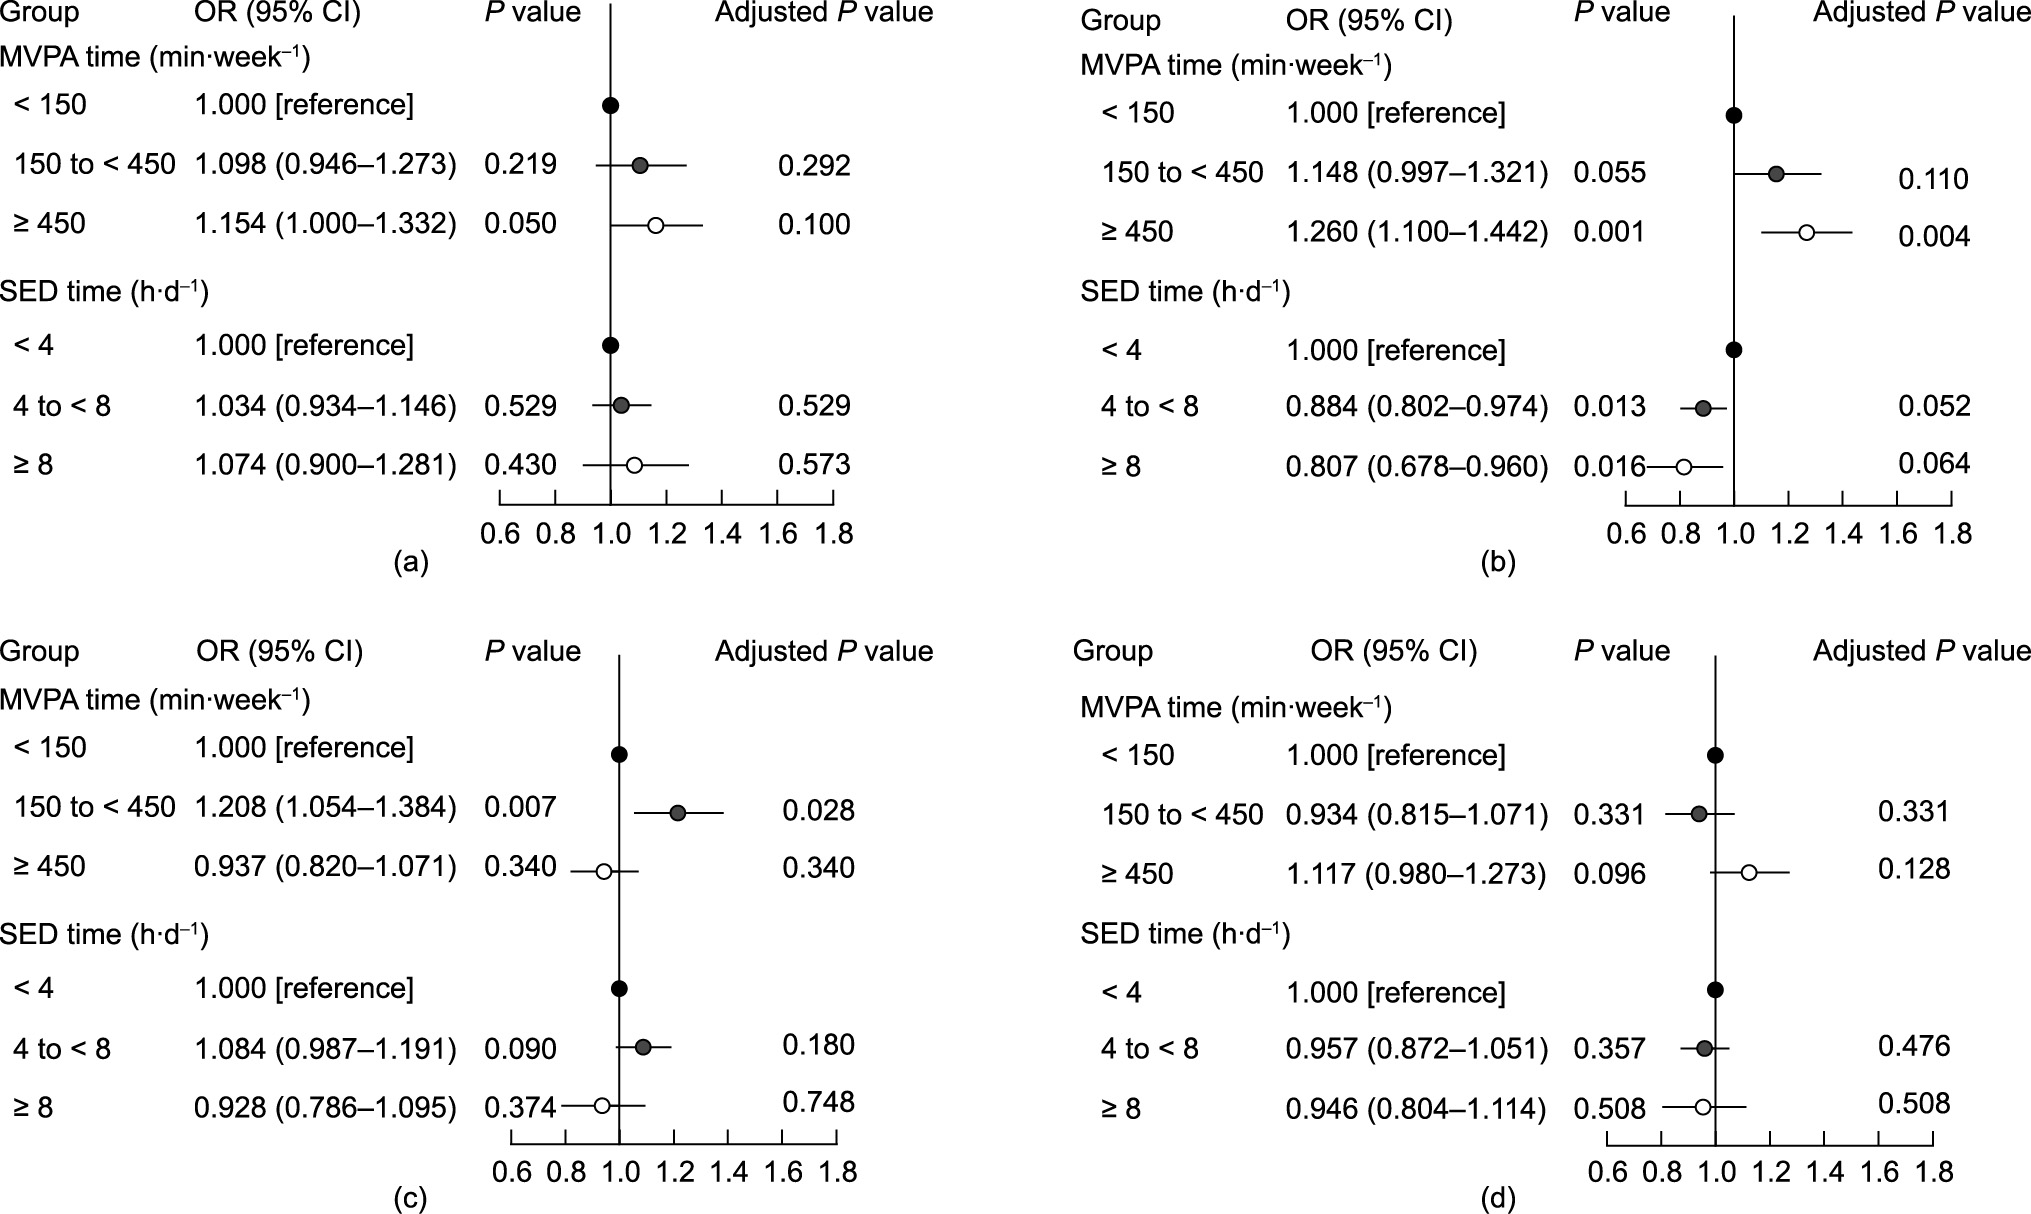
Fig. 3. Associations between MVPA time, SED time, and multifactorial control status. Multifactorial control status included (a) BP under control, (b) BMI under control, (c) HbA1c under control, and (d) LDL-C under control. Estimated using mixed-effect logistic regression with China’s geographical region characteristics as the random effect (random intercept and constant slope). Adjusted for age, sex, diabetes duration, per capita monthly income, smoking status (current or former smoker vs never smoker), current drinking (yes vs no), and education attainment (below high school vs high school or above).
《3.5. The joint effects of MVPA time and SED time on CVD risk》
3.5. The joint effects of MVPA time and SED time on CVD risk
Table 4 shows the ORs (95% CI) for the joint effects of MVPA time and SED time on CVD risk. Compared with the reference group (i.e., those with MVPA time ≥ 450 min·week–1 and SED time < 4 h·d–1), CVD risk was higher in the low-MVPA group: The OR (95% CI) associated with an SED time < 4 h·d–1 was 1.270 (1.040–1.553) and that associated with an SED time ≥ 8 h·d–1 was 1.499 (1.149–1.955). In the moderate-MVPA group, patients with an SED time ≥ 8 h·d–1 had a higher CVD risk than those in the reference group (OR (95% CI), 2.250 (1.215–4.166)). However, in the high-MVPA group, there was no significant correlation between the amount of SED time and CVD risk.
《Table 4》
Table 4 Joint effects of MVPA time and SED time on CVD risk.
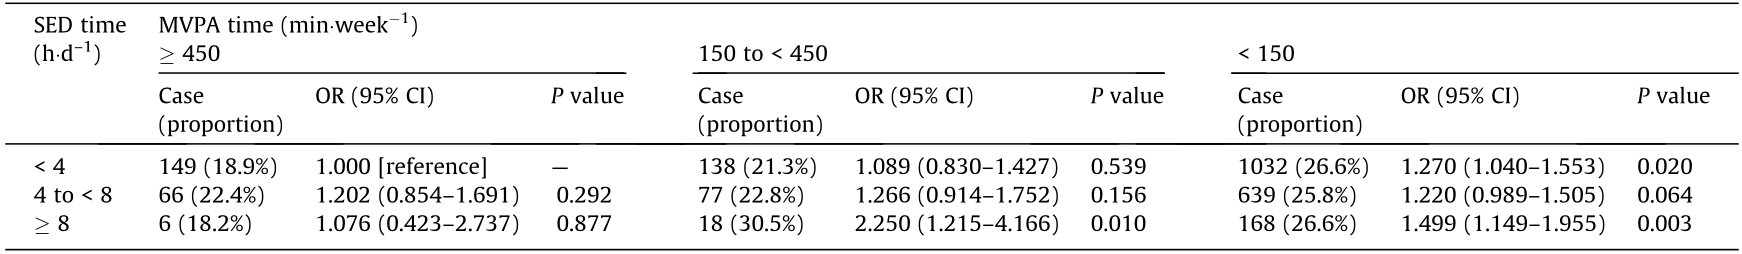
Reference group is defined as participants with a high MVPA time (≥ min·week–1 ) in combination with a low SED time (< 4 h·d–1).
Estimated using mixed-effect logistic regression with China’s geographical region characteristics as the random effect (random intercept and constant slope). Adjusted for age, sex, diabetes duration, per capita monthly income, smoking status (current or former smoker vs never smoker), current drinking (yes vs no), education attainment (below high school vs high school or above), and BMI.
《3.6. Sensitivity analyses》
3.6. Sensitivity analyses
These findings were further confirmed by a sensitivity analysis. We excluded 2109 patients (23.04% of the analytic sample) who used lipid-lowering drugs and found that the trend did not change substantially (Tables S4 and S5 in Appendix A). High MVPA time was associated with a reduced risk of CVD (OR (95% CI), 0.825 (0.678–1.003)), with a P value (0.053) that was at the border line (Table S4, model 2). A high SED time was associated with a higher risk of CVD (OR (95% CI), 1.272 (1.013–1.597)), independent of MVPA time (Table S4, model 3). In the analysis of the joint effects of MVPA time and SED time on CVD risk, compared with the reference group (i.e., those with a MVPA time ≥ 450 min·week–1 and an SED time < 4 h·d–1), CVD risk was higher among patients with an SED time ≥ 8 h·d–1 in the moderate- and low-MVPA groups: The OR (95% CI) in the moderate-MVPA group was 2.106 (1.043–4.255) and that in the low-MVPA time group was 1.437 (1.052–1.963) (Table S5). To examine the potential heterogeneity in the intercept and/or slope in different regions, we conducted a sensitivity analysis treating the geographical regions as fixed effects in order to estimate the ORs (95% CI) for CVD risk (Tables S6 and S7 in Appendix A). The results from the sensitivity analysis were robust.
《4. Discussion》
4. Discussion
In this multicenter and cross-sectional study of 9152 patients with T2DM in China, almost 76.4% did not meet the minimum physical activity guideline recommendations by the WHO. The key finding of this study is that a high physical activity level was associated with significantly lower odds of CVD risk, while the higher odds of CVD risk associated with higher SED time were not observed among participants who also had high MVPA time.
The results of our study indicate an inverse association between MVPA time and CVD risk after adjustment for potential confounding factors. Importantly, this association is independent of SED time. These findings are consistent with previous studies showing that people who exceeded the minimum recommended amounts of physical activity obtained additional health benefits and a higher level of physical fitness [23,24]. Higher physical activity has been associated with a lower risk of major CVD [10]. The reasons for the positive effects of physical activity on patients with diabetes may involve decreased glucose, improved insulin resistance levels, and enhanced control of CVD risk factors [16,25,26]. The relationship between MVPA time and CVD risk was not found in women and in people aged 65 or older; this phenomenon may be related to the other forms of exercise (e.g., walking, gardening, or housework) that we did not count [27]. Patients with T2DM should be encouraged to perform more than 450 min of MVPA per week in order to achieve significant physical benefits as long as their body can tolerate it. Elderly people who are unable to exercise vigorously due to illness or disability should perform multicomponent physical activity to enhance functional capacity and prevent falls [21,28]. For example, performing balance exercises (e.g., Tai Chi and yoga) can improve or maintain physical function and reduce falls in older adults at risk of falling [29]. It is also important to select an appropriate physical activity type and to discuss it with a physician before starting a new exercise program [30].
Our study found that the positive correlation between SED time and CVD risk was not observed in the high physical activity group, which was consistent with the results of previous studies [31]. SED behavior has significant effects on cardiovascular health and CVDrelated risk factors [32], such as increased BMI, increased BP, increased blood lipids, and altered vascular structure and function (e.g., stiffness and increased intima-media thickness). People with a high sitting time are more likely to be obese [33], and obesity contributes to the inflammatory cascade that promotes atherosclerotic disease in a variety of ways [34]. Obesity is likely to mediate the association between SED time and CVD risk. There is evidence that higher intensity physical activity has positive effects on losing weight and resisting inflammation in patients with T2DM [26,35]. These potential associations may explain our observation. To address the concern that patients with preexisting CVD commonly accepted intensive lipid-lowering therapy [26], we conducted sensitivity analyses that excluded individuals using lipid-lowering drugs. We found that the main results did not change substantially.
As shown in this study, people with diabetes should reduce their daily SED time. If long periods of daily SED behavior are unavoidable (e.g., for study, work, or transit), performing additional high-intensity physical activity is strongly recommended. For older adults, any physical activity is better than being SED [28]. In addition, breaking up prolonged periods of time spent sitting with physical activity can attenuate or counteract the effects of SED behavior [36,37].
Our study also comprehensively described the multifactorial control rates in the MVPA time and SED time groups based on a nationally representative T2DM population. With higher MVPA time, the multifactorial control rate showed a positive trend. Increased physical activity played an important role in improving glycemic control, lipids, and BP in T2DM patients [15]. In the present study, we clearly observed that patients with a higher MVPA time level were more likely to achieve the targeted BMI objective. The impact of physical activity and SED behavior on CVD may be mediated by these intermediate health outcomes. Improving the control of these risk factors may provide benefits to improve cardiovascular health.
Although several organizations have issued guidelines for the minimum recommended level of physical activity required to have a positive effect on people’s health [15,21,23,25], patients with T2DM who have or are at risk for ASCVD still report low levels of physical activity and have low measured cardiopulmonary fitness [38]. We found that patients with both high SED time and low MVPA time were more likely to be overweight/obese, which reminded us to pay attention to this population and transfer them from high-risk populations by offering effective behavioral intervention recommendations. To fundamentally change the undesired lifestyle habits of people with diabetes, doctors in primary healthcare institutions should make great efforts to provide reasonable exercise guidance, as well as positive information and education.
One major strength of our study is that the population was representative, with a large sample size recruited from 150 primary community health centers from 15 provinces/autonomous regions and three municipalities in six geographic regions across China. However, our study is not without limitations. First, this study was a cross-sectional study and the main outcome was selfreported history; thus, no conclusion about causality can be drawn. In our future follow-up work with our cohorts, we will attempt to obtain more data on the effect of physical activity and SED behavior on the incidence and mortality related to CVDs in T2DM patients. Second, information on physical activity and SED behavior was obtained through questionnaires rather than by means of objective measurements. Although the variables of the questionnaires were based on the IPAQ, whose reliability and validity were verified in a previous study [20], self-reported data may be subject to recall bias, and future studies using objective measures of physical activity should be conducted. Finally, dietary habits are an important component of lifestyle interventions for T2DM patients [39], and occupational physical activity is associated with CVD risk [40]. However, we were unable to adjust for dietary habits and occupational status due to the lack of information.
《5. Conclusions》
5. Conclusions
In conclusion, high levels of self-reported physical activity (i.e., ≥ 450 min·week–1 MVPA) were associated with lower odds of CVD risk, regardless of SED time. The findings of this study provide an updated perspective on how exercise prescriptions can be improved for patients with T2DM. For example, diabetes patients should be encouraged to perform more than 450 min of MVPA per week in order to reduce the proportion of medication use and improve the multifactorial control rate, thus further delaying the occurrence and progression of CVD and relieving the disease burden. For older adults, any physical activity is better than being SED, and reducing SED time is of vital importance for their physical health. Future studies comparing different types of physical activity interventions are necessary for people with diabetes in order to select the optimum physical activity pattern.
《Acknowledgments》
Acknowledgments
This study was supported by the National Key Research and Development Program of China (2017YFC1309800), the ‘‘Outstanding University Driven by Talents” Program and Academic Promotion Program of Shandong First Medical University (2019LJ007), and the Key Research and Development Program of Shandong Province (2017CXGC1214). We are deeply grateful to all the investigators, the staff, and the participants of the study for their valuable contributions.
《Authors’ contributions》
Authors’ contributions
Yafei Wu, Guijun Qin, Guixia Wang, Libin Liu, and Bing Chen contributed equally and developed the concept. Yafei Wu, Zhongshang Yuan, Ling Gao, and Jiajun Zhao conceived and designed the study. Qingbo Guan, Xu Hou, Chao Xu, Haiqing Zhang, Xu Zhang, Qiu Li, Yongfeng Song, Fei Jing, Shizhan Ma, Shanshan Shao, Meng Zhao, Qingling Guo, Nanwei Tong, Hongyan Zhao, Xiaomin Xie, Chao Liu, Zhongyan Shan, Zhifeng Cheng, Xufeng Yu, Shulin Chen, Tao Yang, Yangang Wang, Dongmei Li, and Zhaoli Yan conducted the collection of data. Yafei Wu, Zhongshang Yuan, Ling Gao, Yongfeng Song, and Jiajun Zhao performed statistical analyses and interpretated data. Yafei Wu, Guijun Qin, Guixia Wang, Libin Liu, and Bing Chen were involving in drafting the article. Lixin Guo, Qiuhe Ji, Wenjuan Wang, and Jiajun Zhao revised the manuscript. All authors had final approval of the submitted and published versions.
《Compliance with ethics guidelines》
Compliance with ethics guidelines
Yafei Wu, Guijun Qin, Guixia Wang, Libin Liu, Bing Chen, Qingbo Guan, Zhongshang Yuan, Xu Hou, Ling Gao, Chao Xu, Haiqing Zhang, Xu Zhang, Qiu Li, Yongfeng Song, Fei Jing, Shizhan Ma, Shanshan Shao, Meng Zhao, Qingling Guo, Nanwei Tong, Hongyan Zhao, Xiaomin Xie, Chao Liu, Zhongyan Shan, Zhifeng Cheng, Xufeng Yu, Shulin Chen, Tao Yang, Yangang Wang, Dongmei Li, Zhaoli Yan, Lixin Guo, Qiuhe Ji, Wenjuan Wang, and Jiajun Zhao declare that they have no conflict of interest or financial conflicts to disclose.
《Appendix A. Supplementary data》
Appendix A. Supplementary data
Supplementary data to this article can be found online at https://doi.org/10.1016/j.eng.2022.05.013.


 京公网安备 11010502051620号


