《1. Introduction》
1. Introduction
Metamaterials, which are artificial structures that usually contain a periodic unit cell arrangement, have been a hot research topic in recent years due to their excellent ability in electromagnetic (EM) wave regulation and customized design [1–4]. The EM response of each metamaterial unit can be adjusted by controlling a metamaterial’s geometrical structure or material properties [5– 8]. Therefore, metamaterials have wide application potential in optical path control [9–11], filtering [12,13], perfect lenses [14,15], and so forth [16–19]. More specifically, in the field of EM wave absorption, a gradient metamaterial structure can optimize the impedance of absorbers, which significantly improves the subsequent absorption efficiency [20].
However, once a metamaterial absorber has been designed and manufactured, its EM response usually cannot be changed. Thus, metamaterial devices with dynamic electromagnetic response characteristics (referred to herein as MDDEs) are critical to meet the requirements of practical applications. By adding elements to a circuit using a PIN diode or a variable capacitor diode, the capacitance or inductance of an MDDE can be effectively changed to modify the resonance frequency, which can realize adjustment of the absorption bandwidth of an MDDE based on electric regulation technology [21–24]. However, both the broadband wave absorption performance and the practical application of metamaterials have been limited by narrow resonant bands and complex electronic device structures. As an important solution, fluid tuning technology, whose medium mainly includes distilled water and liquid metals, has been used to achieve EM wave absorption with a broad bandwidth [25–27]. Compared with electric regulation technology, the effective absorption bandwidth can be significantly improved through simulation and optimization (reflection loss value < ––10 dB, bandwidth > 20 GHz). However, most of the proposed designs generally exhibit a low tuning speed and require rigid injection channels, which limit their potential applications. Apart from this approach, the EM response of a metamaterial can be effectively controlled by physically changing the unit cell structure [28,29], which is simple and effective yet requires a complicated fabrication process.
As an alternative to the abovementioned regulation methods, thermo-tunable metamaterials have stimulated the interest of researchers due to their simple structure operation and fast control speed [30–32]. For example, switching germanium telluride (GeTe) between an amorphous and a crystalline state can be realized by a thermal method. Jeong et al. [33] proposed an active MDDE based on GeTe material using a thermal method. When the state of the GeTe was shifted to crystalline, the absorption peak decreased to 9.6 GHz and the corresponding absorption value increased to –0.36 dB. Strontium titanate (STO) is another excellent candidate material for thermally active MDDEs. An MDDE with adjustable thermal frequency was designed by Wang et al. [34], who used STO with an electric resonance ring (ERR) and placed them close to each other, causing the wave absorption frequency to shift to a high frequency with increasing temperature. However, the high regulated transition temperature and the extremely narrow wave absorption bandwidth (less than 0.5 GHz) in this case were far from the requirements for practical applications.
Due to the different frequency dispersion dielectric constant of water at different temperatures, water is widely used in the field of thermally tunable microwave absorption. Shen et al. [35] and Pang et al. [36] proposed a thermally tunable metamaterial absorber based on a water-substrate construction. The maximum effective absorbing bandwidth (reflection loss < –10 dB) of their metamaterial absorber was 14.2 GHz (2.6–16.8 GHz). Different EM absorption responses could be realized by controlling the ambient temperature of the metamaterial. However, because the dielectric constant of water decreases sharply with an increase in frequency, the metamaterial absorber proposed by Shen et al. [35] and Pang et al. [36] could not achieve higher absorptivity and a wider absorption band, limiting its ability in absorbing the peak offset.
In this work, we present an active thermo-tunable broadband metamaterial (T-TBM), which is characterized by the broadband absorption of traditional graded metamaterials and whose absorption response can be actively regulated. More specifically, the T-TBM is composed of photopolymer- and paraffin-based composites (PD-Cs), which consist of reduced graphene oxide (RGO) @Fe3O4 nanocomposites and paraffin with different phase transition temperatures. The T-TBM was prepared by inserting PD-Cs with different phase transition temperatures into photopolymer cavities at different positions by means of direct writing. Based on the change in the EM properties of the PD-Cs before and after paraffin phase transition, the response of the T-TBM to EM waves can be regulated. The absorber can achieve active offset of the reflection loss peak under broadband absorption conditions. More importantly, we demonstrate that, by controlling the solid–liquid state of the PD-Cs in the metamaterial units (i.e., by controlling the temperature of the T-TBM), the absorption bandwidth (where the reflection loss value is less than –30 dB) can be further broadened or narrowed. The proposed metamaterial provides a new approach to flexibly manipulate the absorption bandwidth range, which is no longer limited to narrow-band absorption. By adjusting the temperature of the T-TBM, the absorber can achieve a –30 dB wave absorption band offset while satisfying broadband absorption, which is clearly beneficial for multifunctional applications such as EM wave modulators, thermal control switches, thermal control antennas, and intelligent temperature control systems.
《2. Materials and preparation》
2. Materials and preparation
《2.1. Preparation of RGO@Fe3O4 nanocomposites》
2.1. Preparation of RGO@Fe3O4 nanocomposites
A mechanical method was utilized to prepare the RGO@Fe3O4 nanocomposites, as follows: 5 g of RGO (Yichang Xincheng Graphite Co., Ltd., China) and 20 g of Fe3O4 (Aladdin Group Co., China) were respectively dispersed in 500 and 200 mL of ethanol (Aladdin Group Co.) for 20 min each. Then the dispersed Fe3O4 alcohol solution was slowly poured into the RGO alcohol dispersion solution and stirred for 20 min. The dispersed RGO@Fe3O4 nanocomposite alcohol was poured into a vacuum filter funnel and filtered for 24 h. Finally, the filtered RGO@Fe3O4 nanocomposites were placed in a vacuum oven for 48 h at 45 °C.
《2.2. Preparation of PD-Cs》
2.2. Preparation of PD-Cs
Solid phase change paraffins (PC#38, PC#48, PC#58; Guangzhou Zhongjia New Material Technology Co., Ltd., China) were placed in a blast oven to melt until they were liquid; Span-80 (Sinopharm Chemical Reagent Shaanxi Co., Ltd., China), with a mass fraction of 5%, was then dripped into the liquid phase change paraffins. RGO@Fe3O4 nanocomposites with a mass fraction of 15% were placed in different types of liquid phase change paraffins and sonicated for 30 min.
《2.3. Manufacture of T-TBM》
2.3. Manufacture of T-TBM
As depicted in Figs. 1(a)–(f), a T-TBM plate with a size of 200 mm × 200 mm was manufactured using a two-step molding method. First, a metamaterial frame with a periodic structure was prepared by means of stereolithography using hightemperature-resistant photosensitive resin (Shaanxi Hengtong Intelligent Machine Co., Ltd., China) as the raw material, as shown in Fig. 1(a). It is notable that the permittivity and loss tangent of this photosensitive resin are 2.85 and 0.01, respectively, and the heat deflection temperature is 91 °C. Next, the metamaterial frame was fixed on the processing platform (Fig. 1(b)), and the melted PD-Cs at different phase transition temperatures were respectively written into the metamaterial frame by means of direct writing, as shown in Figs. 1(c)–(e). It is worth noting that different elements of the metamaterial were written using different PD-Cs with different phase transition temperatures. Finally, the formed T-TBM was removed from the processing platform (Fig. 1(f)).
《Fig. 1》

Fig. 1. (a) Preparation of the metamaterial body using stereolithography. (b) The metamaterial body is fixed on the workbench with bolts. (c–e) PD-Cs with phase transition temperatures of (c) 58 °C, (d) 48 °C, and (e) 38 °C are respectively inserted into the metamaterial body by means of direct writing. (f) The prepared T-TBM is unloaded from the workbench.
《3. Results and discussion》
3. Results and discussion
《3.1. Characterization of RGO@Fe3O4 nanocomposites》
3.1. Characterization of RGO@Fe3O4 nanocomposites
The microstructures of the RGO@Fe3O4 nanocomposites were characterized. As shown in Figs. 2(a) and (b), the Fe3O4 nanocomposites were successfully embedded between the RGO lamella. The nanocomposites have a nano-layered structure, which promotes the multiple reflection and scattering of EM waves. The morphology of the RGO@Fe3O4 nanocomposites was measured using a transmission electron microscope (TEM), as shown in Figs. 2(c) and (d), clearly revealing the interface between Fe3O4 and the RGO. This structure assists in the attenuation of EM waves via interfacial polarization.
《Fig. 2》
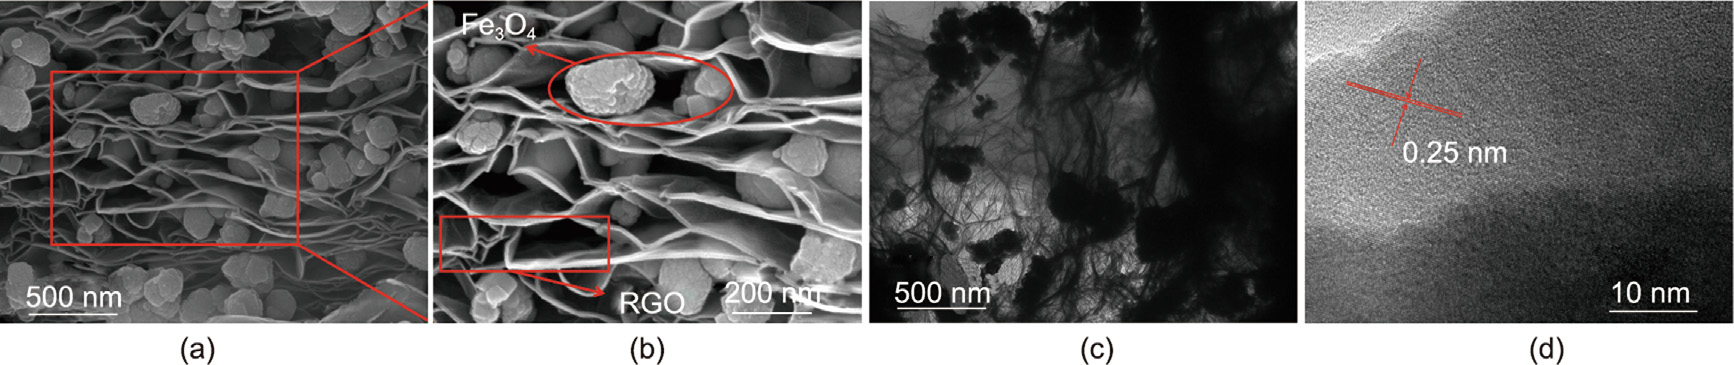
Fig. 2. (a, b) Scanning electron microscope (SEM) images of the RGO@Fe3O4 nanocomposites. (c) TEM image of the RGO@Fe3O4 nanocomposites. (d) High-resolution TEM image of the RGO@Fe3O4 nanocomposites.
《3.2. Performance of the PD-Cs》
3.2. Performance of the PD-Cs
As shown in Fig. 3, the EM parameters of the PD-Cs in the solid state at normal atmospheric temperature (NAT, 25 °C) were measured using the waveguide method. The PD-Cs with phase transition temperatures of 38, 48, and 58 °C in the solid state were named PCP#38, PCP#48, and PCP#58, respectively, based on the difference in phase transition temperature and the test results depicted in Fig. 3. When the mass fraction of the RGO@Fe3O4 nanocomposites is 15%, the EM parameters of the PD-Cs with different phase transition temperatures exhibit little difference. Moreover, both the real (ε' ) and imaginary (ε'') parts of the permittivity decrease with an increase in frequency, while the real (μ' ) and imaginary (μ'') parts of the permeability fluctuate little with increasing frequency. However, in the whole frequency band, the dielectric loss tangent (tan(ε)) of the PD-Cs is greater than 0.25 and the magnetic loss tangent (tan(μ)) is less than 0.2, indicating that electrical loss is the main EM wave loss of the PD-Cs.
《Fig. 3》

Fig. 3. EM parameters of PCP#38, PCP#48, and PCP#58. (a–c) Complex permittivity and complex permeability of (a) PCP#38, (b) PCP#48, and (c) PCP#58 (ε' and ε'' are the real and imaginary parts of the permittivity, respectively; and μ' and μ'' are the real and imaginary parts of the permeability, respectively). (d) Electrical loss tangent (tan(ε)) and magnetic loss tangent (tan(μ)) for different PD-Cs.
The phase transition behavior of the PD-Cs and of pure paraffin was detected by means of differential scanning calorimetry (DSC). For convenience, pure paraffin with phase transition temperatures of 38, 48, and 58 °C was named PC#38, PC#48, and PC#58, respectively. A thermal analysis experiment was conducted to investigate the phase transition behavior from 0 to 70 °C; all the DSC heating/cooling data were taken from the second scanning result in order to ensure the accuracy and reliability of the data. As depicted in Fig. 4, the negative heat flow indicates that the melting of pure paraffin is endothermic, while the positive heat flow indicates that its solidification is exothermic. It is noteworthy that the melting point and freezing point of the PD-Cs and paraffin wax hardly change. Based on the above results, the thermal stability of the paraffin in the process of repeated melting and solidification cycles is of great significance. Although the addition of the RGO@Fe3O4 nanocomposites leads to a reduction in the latent heat (the area surrounded by the curve and abscissa) of paraffin, it does not significantly change the phase transition temperature of the PDCs. These findings provide a new idea to control the EM response of metamaterials by changing the solid–liquid state of PD-Cs.
《Fig. 4》

Fig. 4. DSC curves of PD-Cs (PCP#38, PCP#48, and PCP#58) and pure paraffin (PC#38, PC#48, and PC#58), where the melting points of PCP#38, PCP#48, PCP#58, PC#38, PC#48, and PC#58 are 39.82, 51.88, 59.30, 39.37, 50.26, and 59.13 °C, respectively, and the freezing points are 32.91, 47.68, 56.22, 32.37, 47.37, and 56.15 °C, respectively.
The coaxial probe technique [17] was utilized to detect the complex permittivity of the PD-Cs in the liquid state; the test components are shown in Fig. 5(a). Similar to the PD-Cs in the solid state, the PD-Cs in the liquid state were defined as L-PCP#38, LPCP#48, and L-PCP#58, according to the different phase transition temperatures. The results are depicted in Figs. 5(b)–(d). Compared with the complex permittivity of the PD-Cs in the solid state, the real and imaginary parts of the PD-Cs’ permittivity in the liquid state decreased significantly, mainly due to the change in the morphology of the RGO@Fe3O4 nanocomposites in the PD-Cs in the liquid state and the solid state. It should be noted that the electrical loss tangent of the PD-Cs in the liquid state is lower than that of the PD-Cs in the solid state, which indicates that the change in the morphology of the RGO@Fe3O4 nanocomposites leads to a decline in the electrical loss performance of the PD-Cs.
《Fig. 5》

Fig. 5. (a) The upper left illustration shows PD-Cs in the solid state being tested using the waveguide; the lower right illustration shows the Agilent probe test component used to measure the permittivity of the PD-Cs in the liquid state. (b–d) EM parameters of L-PCP#38, L-PCP#48, and L-PCP#58: (b) real part of the permittivity (ε' ); (c) imaginary part of the permittivity (ε''); and (d) dielectric loss tangent (ε''/ε' ).
《3.3. Experimental and simulation results for the T-TBM 》
3.3. Experimental and simulation results for the T-TBM
In order to verify the broadband absorption and active control properties of the T-TBM, the EM absorption properties of the T-TBM at different temperatures were measured, and the EM absorption properties of the T-TBM at NAT were simulated using ANSYS HFSS 16.0 (Fig. 6). The reflection loss was measured in a microwave anechoic chamber (Fig. 6(a)). In order to control the temperature of the absorber, a heating module was placed under the T-TBM (Fig. 6(c)). Fig. 6(b) depicts the geometrical size of the T-TBM unit cell. The dimensions of the T-TBM unit were obtained from the simulation results of ANSYS HFSS 16.0. By setting the parametric of unit size, the final optimized structure size can be obtained through the optimization function of ANSYS HFSS 16.0. In order to ensure close contact between the T-TBM and the reflective metal plate in the heating module, polycarbonate bolts were used to fix the T-TBM to the plate. It should be noted that the T-TBM is an absorber with a semi-open structure, which is not only results in facile preparation, but also conducive to improving the impedance matching of its structure.
《Fig. 6》

Fig. 6. (a) Experimental setup of the T-TBM in the microwave anechoic chamber. (b) The T-TBM, which has a thickness of 7.2 mm; inset shows the cell dimensions, where a = 6.1 mm, b = 7.3 mm, c = 9.5 mm, d = 10 mm, and L = 200 mm. (c) Heating modules and the T-TBM.
3.3.1. Absorption performance of the T-TBM at NAT
The simulation and experimental results of reflection loss at NAT are shown in Fig. 7. The results show that, when the PD-Cs are at NAT (in the solid state), the reflection loss of the T-TBM is below –10 dB from 6 to 40 GHz. The effective absorption bandwidth is 34 GHz and the bandwidth at –30 dB is 4.4 GHz (14.1– 15.9 GHz, 19.9–22.5 GHz). The T-TBM has the characteristic of broadband absorption. The polycarbonate bolt and the unstructured edge region are the main sources of discrepancy between the simulation and measurement results. This is predominantly due to the change in the T-TBM’s structure caused by the polycarbonate bolts. However, such a change cannot be predicted accurately by the simulation. Similarly, the edge region of the T-TBM is an unstructured region, which does not align with the simulation requirements of an infinite periodic metamaterial. The reflection loss of the PD-Cs with different phase transition temperatures was simulated. To ensure the credibility of the contrast, the simulated PD-Cs single-layer was given the same thickness as the TTBM. The single-layer coating composed of PCP#38, PCP#48, or PCP#58 exhibited a resonant peak at only 24.8, 7.6, or 8.1 GHz, respectively (Fig. 7). However, the reflection loss did not reach –10 dB from 6 to 40 GHz. The comparison results show that the absorption performance of the unstructured PD-Cs is unsatisfactory compared with the broadband absorption of the T-TBM. Therefore, the proposed graded metamaterial structure holds potential for the manufacture of absorbers with broadband absorption.
《Fig. 7》

Fig. 7. The measured and simulated absorption properties of the T-TBM and of a single-layer coating consisting of PCP#38, PCP#48, or PCP#58 at NAT (in the solid state) from 6 to 40 GHz. Here, exp#T-TBM is the reflection loss experimental curve of the T-TBM; sim#T-TBM is the reflection loss simulation curve of the T-TBM; and sim#38, sim#48, and sim#58 respectively represent the reflection loss simulation curve of the single-layer coating of PCP#38, PCP#48, and PCP#58.
In order to study the microwave absorption mechanism of the T-TBM at NAT, the electric field intensity, magnetic field intensity, and periodic average amplitude of the power loss distribution simulated by ANSYS HFSS 16.0 were determined and are presented in Fig. 8. At the mid-point frequency of 12.5 GHz, the electric field seems to be trapped at the bottom of the metamaterial units, while the magnetic field is reflected against the middle and bottom of the metamaterial units. It can be seen that the concentration areas of the magnetic and electric field overlap in the middle of the metamaterial units. Thus, it can be concluded that both the magnetic loss and the electric loss cause overlapping distribution areas of the magnetic field and electric field, as well as a power loss overlap. The electric field and magnetic field are located at the top and bottom of the metamaterial units, respectively, when the frequency is 17.6 GHz. As the frequency is 27.1 GHz, the electric and magnetic field remain distributed at the top and bottom of the T-TBM. Furthermore, the distribution area of the electric field and the magnetic field is larger at 27.1 GHz than at 17.6 GHz. Overlap of the electric field distribution areas and power loss occur at 27.1 GHz, indicating that the main wave loss is electric loss. At 32.7 GHz, the electric field and magnetic field are concentrated in the middle of the T-TBM. In contrast, at 40 GHz, the magnetic field at the top of the T-TBM is obviously strengthened, indicating that the wave loss at the top of the T-TBM is mainly caused by the magnetic field at a high frequency. These simulation results show that, in regard to absorbing wave loss, electric loss is the main source, while the magnetic loss is more obvious at a high frequency.
《Fig. 8》

Fig. 8. Electric fields (Mag E), magnetic fields (Mag H), and volume loss density of the T-TBM units.
In order to investigate the absorption characteristics of the T-TBM, we calculated the equivalent EM parameters of each T-TBM equivalent layer using the S parameter inversion method (a detailed stratification is provided in Fig. 9(a)). The multilayer input impedance of the T-TBM was transformed into the singlelayer absorber input impedance using the transmission line theory, as shown in Fig. 9(a).  in and
  were calculated using Eqs. (1) and (2) [37,38] and the equivalent single-layer input impedance of the T-TBM (
 ) was calculated using Eqs. (3) and (4), in which n represents the nth layer.

where Z0 = 377 denotes the free space impedance, in denotes the input impedance of the nth layer of the T-TBM,  and
and  respectively denote the equivalent permittivity and permeability of the nth layer,
  denotes the attenuation constant of the nth layer,
  and
and  respectively denote the real and imaginary parts of the nth layer equivalent permittivity,
  and
and  respectively denote the real and imaginary parts of the nth layer equivalent permeability, c denotes the velocity of EM waves in free space,
  denotes the frequency of microwaves, and nd denotes the thickness of the nth layer of the T-TBM. nZ denotes the characteristic impedance of the nth layer and
  denotes the propagation constant of the nth layer. Plots of , , and
  in are shown in Fig. 9(b).
As depicted in Fig. 9(b), the attenuation constant of each layer of the T-TBM increases significantly with an increase in EM frequency. This finding indicates that the absorption capacity of each layer of the T-TBM in the high-frequency band is improved than that in the low-frequency band, which aligns with the simulated results. The main reasons for this improvement are the existence of π bond and carbon–carbon bond defects within the RGO, which convert EM energy into thermal energy when an EM wave is received by the absorber in the form of resistance loss and polarization relaxation. Furthermore, the phenomenon by which the absorption of an EM wave is caused by interfacial polarization between Fe3O4 and RGO and the Fe3O4 hysteresis resonance is also an important cause of wave loss [39]. Compared with the attenuation constant, the input impedance of each layer of the T-TBM decreases with an increase in frequency, which is mainly due to the decrease in the wave impedance caused by the increase in frequency. It is worth noting that, with an increase in the number of layers, the input impedance of the T-TBM gradually decreases and the attenuation constant gradually increases, which are conducive to the EM wave entering the T-TBM and being attenuated and lost.
In order to explain the absorption principle of the T-TBM, the equivalent single-layer input impedance ( ) of the T-TBM was determined, as shown in Fig. 9(b). It is clear that the T-TBM possesses excellent impedance matching in the low-frequency band; however, the T-TBM’s low attenuation loss ability is inadequate, given its poor microwave absorption performance. With the improvement of the attenuation performance of the T-TBM in the medium-frequency band, impedance matching becomes particularly critical, as it determines the quantity of EM waves entering the interior of the T-TBM. Based on the experimental results, we found that the T-TBM possesses a lower input impedance at 17.6 and 27.3 GHz; compared with that at other frequencies, the impedance matching at these frequencies is the worst, which corresponds to the higher value of reflection loss at the corresponding frequency point of exp#T-TBM in Fig. 7. Although the impedance matching is poor in the high-frequency band, the high attenuation ability gives the T-TBM a superior absorption loss performance.
《Fig. 9》

Fig. 9. (a) The T-TBM is divided into three layers: the first equivalent layer (n = 1), the second equivalent layer (n = 2), and the third equivalent layer (n = 3). (b)  is the input impedance of the T-TBM first equivalent layer,
  is the input impedance of the T-TBM second equivalent layer,
  is the input impedance of the T-TBM third equivalent layer, is the input impedance of the T-TBM equivalent single layer, 1αeff is the attenuation constant of the T-TBM first equivalent layer, 2αeff is the attenuation constant of the T-TBM second equivalent layer, and 3αeff is the attenuation constant of the T-TBM third equivalent layer.
The degree of optimization in the thickness direction of the metamaterial structure can be assessed by a comparison with the theoretical Rozanov limit [40]. The Rozanov bound is formulated as follows:

where ρ0 is the maximal reflection within the operating wavelength band  , and
, and  and nd denote the equivalent static permeability of layer n and the thickness of layer n, respectively. The calculation results show that the right value of the inequality (0.18) is greater than the left value of the inequality (0.098), indicating that, in the thickness direction, the T-TBM can theoretically continue to be optimized. However, it is undeniable that the size reduction in the thickness direction makes EM waves more sensitive to the size precision of the other two directions of the T-TBM, which poses a challenge for the manufacturing of the T-TBM.
3.3.2. Tuning performance of the T-TBM under different thermal conditions
The absorption response of the T-TBM at different temperatures is as excellent as that at NAT. Moreover, the regularly changing absorption response performance of the T-TBM under different thermal conditions makes it possible to actively regulate the T-TBM’s absorption. First, the thermal response of the T-TBM was measured through infrared observations (Movie S1 in Appendix A). As shown in Fig. 10, when the temperature rises to the corresponding phase transition temperature of the PD-Cs, the PD-Cs exhibit temperature retention [41], which is mainly due to the phase transition of paraffin and provides a time window for EM wave absorption regulation.
《Fig. 10》
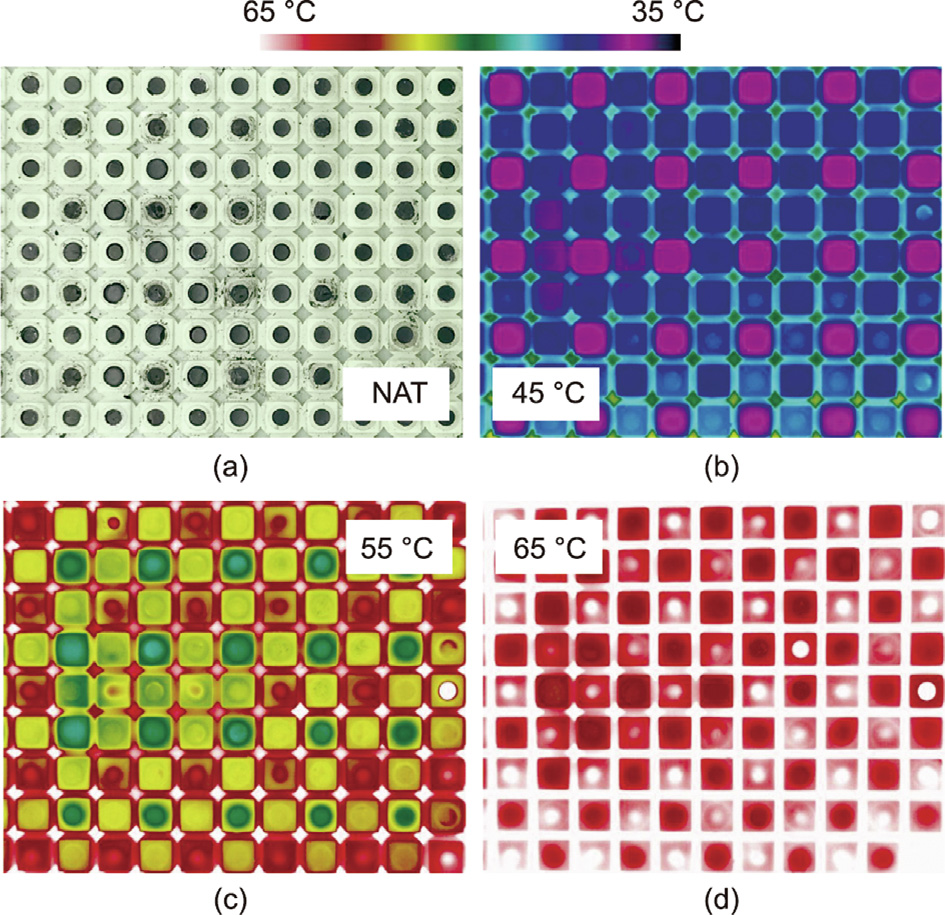
Fig. 10. Infrared observations of the T-TBM in the middle area at different temperatures: (a) NAT, (b) 45 °C, (c) 55 °C, and (d) 65 °C.
The reflection loss of the T-TBM at different ambient temperatures is shown in Fig. 11. Unlike the broadband absorption performance of the T-TBM at NAT, the absorption response of the TTBM at variable temperatures exhibits its tunable characteristics. When the PD-Cs are at an ambient temperature of 45 °C, PCP#38 is in a liquid state, while PCP#48 and PCP#58 are in a solid state. The T-TBM can achieve a reflection loss of less than –10 dB when the frequency ranges from 7.3 to 40.0 GHz, and its effective absorption bandwidth is 32.7 GHz. The bandwidth of –30 dB is 2.7 GHz (17.6–18.4 GHz, 23.1–25.0 GHz). When the PD-Cs are at an ambient temperature of 55 °C, PCP#38 and PCP#48 are in a liquid state, while PCP#58 is in a solid state. The effective absorption bandwidth (–10 dB) of the T-TBM is 32.4 GHz (7.6–40.0 GHz), and the bandwidth of –30 dB is 3.7 GHz (30.1–33.8 GHz). When the PD-Cs are at an ambient temperature of 65 °C, PCP#38, PCP#48, and PCP#58 are in a liquid state. The T-TBM can achieve a reflection loss of less than –10 dB when the frequency ranges from 8.2 to 40.0 GHz. The bandwidth of –30 dB is 5.8 GHz (27.6–33.4 GHz).
《Fig. 11》

Fig. 11. Reflection loss of T-TBM at different temperatures.
With a change in the solid–liquid state of the PD-Cs, the absorption peak and absorption bandwidth (–30 dB) of the TTBM begin to change, although the T-TBM retains the characteristics of broadband absorption. The change in the EM response of the T-TBM is closely related to its loss performance. More specifically, with an increase in the T-TBM temperature, the absorption peak gradually shifts toward a high value, and the absorption bandwidth (–30 dB) becomes wider and also shifts in the high-frequency direction. At a low frequency (6–15 GHz), with an increase in the T-TBM temperature, the reflection loss value of the T-TBM increases, and the microwave absorption performance of the T-TBM decreases. This is mainly because the PDCs possess an excellent electrical loss performance in the solid state at a low frequency. The damage of the conductive network in the PD-Cs caused by an increase in temperature leads to a decrease in the microwave absorption performance of the TTBM. It also indicates that, in this frequency band, the resistance loss of the metamaterial is dominant. At a section with high frequency (15–40 GHz), the reflection loss of the metamaterial is less than –15 dB when the frequency increases, which indicates that the relaxation loss and interface loss of the PD-Cs become the main loss sources.
In order to explain the thermal control mechanism of the TTBM, we analyzed the microstructure of the PD-Cs. First, the thin sheet of the PD-Cs was analyzed by means of cryo-TEM. As shown in Fig. 12, the RGO@Fe3O4 nanocomposites are evenly distributed in the PD-Cs and form a complex conductive network. The formation of a conductive network not only leads to the loss of EM waves by relaxation polarization and multilayer scattering but also decreases the absorption due to resistance heating.
《Fig. 12》
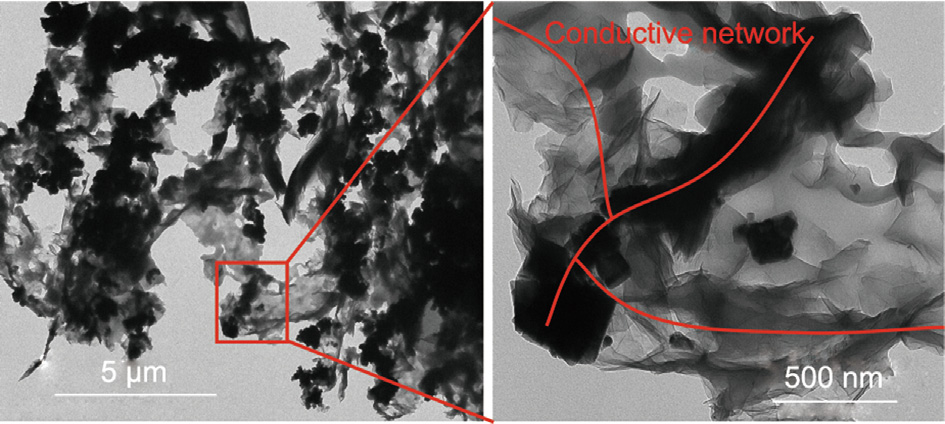
Fig. 12. Cryo-TEM images of the PD-Cs, where the thickness of the PD-Cs sheet is 500 nm.
However, with the gradual melting of the PD-Cs, the conductive network constructed by the RGO@Fe3O4 nanocomposites is destroyed, resulting in a change in the EM properties of the PDCs, as shown in Fig. 13. More specifically, the real and imaginary parts of the PD-Cs’ permittivity decrease significantly (Fig. 4), resulting in a decrease in the PD-Cs’ conductivity [12]. The molecular chain of the paraffin polymer is in a state of contraction when it is in solid state, which is conducive to the compact distribution of the RGO@Fe3O4 nanocomposites in paraffin, thereby promoting the formation of a conductive network and sandwich structure. This satiation leads to high real and imaginary parts of permittivity of the PD-Cs in the solid state. However, with the expansion of the molecular chain and an increase in the distance between the liquid paraffin molecules, the distribution of the RGO@Fe3O4 nanocomposites in paraffin becomes loose instead of compact. The destruction of the conductive network constructed by the RGO@Fe3O4 nanocomposites leads to a decrease in the EM wave loss performance of the PD-Cs, which is manifested as a decrease in the complex permittivity of the PD-Cs. This leads to degradation of the T-TBM loss performance. These changes in microstructure enable regulation of the EM absorption properties.
《Fig. 13》

Fig. 13. Microstructure of the PD-Cs in the T-TBM unit under different phase states. (a) PD-Cs in a solid state; (b) PD-Cs in a liquid state.
《4. Conclusions》
4. Conclusions
In conclusion, a T-TBM device was proposed that can regulate the EM response of the T-TBM by controlling the solid–liquid phase state of different metamaterial units. Unlike previously reported active control metamaterials, the absorption response of the T-TBM is regulated by the difference in the EM properties of the PD-Cs in different solid–liquid states. At NAT, the effective absorption bandwidth (–10 dB) is 34 GHz (6–40 GHz) and the absorption bandwidth (–30 dB) is 4.4 GHz (14.1–15.9 GHz, 19.9–22.5 GHz), according to the optimization design of the TTBM structure. By analyzing the simulation results of the electric field, magnetic field, and power loss density, we demonstrated the microwave absorption mechanism in the T-TBM and discussed the microwave absorption mechanism of the microstructure in the PD-Cs. The difference in the EM parameters of the PD-Cs under different solid–liquid states is adopted to regulate the EM wave absorption response of the T-TBM. The experimental results showed that, with a change in the phase state of the paraffin matrix composites, the absorption peak and absorption bandwidth (–30 dB) of the reflection loss shift in the direction of higher frequency, and the absorption bandwidth (–30 dB) becomes wider. Compared with traditional active control metamaterials, the T-TBM not only has a wider absorption band but also presents a more convenient way to regulate the absorption. It is predicted that the absorption band can be adjusted arbitrarily by changing the structure of the T-TBM. The proposed work can further promote the development of intelligent metamaterials and thermally controlled absorbers.
《Acknowledgments》
Acknowledgments
This study was supported by the National Natural Science Foundation of China (52003203 and 52075422), the Rapid Manufacturing Engineering Technology Research Center of Shaanxi Province (2017HBGC-06), the Youth Innovation Team of Shaanxi Universities, and the K.C. Wong Education Foundation.
《Compliance with ethics guidelines》
Compliance with ethics guidelines
Xiao-Chang Xing, Yang Cao, Xiao-Yong Tian, and Lingling Wu declare that they have no conflict of interest or financial conflicts to disclose.
《Appendix A. Supplementary data》
Appendix A. Supplementary data
Supplementary data to this article can be found online at https://doi.org/10.1016/j.eng.2022.04.028.


 京公网安备 11010502051620号


