

《1. Introduction》
1. Introduction
Polycystic ovary syndrome (PCOS) is both a reproductive and a metabolic disorder affecting 5%–10% of women of reproductive age around the world. Women with PCOS suffer from menstrual abnormalities, hirsutism, insulin resistance, metabolic syndrome, and infertility [1]. Infertility occurs in up to 80% of women with PCOS [2], due to infrequent or absent ovulation. Genetic factors play an important role in the development of PCOS, and familial aggregation studies and twin-sister studies support the heritability of PCOS [3]. So far, more than 200 candidate genes, involving sex hormones, insulin action and calcium signaling, oxidative stress, and endocytosis [4–6], have been identified by array-based genomewide association studies.
Aromatase inhibitors and selective estrogen receptor modulators are used as a first-line medical treatment to induce ovulation. However, 10%–40% of women with PCOS do not respond to the pharmacotherapy [7,8]. The poor ovulation response in infertile women with PCOS remains a significant clinical challenge. Currently, little is known about the causes of the failure of infertility treatments. There are no effective screening markers or widely utilized predictive models for selecting treatments for PCOS either.
Ovulation response might be influenced by genetic and metabolic factors and by certain clinical characteristics mediated by insulin signaling and steroidogenesis [9]. In this study, we assessed the genetic variants, metabolic signatures, and associated clinical features of anovulation in women with PCOS. We employed whole-exome plus targeted single-nucleotide polymorphism (SNP) sequencing and comprehensive metabolomics profiling to identify novel genetic variants and the associated metabolic signatures important for the ovulation response of infertility treatments.
《2. Materials and methods》
2. Materials and methods
《2.1. Study design, population, and protocol》
2.1. Study design, population, and protocol
The blood samples used in this study were derived from a prospective cohort (PCOSAct) which recruited 1000 infertile women with PCOS to receive either clomiphene or placebo with or without acupuncture [9,10], conducted at 27 hospitals between July 6, 2012, and November 18, 2014. For center, 11 and 10 sites were geographically distributed to the southern and northern China, respectively. All patients fulfilled the diagnostic criteria for PCOS according to the modified Rotterdam criteria: oligomenorrhea or amenorrhea (menstrual interval > 35 and 90 days, respectively), together with clinical (modified Ferriman–Gallwey hirsutism score ≥ 5 in Chinese population) or biochemical hyperandrogenism (total testosterone (TT) > 1.67 nmol·L–1), polycystic ovaries (> 12 follicles each, < 9 mm in diameter, or ovarian volume > 10 mL3 ), or both. The ethics committees approved the trial, and it was registered in ClinicalTrials.gov (NCT01573858) and chictr.org.cn (ChiCTR-TRC-12002081).
The PCOSAct is being carried out according to the principles of the Declaration of Helsinki and is approved by the ethics committee of the First Affiliated Hospital, Heilongjiang University of Chinese Medicine. The trial was commenced after having obtained the approval of the Ethic Committees. Participants are informed of the risks and benefits of the study, and they are allowed to voluntarily cease their participation in the study at any time for any reasons. Written consent for the use of baseline blood samples for this study was obtained from all participants.
《2.2. Whole-exome plus targeted SNP sequencing》
2.2. Whole-exome plus targeted SNP sequencing
A FlexiGene DNA kit (Qiagen, Germany) was used to extract DNA according to the manufacturer’s instructions. The integrity, concentration, and purification of the samples were determined by means of agarose gel electrophoresis. Purified genomic DNA (> 0.4 μg) was used to construct libraries and was enriched in protein-coding sequences with the QuarXeq Human Whole Exome 1.0 plus 200 K SNPs Kit (Dynege, China), according to Dynege’s manufacturer protocol↑ . Samples were subjected to sequencing on Illumina NGS systems. Raw data was processed according to the gatk4-germline-snps-indels workflow. In brief, we converted multiple pairs of inputted raw data (FASTQ files) to an unmapped BAM file using the Genome Analysis Toolkit (GATK) software v4.1.2.0 (see Section S1 in Appendix A). The quality control parameters for retaining SNPs and subjects were as follows: SNP missingness < 0.05 (before sample removal), subject missingness < 0.02, autosomal heterozygosity deviation (Fhet < 0.2), SNP missingness < 0.02 (after sample removal), difference in SNP missingness between cases and controls < 0.02, and SNP Hardy–Weinberg equilibrium (p > 1 × 10⁻⁶ ). Relatedness was calculated using identity by descent, and one of each pair of related individuals (pi_hat > 0.2) was excluded. Significant variants were further validated using independent genotyping experiments.
↑ https://www.dynege.com/.
《2.3. Metabolomic profiling》
2.3. Metabolomic profiling
Serum metabolic profiles were measured by means of ultraperformance liquid chromatography (UPLC) and were input into the Progenesis QI software (Waters, USA) for data preprocessing. After the peaks were matched, extracted, and normalized, the ions were normalized, and high-stringency hierarchical clustering and discriminant analysis was performed on all ions, according to ovulation outcome. Sparse partial least squares analysis was performed to determine the contribution value of each ion to the clustering. The inter-group separation was determined using t-tests on the normalized data. Statistically significant ions between groups were selected as candidate ions, and element matching and secondary identifications were performed. The Human Metabolome Database (HMDB) and Metaboanalyst website were used to estimate the possible contributions of the metabolites. Based on the mass fragment software attached to the Masslynx software system, the obtained compounds and the secondary mass spectrum were used as inputs. The effectiveness of the metabolites was demonstrated by means of data from pyrolysis mass spectrometry and the possibility of chemical structure cleavage. The Kyoto Encyclopedia of Genes and Genomes (KEGG) was used for analyzing metabolic pathways. The significant metabolites associated with the variants and mutations were considered to constitute the metabolic signature for ovulation and were validated with quantitative liquid chromatography-tandem mass spectrometry (LC-MS/MS) methods specific for eicosanoids (see Section S1 in the Appendix A).
《2.4. Machine learning and the predictive model》
2.4. Machine learning and the predictive model
The PCOSAct was conducted at 27 hospitals, including traditional Chinese medicine (TCM) and western medicine (WM) hospitals. In total, 612 and 367 patients were recruited from the TCM and the WM hospitals, respectively. For the machine learning, the data from TCM hospitals were used as training set and internal validation set, while the data from WM hospitals were used as external validation set although there was no significant difference between TCM and WM hospital in all the clinical outcomes. We have built predictive models for ovulation based on selective traits, with or without the polygenic risk score (PRS), significant risk genotypes, and the levels of associated metabolite signatures and their combinations. Linear regression (LR) was used to predict ovulation first; the results were then compared with the results of different algorithms, including a support vector machine (SVM), K-nearest neighbor (KNN), random forest (RF), gradient boosted decision tree (GBDT), and neural network (NN). During training, the leave-one-out cross-validation testing method was used to conduct model parameter pruning. After training, internal and external validations were conducted. All models yielded a normalized probability of ovulation ranging from 0 to 1. We assigned patients with a probability of less than 0.5 as having a low chance of ovulation; otherwise, patients were assigned as having a high chance. We ran the training and prediction tasks using the R package ‘‘caret” by setting the model parameters as ‘‘bayesglm,” ‘‘svmLinear,” ‘‘knn,” ‘‘rf,” ‘‘gbm,” and ‘‘avNNet” for the LR, SVM, KNN, RF, GBFT, and NN models, respectively. We evaluated the prediction performance of the models using the receiver operating characteristic (ROC) curve (area under the curve (AUC)), accuracy, sensitivity, specificity, positive predictive value (PPV), negative predictive value (NPV), F1 score, Cohen’s Kappa coefficient (Kappa), and Brier score. We used the ‘‘varImp” function in the ‘‘caret” R package to calculate the feature importance.
《2.5. Statistical analysis》
2.5. Statistical analysis
For the association analysis of common variants, standardized quality control, imputation, and statistical analyses were performed using Rapid Imputation for COnsortias PIpeLIne (RICOPILI) [11]. Genotype imputation was performed by means of the prephasing/imputation stepwise approach implemented in Eagle v2.3.5 [11] and Minimac3 [12] using the 1000 Genomes Phase3 Reference [13]. For the common variants analysis, the genomewide significance threshold was set at 5.0 × 10⁻⁸ . Principal components were generated for the sample, together with the third phase of the international HapMap project (HAPMAP3) sample, using EIGENSTRAT v8 [14]. For the rare variants analysis, the highquality variants marked as PASS were restricted by GATK. Variants were annotated using the Ensembl Variant Effect Predictor. We defined pathogenic variants as rare (minor allele frequency < 0.01) if they had scores for Sorting Intolerant From Tolerant (SIFT) < 0.05, Polymorphism Phenotyping v2 (PolyPhen-2) > 0.8, or Combined Annotation-Dependent Depletion (CADD) > 20. The pathogenic variants were used for single-variant and burden tests using RVTESTS [15]. The significance level was set at 5.13 × 10⁻⁷ (0.05/97453) and 2.97 × 10⁻⁶ (0.05/16804) for the single-variant and burden tests, respectively. All statistical analysis of genetic associations of the variants with the ovulation were adjusted by treatment, including acupuncture.
Clinical data were described as the mean (standard deviation (SD)) for continuous variables or as frequencies (percentages) for categorical variables. The Mann–Whitney U-test or the χ2 test was used to compare the differences between groups, while the Kruskal–Wallis test was used to compare the differences among groups. Kaplan–Meier curves were used to assess the association between time to first ovulation and risk genotype, and the mean time to ovulation was calculated. The correlations between metabolites and biochemical parameters were analyzed using Spearman’s method. A prediction model was built by means of logistic regression and then validated using deep machine learning (see Section S1 in Appendix A). A two-tailed p value of < 0.05 was defined as statistically significant, and all statistical analyses were performed in R v3.6.1.
《3. Results》
3. Results
《3.1. Study population characteristics》
3.1. Study population characteristics
A total of 979 and 936 baseline blood samples were available for genomic sequencing and metabolomic profiling, respectively (Fig. S1 in Appendix A). There were no significant differences in baseline demographic characteristics between the clomiphene and placebo groups. Ovulation (90.8% vs 66.0%, p < 0.001), conception (42.6% vs 21.6%, p < 0.001), clinical pregnancy (29.1% vs 15.1%, p < 0.001), and live birth (27.3% vs 14.3%, p < 0.001) were significantly higher in the women who received clomiphene compared with those who received a placebo (Table 1).
《Table 1》
Table 1 Baseline demographic characteristics (values are mean (SD) unless stated otherwise).
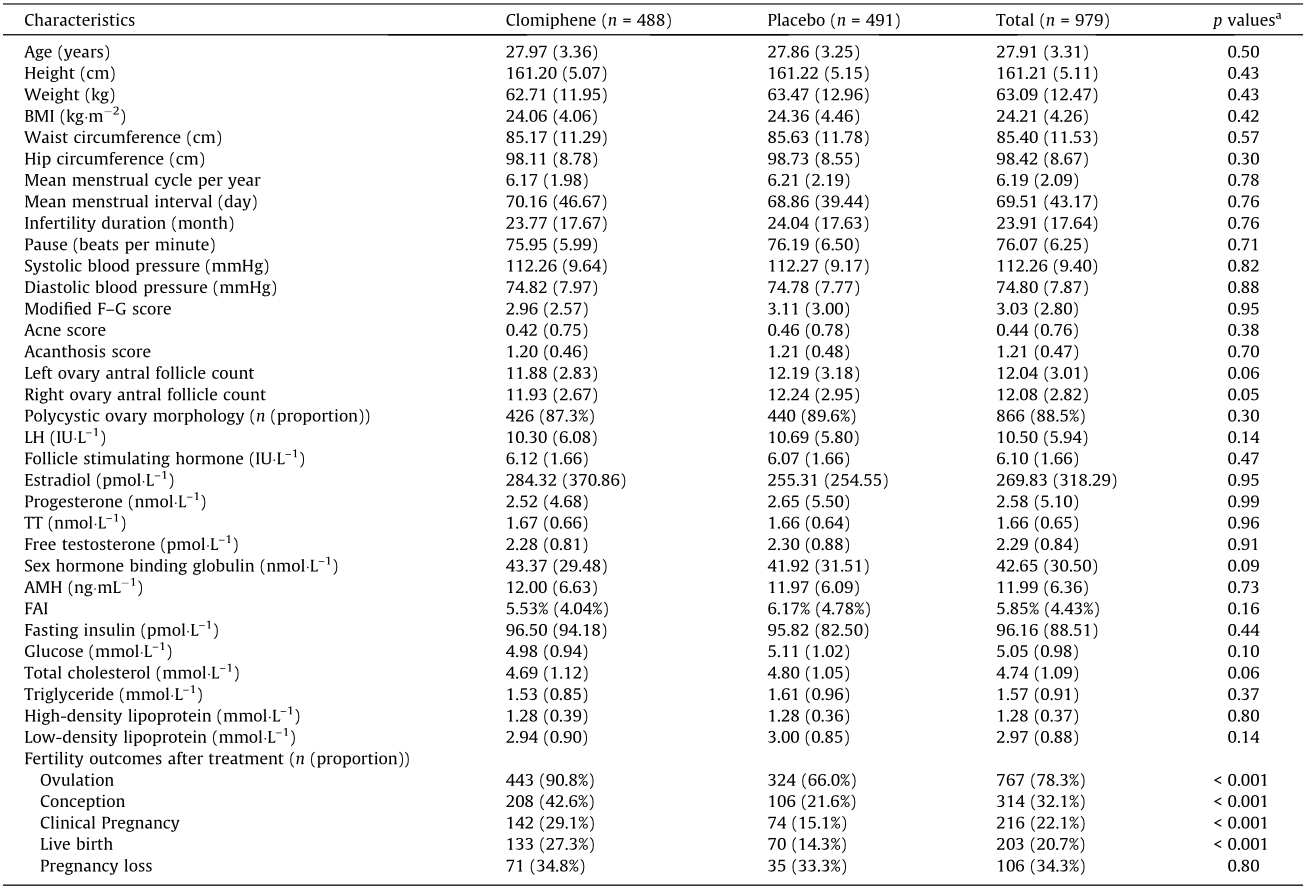
a Clomiphene vs placebo.
IU: international unit; BMI: body mass index; FAI: free androgen index; LH: luteinizing hormone; 1 mmHg = 133.3 Pa.
The genetic background of our samples was consistent with Han Chinese and Japanese populations but distinct from European and African populations (Fig. S2 in Appendix A). Two loci associated with ovulation were identified in all women, including a common variant rs2994652 at locus 10p11.23 of ZNF438 (odds ratio (OR) = 1.96 for A allele, 95% confidence interval (95%CI) = 1.55– 2.49, logistic regression p = 2.47 × 10⁻⁸) and a rare variant rs182542888 of REC114 (p.Val101Leu; OR = 11.52, 95%CI = 3.08– 43.05, score test p = 5.79 × 10⁻⁶) (Fig. 1, Fig. S3 and Tables S1–S3 in Appendix A). Another two ZNF438 variants, rs57718262 (p = 2.84 × 10⁻⁷) and rs34486207 (p = 1.16 × 10⁻⁶), were also associated with ovulation in the clomiphene and placebo groups, respectively (Figs. S4 and S5 and Table S1 in Appendix A). The risk of anovulation was 1.96- and 2.47-fold greater if any REC114 risk alleles were observed together with the ZNF438 rs2994652 risk allele in total and in the clomiphene groups, respectively (Table S4 in Appendix A). Variants associated with other pregnancy outcomes did not reach genome-wide significance.
《Fig. 1》
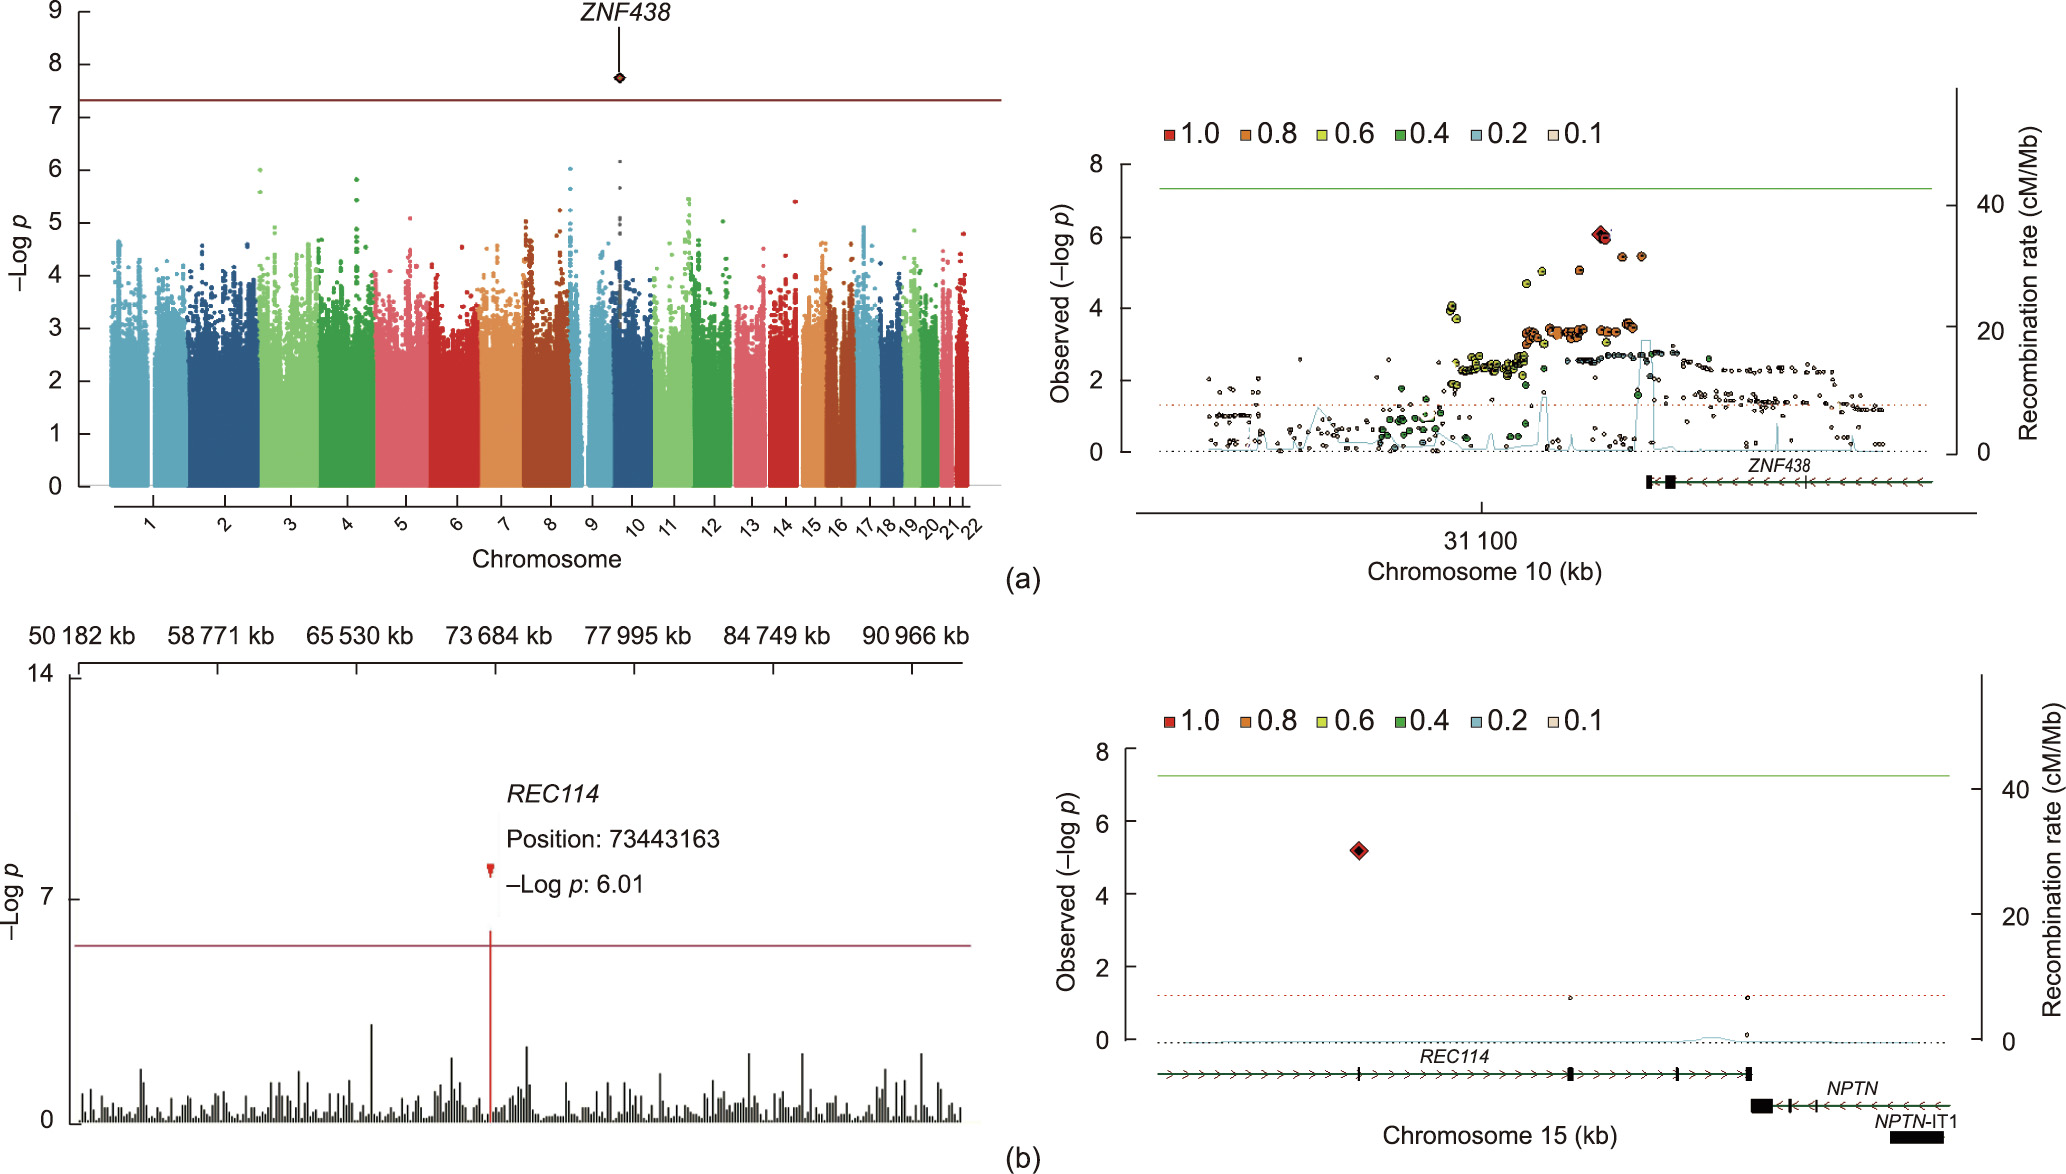
Fig. 1. Significant SNP in PCOS undergoing ovulation induction. (a) Overall Manhattan plot (left) and locus region (right, 10p11.23) of the variant ZNF438 rs2994652. (b) Overall Manhattan plot (left, chromosome 15: 50–100 Mb) and locus region (right, 15q24.1) of the rare variant REC114 rs182542888. Both variants are significantly associated with ovulation. In the Manhattan plots, the variants are indicated by gene name. For the locus region, linkage disequilibrium values are calculated based on genotypes of the merged Italian and Spanish datasets derived from Trans-Omics for Precision Medicine (TOPMed) imputation. Positions in the genome assembly hg19 are plotted. The recombination rate is shown in centimorgans (cM) per million base pairs (Mb). The plot shows the names and locations of the genes; the transcribed strand is indicated with an arrow. Genes are represented with intronic and exonic regions. The red diamond in each panel represents the variant most strongly associated with the corresponding outcomes. NPTN: neuroplastin gene. IT1: intronic transcript 1. A detailed quantile–quantile (QQ) plot and functional mutation are provided in Fig. S3 in Appendix A; detailed variant information is shown in Tables S2 and S3 in Appendix A.
《3.2. Effects of variants on the time to first ovulation》
3.2. Effects of variants on the time to first ovulation
The time to ovulation was significantly prolonged in women carrying ZNF438 rs2994652 (Fig. 2(a)) or REC114 rs182542888 (Fig. 2(b)) alleles in the total (mean = 56.7 vs 49.0 days and 78.1 vs 68.6 days, respectively), clomiphene (mean = 42.0 vs 36.1 days and 71.6 vs 39.5 days, respectively), and placebo (mean = 71.1 vs 63.5 days and 113.0 vs 68.9 days, respectively) groups, respectively, as well as for those carrying rs34486207 and rs57718262 of ZNF438 (Fig. S6 in Appendix A).
《Fig. 2》

Fig. 2. Kaplan–Meier curves of the variants on ovulation. Probability of ovulation with risk genotype (red) vs non-risk genotype (blue) after clomiphene (left) or placebo (right) treatment in different variants. Compared with the non-risk genotype, women with the variants (a) ZNF438 rs2994652 and (b) REC114 rs182542888 exhibited significantly prolonged ovulation time in both the clomiphene (mean = 42.0 vs 36.1 days and 71.6 vs 39.5 days, respectively) and placebo (mean = 71.1 vs 63.5 days and 113.0 vs 68.9 days, respectively) groups.
《3.3. Clinical features and ZNF438 protein expression》
3.3. Clinical features and ZNF438 protein expression
Women who ovulated had a lower body mass index (BMI), TT, anti-Müllerian hormone (AMH), free androgen index (FAI), and frequency of rs2994652 and rs182542888, but a higher menstrual cycle and sex hormone-binding globulin (SHBG) than anovulatory women, both overall and in the clomiphene and placebo groups (Table S5 in Appendix A). Women who ovulated also had lower systolic blood pressure, acanthosis score, fasting insulin, and triglyceride level compared with anovulatory women in the clomiphene group, whereas lower luteinizing hormone (LH) was seen in the placebo group. Both ZNF438 and REC114 protein expressions in follicles were decreased in the ovary of women with PCOS compared with healthy controls (Fig. S7 in Appendix A).
《3.4. Metabolomic profiles》
3.4. Metabolomic profiles
A group of baseline metabolites were separated based on the ovulation response in the clustering analysis (Fig. S8 in Appendix A). According to the rs2994652 and rs182542888 alleles, the phenylalanine/tyrosine/tryptophan biosynthesis pathway (hsa00400) and the arachidonic acid metabolic pathway were enriched (Figs. S9–S11 in Appendix A). The levels of L-phenylalanine, 4-hydroxyphenylpyruvic acid, indole, and 3-hydroxybenzoic acid were significantly higher in the women carrying ZNF438 variants, whereas the levels of arachidonic acids, leukotrienes, and prostaglandins were significantly lower and those of hydroperoxides were significantly higher in women carrying REC114 variants (Fig. 3). L-phenylalanine was positively associated with the Homeostatic Model Assessment for Insulin Resistance (HOMA-IR) index (r = 0.219, p = 0.049) and fasting glucose (r = 0.326, p = 0.003) but negatively associated with SHBG (r = –0.268, p = 0.015) in women carrying ZNF438 variants. The levels of leukotrienes, prostaglandins, and hydroperoxides were negatively associated with LH (r = –0.761, p = 0.011), TT (r = –0.709, p = 0.022), and AMH (r = –0.507, p = 0.013) in women carrying REC114 variants, respectively.
《3.5. Prediction models created by machine learning》
3.5. Prediction models created by machine learning
Selective clinical traits were included in the machine learning to predict ovulation (Fig. S12 in Appendix A). The logistic regression model incorporating risk genotypes and associated metabolites performed better (Fig. 4) than that incorporating the risk genotypes or their associated metabolites alone, with an AUC of 0.77, a PPV of 0.84, and a Kappa coefficient of 0.29 in the external validation (Table S6 in Appendix A). The important features for the prediction included treatment, AMH, rs2994652, menstrual cycle, BMI, rs182542888, acanthosis, smoking, modified Ferriman–Gallwey (FG) score, hydroperoxides, and menstrual interval, which were consistent with other models in the machine learning experiment (Fig. S12).
《4. Discussion》
4. Discussion
The common variant rs2994652 of ZNF438 and the rare missense mutation rs182542888 of REC114 were found to be significantly associated on a genome-wide level with no ovulation response in women with PCOS after ovulation induction. When the variant or mutation were present, both the risk of anovulation and the mean time to first ovulation were significantly increased after clomiphene treatment. Furthermore, L-phenylalanine was significantly higher in women carrying the ZNF438 variants and was positively correlated with HOMA-IR and fasting insulin, whereas arachidonic acids levels were significantly decreased in women carrying the REC114 variants and were negatively associated with TT, AMH, and LH. REC114 and ZNF438 variants are involved in insulin-resistant and androgen-excessive manifestations in PCOS, resulting in no ovulation response and failure in infertility treatment.
ZNF438 is located at 10p11.2 and is strongly expressed in the ovary of a healthy adult female [16]. ZNF438 belongs to the Krüppel Cys2His2 (C2H2) ZNF family, which is associated with metabolic disorders such as obesity, hyperlipidemia, and cardiovascular diseases [17]. Phenylalanine, which is increased in both peripheral and follicular fluid in women with PCOS [18,19], is elevated and positively linked with the HOMA-IR index in women carrying the ZNF438 variants. The phenylalanine/tyrosine/tryptophan biosynthesis pathway has been shown to contribute to insulinsignaling defects in PCOS via insulin receptor substrate phosphorylation. Insulin resistance, a core pathological feature of PCOS, involves not only anovulation in the ovary but also systematic metabolic disorders, such as obesity, hyperlipidemia, metabolic syndrome, and nonalcoholic fatty liver disease [20]. In addition to a higher frequency of ZNF438 variants, we found that anovulatory women with PCOS receiving clomiphene had a greater waist circumference, systolic blood pressure, triglyceride level, and fasting insulin level, which are the main components of metabolic syndrome. Therefore, insulin resistance in the ovary and peripheral tissues secondary to ZNF438 variants results in both poor ovulation and systematic metabolic disorders, via the phenylalanine biosynthesis pathway.
REC114 is located at 15p11.2 and is essential for DNA doublestrand break formation during meiosis [21], in addition to its role in oocyte maturation and embryonic arrest [22]. REC114 serves as a promoter and enhancer in many cellular processes, such as immune response, inflammation, and proliferation. Here, we found that decreased prostaglandin was negatively correlated with TT, whereas increased hydroperoxides were negatively correlated with AMH in women carrying REC114 variants. Elevated intrafollicular prostaglandin E2 (PGE2) mediates key ovulatory events, including cumulus expansion, follicle rupture, and oocyte release in the process of ovulation [23]. REC114 variants may contribute to oocytes failing to resume meiosis following the ovulatory surge of LH, and a decreased arachidonic acid level induces follicle maturation arrest [24], which may stimulate the antral follicles to produce more AMH and testosterone from the granulosa and theca layers. In addition, compared with healthy controls, prostaglandins such as PGE2, are significantly lower in women with PCOS and decrease after exposure to androgen but not to insulin [25]. Therefore, it is plausible that the REC114 mutation results not only in ovulation failure but also in worsened ovarian androgenesis via the arachidonic acids metabolism pathway.
Methods are still lacking for identifying women with no ovulation response before starting infertility treatment. Various clinical, endocrine, and ovarian ultrasonographic characteristics have been explored as predictors of ovarian response. However, certain biomarkers, such as FAI, are not accurately measured, which limits their use [26]; moreover, AMH, which is a marker of ovarian reserve, has poor predictive ability for ovulation when serum levels are > 7.0 ng·mL–1 , which is frequently the case in women with PCOS [27]. Recently, BMI, infertility duration, insulin and glucose levels, and hyperandrogenism have been consistently identified as predicting ovulation in cross-validation using two separated PCOS cohorts [27,28]. Given its advantages of flexibility, scalability, and ability to analyze diverse data types [29], we used machine learning to create ovulation prediction models by combining genetic and metabolic factors; in addition, the performance of the models was found to be improved as risk genotypes and associated metabolites were included. In addition to intervention, BMI, acanthosis, mF-G score, and AMH, the ZNF438 and REC114 risk genotypes were identified as the key traits of ovulation prediction. AMH and modified FG score (as an indicator of hyperandrogenism) were linked to REC114 variants, while BMI, acanthosis, and systolic blood pressure were associated with insulin resistance mediated by ZNF438 variants. Thus, REC114 and ZNF438 mutations and their relevant clinical features provide insights into the response in Han Chinese women with PCOS undergoing ovulation induction. Genetic testing for precision medicine is very popular in clinical practice, especially for cancer and some degenerative diseases. Follicle-stimulating hormone receptor (FSHR) SNPs have been explored as predictors of ovarian response, although this usage has minimal clinical potential. Based on our findings, targeted gene sequencing of the risk allele by Sanger sequencing or genotyping by polymerase chain reaction (PCR) will be a very fast and inexpensive test to identify poor responders [30], which will help to tailor personalized therapy for infertility in the future.
In this study, we focused on identifying the genetic factors of responses to treatment, based on a cohort with ovulation induction in women with PCOS. Surprisingly, instead of candidate genes for the pathomechanism of PCOS, such as FSHR and so forth, the novel risk genes ZNF438 and REC114 were found to be significant on a genome-wide level, in common variant and rare variant analyses, respectively. The identified risk genotypes and metabolites were involved in insulin signaling and androgen biosynthesis, as well as in ovulation independent of clomiphene treatment, suggesting a wider implication for other ovulation induction treatment. Nevertheless, there are still limitations in our study. First, our study had a relatively moderate sample size. However, it was based on the patient intervention cohort of a randomized trial, with treatment response for the whole exome and targeted SNP sequencing, which is different from case-control genetic studies between individuals with PCOS and healthy individuals. Second, the results might be relevant only for Han Chinese women with PCOS. Larger sample size cohorts and different study populations with medical ovulation induction might identify other relevant and population-based variants and further validate the results presented here. Third, wide spectrums of clinical presentations for this disease and absent potential important predictor may be responsible for the little improvement of predictive performance, moreover, it implies that genetic and metabolic factors, compared with clinical traitors, seem to have limited role in predicting clinical outcomes, such as FSHR polymorphisms [31].
《Fig. 3》
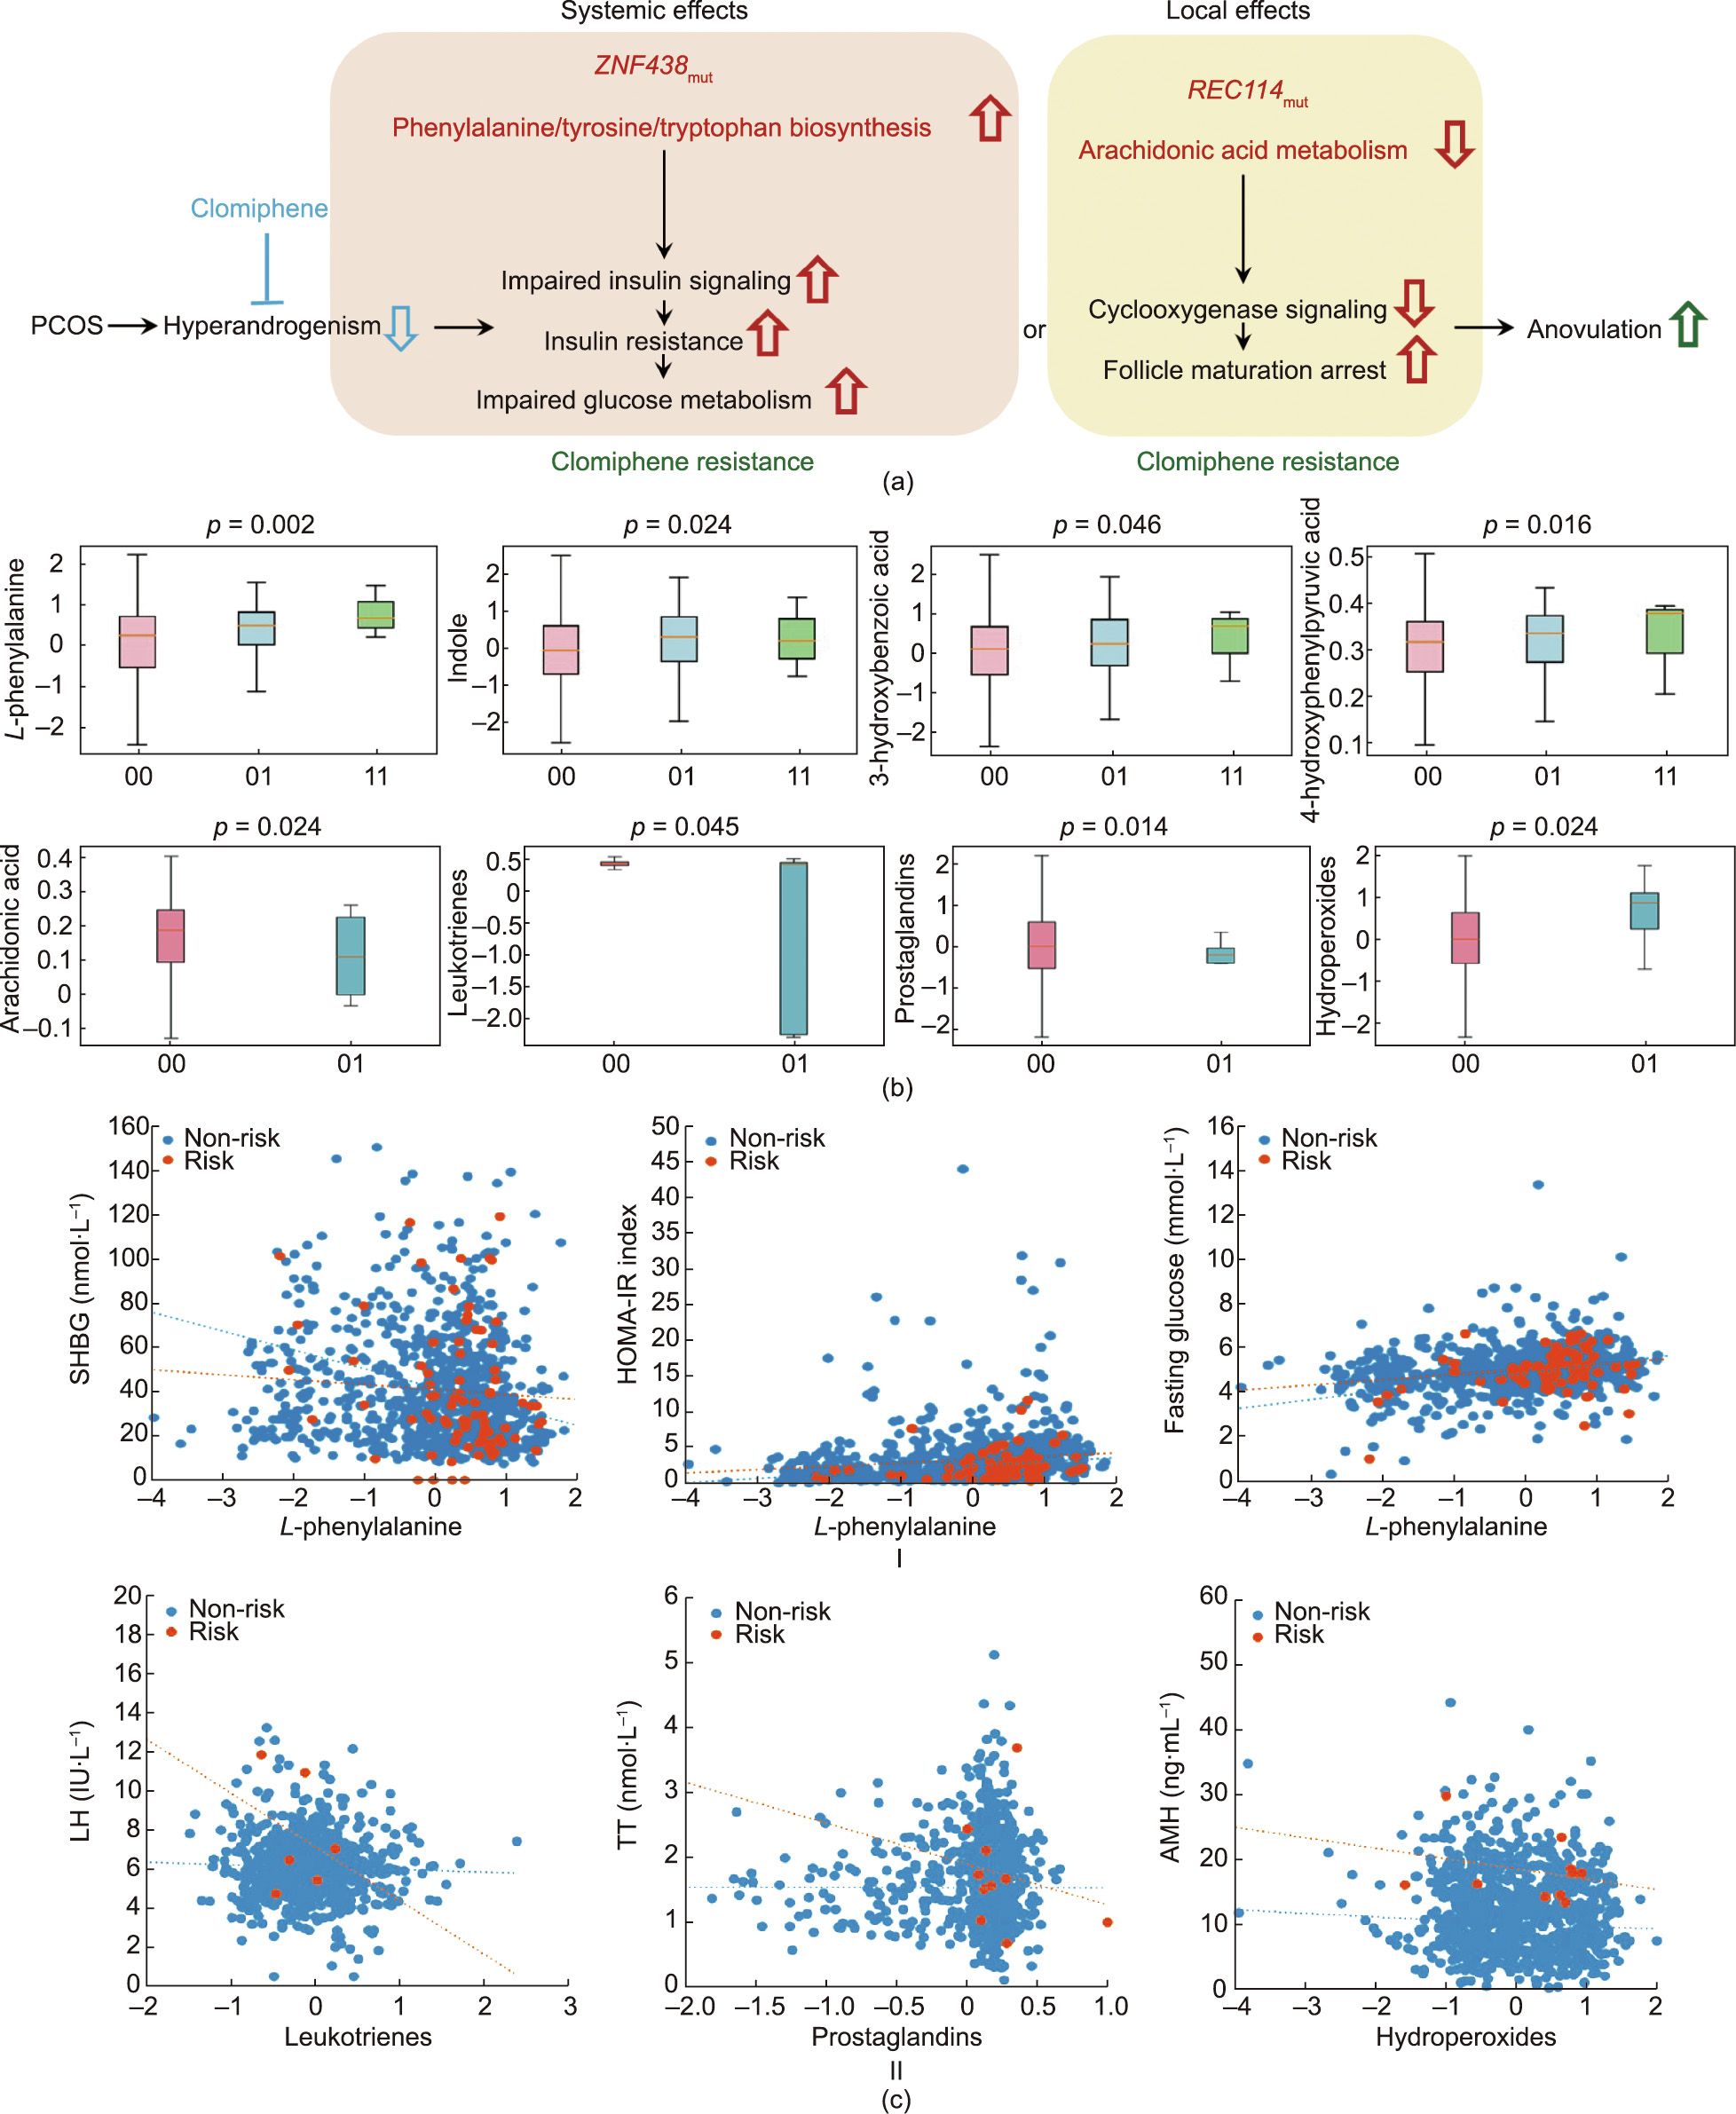
Fig. 3. Metabolic effects of ZNF438 and REC114 variants in PCOS. (a) The mechanism of clomiphene resistance and systemic effects on ovulation in PCOS with the ZNF438 and REC114 risk variants (ZNF438mut and REC114mut). (b) Quantitative levels (normalized logarithm transformed concentrations) of the significant metabolites of phenylalanine/ tyrosine/tryptophan biosynthesis pathway (L-phenylalanine) for ZNF438mut, and the arachidonic acid metabolism (arachidonic acid) for REC114mut identified by metabolomics profiling. (00: wild type (pink); 01: heterozygous (blue); 11: homozygous (green). Data presented by the box and whisker plots are the median, first, and third quartiles, and the 5th and 95th percentiles; the p values are from linear mixed modeling. Details of the metabolomics profiling and significant metabolic pathway are provided in Figs. S8–S12 in Appendix A.) (c) I. Correlation plots of L-phenylalanine concentrations (normalized logarithm transformed concentrations) with SHBG and glucose levels and the Homeostatic Model Assessment for Insulin Resistance (HOMA-IR) index in association with ZNF438 risk (orange) and non-risk (blue) genotypes, respectively. (SHBG: non-risk, r = –0.088, p = 0.012; risk, r = –0.268, p = 0.015; glucose: non-risk, r = 0.246, p = 0; risk, r = 0.326, p = 0.003; HOMA-IR: non-risk, r = 0.128, p = 0; risk, r = 0.219, p = 0.049.) II. Correlation plots of leukotrienes, prostaglandins, and hydroperoxides concentrations (normalized logarithm transformed concentrations) with LH, TT, and AMH levels in association with REC114 risk (orange) and non-risk (blue) genotypes, respectively. (Leukotrienes: non-risk, r = –0.082, p = 0.014; risk, r = –0.761, p = 0.011; prostaglandins: non-risk, r = –0.033, p = 0.325; risk, r = –0.709, p = 0.022; hydroperoxides: non-risk, r = –0.076, p = 0.022; risk, r = –0.507, p = 0.013.) The term r denotes the Spearman rank correlation coefficient; the p values are from linear mixed models.
《Fig. 4》

Fig. 4. Prediction of ovulation. (a) Different testing datasets for the prediction of ovulation in women with PCOS after treatment. Logistic regression was used to differentiate ovulation from anovulation via a combination of clinical features plus genetic factors by significant risk genotypes (SNPs, ZNF438 rs2994652, and REC114 rs182542888) and metabolic signatures by associated metabolites (L-phenylalanine, arachidonic acid, leukotrienes, prostaglandins, and hydroperoxides), with AUCs that ranged from 0.6927 (95%CI, 0.676–0.7955) to 0.7671 (95%CI, 0.7059–0.8283). (b) A comparison of AUCs, ranking, and importance of the selected risk genotypes (ZNF438 rs2994652 and REC114 rs182542888) and metabolic signature (hydroperoxides) in different models. The combined model with both factors increases the prediction values in terms of AUC, ranking, and importance. A comparison of this model with other models through the deep machine learning system for ovulation outcome is provided in Fig. S12, and detailed values of each model are shown in Table S6.
《5. Conclusions》
5. Conclusions
In conclusion, variants in two novel genes, ZNF438 and REC114, alongside the two new metabolic signatures of L-phenylalanine and arachidonic acids, contribute to the failure of infertility treatment. These findings provide a better understanding of the disease mechanism and will help to develop personalized infertility treatment for women with PCOS.
《Acknowledgments》
Acknowledgments
The authors are grateful to all staff in the PCOSAct group for their effort in the collection of blood samples and clinical dataset which used in current study. Special thanks to Prof. Attila Toth from Institute of Physiological Chemistry, Dresden, Germany for the REC114 antibody.
This study was supported by the National key Research and Development Program of China (2019YFC1709500); the National Collaboration Project of Critical Illness by Integrating Chinese Medicine and Western Medicine; the Project of Heilongjiang Province Innovation Team ‘‘TouYan;” the Yi-Xun Liu and Xiao-Ke Wu Academician Workstation; the Innovation Team of Reproductive Technique with Integrative Chinese Medicine and Western Medicine in Xuzhou City, China; Heilongjiang University of Chinese Medicine from the National Clinical Trial Base; Heilongjiang Provincial Clinical Research Center for Ovary Diseases; the Research Grant Council (T13-602/21-N, C5045-20EF, and 14122021); and Food and Health Bureau in Hong Kong, China (06171026). Ben Willem J. Mol is supported by a National Health and Medical Research Council (NHMRC) Investigator grant (GNT1176437). Ben Willem J. Mol reports consultancy for ObsEva and Merck and travel support from Merck.
《Authors’ contribution》
Authors’ contribution
Xiaoke Wu, Yongyong Shi, and Chi Chiu Wang developed the research question and designed the study. Xiaoke Wu, Yongyong Shi, Yijuan Cao, and Chi Chiu Wang designed the analysis. Yongyong Shi and Zhiqiang Li contributed to the design of the experiment of whole-exome plus targeted SNP sequencing and the analysis, and interpreted the results. Jingshu Gao, Hui Chang, Duojia Zhang, Jing Cong, Yu Wang, Qi Wu, Xiaoxiao Han, Pui Wah Jacqueline Chung, Yiran Li, and Lin Zeng contributed to the experiment of metabolic profile and immunofluorescent staining and the analysis, and interpreted the results. Astrid Borchert and Hartmut Kuhn provided antibody support and advice. Xu Zheng and Lingxi Chen contributed to create the predictive model with deep machine learning. Jian Li, Qi Wu, Hongli Ma, Xu Zheng, and Lingxi Chen contributed to the analysis of the clinical characteristics and interpreted the results. Jian Li, Hongli Ma, Hui Chang, Jing Cong, and Chi Chiu Wang drafted the manuscript. All authors reviewed and revised the manuscript. Xiaoke Wu is the guarantor of this work and, as such, had full access to all the data in the study and takes responsibility for the integrity of the data and the accuracy of the data analysis.
《Compliance with ethics guidelines》
Compliance with ethics guidelines
Xiaoke Wu, Chi Chiu Wang, Yijuan Cao, Jian Li, Zhiqiang Li, Hongli Ma, Jingshu Gao, Hui Chang, Duojia Zhang, Jing Cong, Yu Wang, Qi Wu, Xiaoxiao Han, Pui Wah Jacqueline Chung, Yiran Li, Xu Zheng, Lingxi Chen, Lin Zeng, Astrid Borchert, Hartmut Kuhn, Zijiang Chen, Ernest Hung Yu Ng, Elisabet Stener-Victorin, Heping Zhang, Richard S. Legro, Ben Willem J. Mol, and Yongyong Shi declare that they have no conflict of interest or financial conflicts to disclose.
《Appendix A. Supplementary data》
Appendix A. Supplementary data
Supplementary data to this article can be found online at https://doi.org/10.1016/j.eng.2022.08.013.


 京公网安备 11010502051620号


