
2015, Volume 1, Issue 4
Engineering >> 2015, Volume 1, Issue 4 doi: 10.15302/J-ENG-2015098
Smart Grid Wide-Area Transmission System Visualization
1 University of Illinois at Urbana-Champaign, Urbana, IL 61801, USA
2 PowerWorld Corporation, Champaign, IL 61820, USA
Next Previous
Abstract
The installation of vast quantities of additional new sensing and communication equipment, in conjunction with building the computing infrastructure to store and manage data gathered by this equipment, has been the first step in the creation of what is generically referred to as the “smart grid” for the electric transmission system. With this enormous capital investment in equipment having been made, attention is now focused on developing methods to analyze and visualize this large data set. The most direct use of this large set of new data will be in data visualization. This paper presents a survey of some visualization techniques that have been deployed by the electric power industry for visualizing data over the past several years. These techniques include pie charts, animation, contouring, time-varying graphs, geographic-based displays, image blending, and data aggregation techniques. The paper then emphasizes a newer concept of using word-sized graphics called sparklines as an extremely effective method of showing large amounts of time-varying data.
Keywords
electric power systems ; wide-area visualization ; power flow ; transient stability ; smart grid ; sparklines
Figures
Fig. 1
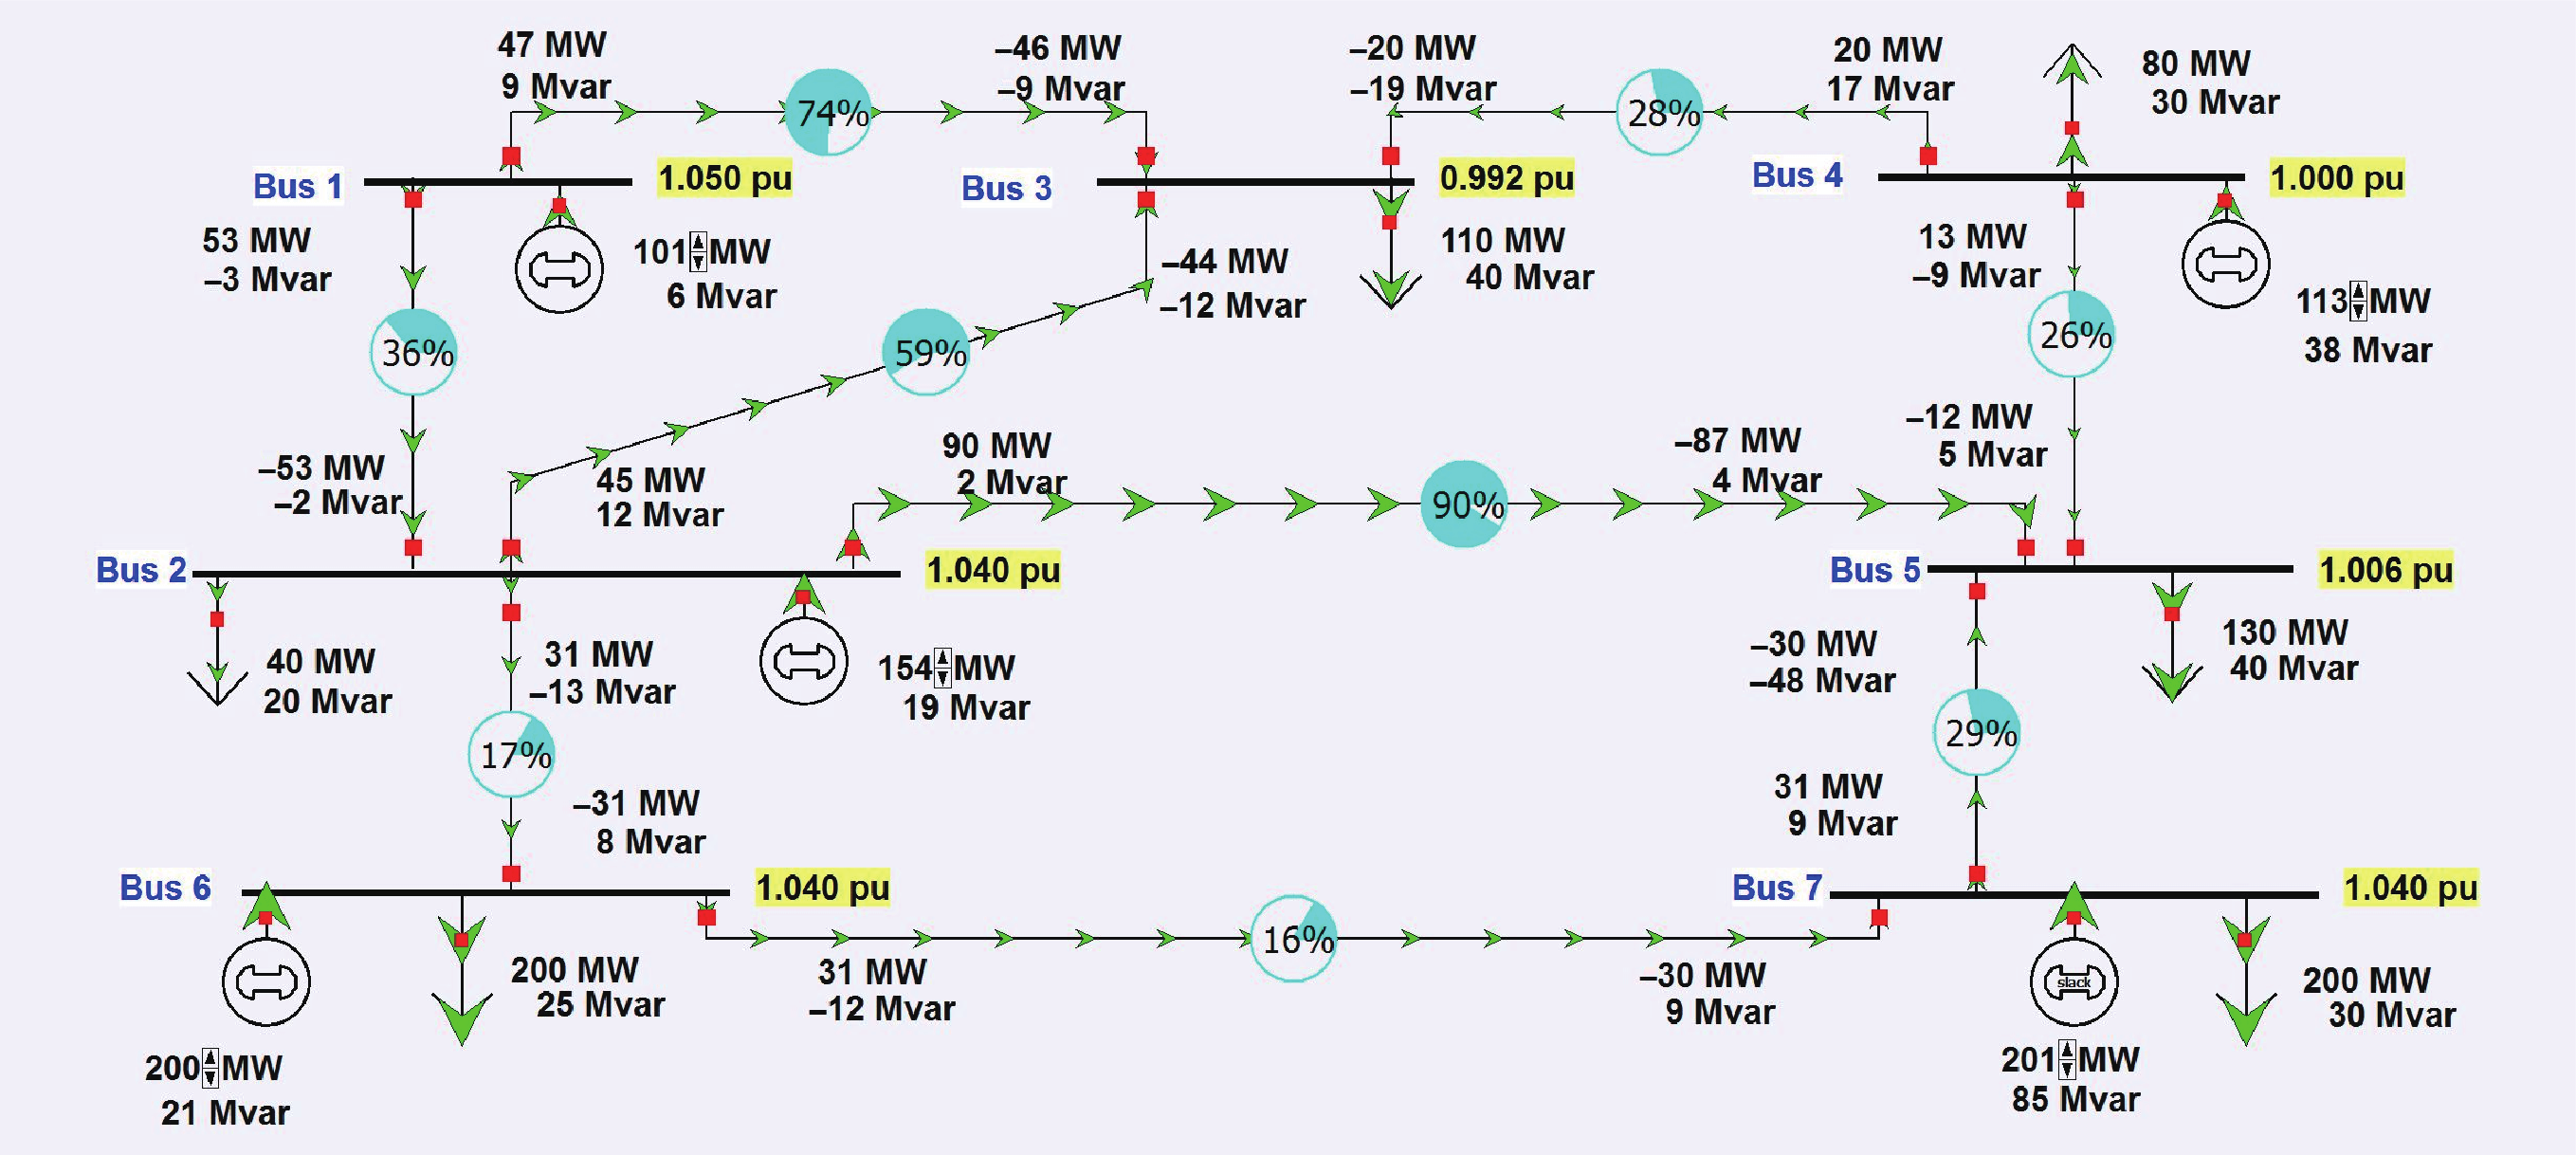
Fig. 2

Fig. 3
Fig. 4
Fig. 5
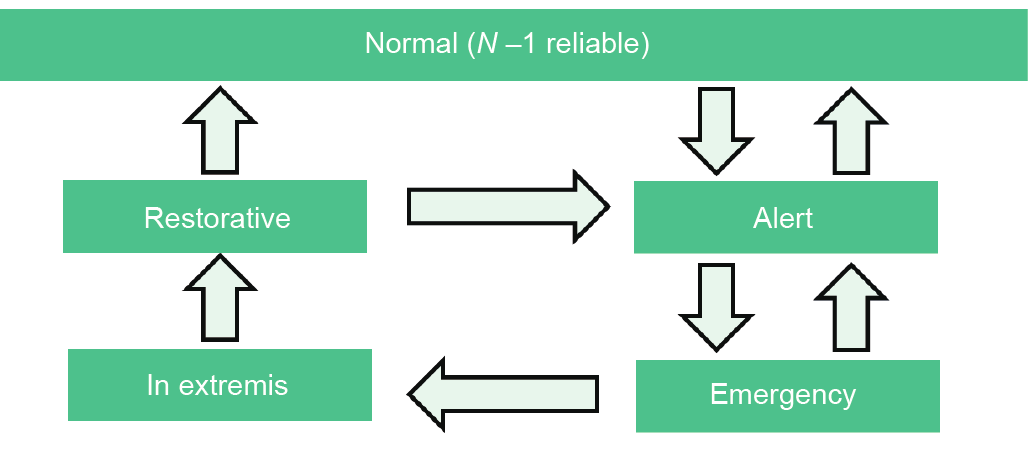
Fig. 6
Fig. 7
Fig. 8

Fig. 9

Fig. 10

Fig. 11

Fig. 12

Fig. 13
Fig. 14

Fig. 15
References
[ 1 ] National Academy of Engineering. Greatest Engineering Achievements of the 20th Century. 2015. http://www.greatachievements.org/
[ 2 ] Electric Power Research Institute. Technology assessment of power system visualization, 1017795. Palo Alto: EPRI, 2009
[ 3 ] M. Kezunovic, J. D. McCalley, T. J. Overbye. Smart grids and beyond: Achieving the full potential of electricity systems. Proc. IEEE, 2012, 100 (Special centennial issue): 1329–1341
[ 4 ] P. W. Sauer, M. A. Pai. Power System Dynamics and Stability. Champaign: Stripes Publishing, 2007
[ 5 ] T. J. Overbye, J. D. Weber. Visualization of power system data. In: Proceedings of the 33rd Annual Hawaii International Conference on System Sciences. Maui, HI, USA, 2000
[ 6 ] U.S.-Canada Power System Outage Task Force. Final report on the August 14, 2003 blackout in the United States and Canada: Causes and recommendations. Washington, D.C.: US Department of Energy, 2004
[ 7 ] F. C. Schweppe, J. Wildes. Power system static-state estimation, Part I: Exact model. IEEE Trans. Power App. Syst., 1970, PAS-89(1): 120–125
[ 8 ] PJM Operation Support Division. PJM manual 3A: Energy management system (EMS) model updates and quality assurance (QA), revision 09. Audubon: PJM, 2015
[ 9 ] A. G. Phadke, J. S. Thorp, M. G. Adamiak. A new measurement technique for tracking voltage phasors, local system frequency, and rate of change of frequency. IEEE Trans. Power App. Syst., 1983, PAS-102(5): 1025–1038
[10] Pacific Northwest National Laboratory, Electric Power Research Institute. North American SynchroPhasor Initiative homepage. 2015. https://www.naspi.org/
[11] The University of Tennessee, Oak Ridge National Laboratory. FNET/GridEye. http://powerit.utk.edu/fnet.html
[12] L. H. Fink, K. Carlsen. Power/energy: Operating under stress and strain: This, part two of the “blackout” series, defines control objectives for various levels and types of emergencies. IEEE Spectr., 1978, 15(3): 48–53
[13] J. F. Hauer, J. E. Dagle. Consortium for electric reliability technology solutions: Grid of the future white paper on review of recent reliability issues and system events, PNNL-13150. Richland: Pacific Northwest National Laboratory, 1999
[14] T. J. Overbye, D. A. Wiegmann. Reducing the risk of major blackouts through improved power system visualization. In: Proceedings of the 15th Power System Computation Conference. Liege, Belgium, 2005
[15] N. Abi-Samra, J. McConnach, S. Mukhopadhyay, B. Wojszczyk. When the bough breaks: Managing extreme weather events affecting electrical power grids. IEEE Power Energy Mag., 2014, 12(5): 61–65 link1
[16] UCTE. Final report of the investigation committee on the 28 September 2003 blackout in Italy. 2004
[17] Anon. Report on the grid disturbance on 30th July 2012 and the grid disturbance on 31st July 2012. 2012. http://www.cercind.gov.in/2012/orders/Final_Report_Grid_Disturbance.pdf
[18] Federal Energy Regulatory Commission, North American Electric Reliability Corporation. Arizona-Southern California outages on September 8, 2011: Causes and recommendations. 2012. http://www.ferc.gov/legal/staff-reports/04-27-2012-ferc-nerc-report.pdf
[19] North American Electric Reliability Corporation. High-impact, low-frequency event risk to the North American bulk power system. 2010. http://www.nerc.com/pa/CI/Resources/Documents/HILF%20Report.pdf
[20] North American Electric Reliability Corporation. 2012 special reliability assessment interim report: Effects of geomagnetic disturbances on the bulk power system. 2012. http://www.nerc.com/files/2012GMD.pdf
[21] C. D. Wickens, J. G. Hollands, S. Banbury, R. Parasuraman. Engineering Psychology and Human Performance. 4th ed. New York: Psychology Press, 2013
[22] C. Ware. Information Visualization: Perception for Design. 3rd ed. Waltham: Morgan Kaufmann, 2013
[23] J. D. Weber, T. J. Overbye. Voltage contours for power system visualization. IEEE Trans. Power Syst., 2000, 15(1): 404–409
[24] R. Klump, W. Wu, G. Dooley. Displaying aggregate data, interrelated quantities, and data trends in electric power systems. In: Proceedings of the 36th Annual Hawaii International Conference on System Sciences. Waikaloa, HI, USA, 2003: 50
[25] R. Klump, R. E. Wilson, K. E. Martin. Visualizing real-time security threats using hybrid SCADA/PMU measurement displays. In: Proceedings of the 38th Annual Hawaii International Conference on System Sciences. Poipu, HI, USA, 2005: 55c
[26] E. Tufte. Beautiful Evidence. Cheshire: Graphics Press, 2006
[27] T. J. Overbye, E. M. Rantanen, S. Judd. Electric power control center visualizations using geographic data views. In: Proceedings of 2007 iREP Symposium: Bulk Power System Dynamics and Control—VII. Revitalizing Operational Reliability. Charleston, SC, USA, 2007: 1–8
[28] S. Dutta, T. J. Overbye. Information processing and visualization of power system wide area time varying data. In: Proceedings of 2013 IEEE Symposium on Computational Intelligence Applications in Smart Grid. Singapore, 2013: 6–12
[29] S. Dutta, T. J. Overbye. Feature extraction and visualization of power system transient stability results. IEEE Trans. Power Syst., 2014, 29(2): 966–973


 京公网安备 11010502051620号


