
《1. Introduction》
1. Introduction
The coronavirus disease 2019 (COVID-19) has spread to almost all countries in the world, with more than 110 million confirmed cases as of 21 February 2021, and has killed more than 2.4 million people. COVID-19 promises to be a defining global health event of the 21st century, leading to substantial damage in terms of human lives and economic costs. At the beginning of the occurrence, countries diverged in terms of the speed, scale, and intensity with which they implemented similar interventions. Many countries, such as China and Singapore, promptly adopted preventive measures to contain the occurrence, such as isolating all cases and suspects, contact tracing, and extensive testing [1–3]. However, many other countries exhibited early negligence, or even chose the route of herd immunity, thereby causing a considerable accumulation of confirmed cases and an exceedingly high mortality rate in the pandemic’s early stage [4,5]. Having learned a hard lesson(e.g., medical resources exhausted, and mass deaths), countries such as Italy and the United Kingdom adopted measures such as city closures and curfews to keep the daily confirmed cases at affordable levels, which is a positive indication of a country maintaining prevention and control of the epidemic within its borders [6].
Studies in China, Republic of Korea, Singapore, and many European countries showed that population-level non-pharmaceutical interventions (NPIs), including school closures, physical distancing, and lockdown, have proven effective in slowing the pandemic [7]. Unfortunately, the lifting of control measures by the government and the public’s loosening of precautionary behaviors has resulted in a rise in confirmed cases and deaths. Even worse, many governments have still not done enough to curb COVID-19 ahead of its next wave, as evidenced by the still considerable number of daily new cases. Given the absence of specific antiviral prophylaxes, therapeutics, or a vaccine after the first wave of pandemic, a relaxation of NPIs points to an inevitable recurrence. If immediate and effective NPIs had not been taken to control the epidemics in those countries most at risk, the global pandemic situation would be even more severe. More people would unnecessarily die during the recurrence of the pandemic [8].
The time-varying reproduction number (R(t)) is defined as the expected number of secondary cases arising from a primary case infected at time t. (R(t)) is a critical decision-making indicator for measuring time-specific transmissibility. However, (R(t)) weakly reflects the scale of a pandemic, and the daily number of new cases is also essential for describing an epidemic situation. Therefore, we evaluated the prevention and control of the global COVID-19 pandemic and designed a time-series country-level transmission risk score (CTRS) for each country, considering both R(t) and the daily number of new confirmed cases, in order to determine the epidemic growth potential. Hierarchical clustering of CTRS was performed from 1 October 2020 to 21 February 2021 in order to visualize the global COVID-19 trend in terms of the real status of the pandemic.
《2. Methods》
2. Methods
《2.1. Source of data and data processing》
2.1. Source of data and data processing
This study used country-level daily counts of confirmed COVID19 cases from the World Health Organization (WHO) webpage↑ , accessed on 21 February 2021. Countries and territories with fewer than 1000 cumulative cases by 21 February 2021 were excluded from this study. To avoid weekly fluctuations induced by the work-leisure shift, a seven-day moving average was used to smooth the daily new case numbers by averaging the values of each day with those of the seven days before. In addition, a few countries and territories (e.g., Equatorial Guinea, Botswana, and Mauritania) exhibited an unexpectedly large variation in daily new cases that violated the transmission law of infectious diseases, probably due to insufficient nucleic acid testing capability. Therefore, we introduced a method to calculate the volatility of the daily new case numbers for each country:
↑ https://covid19.who.int/table
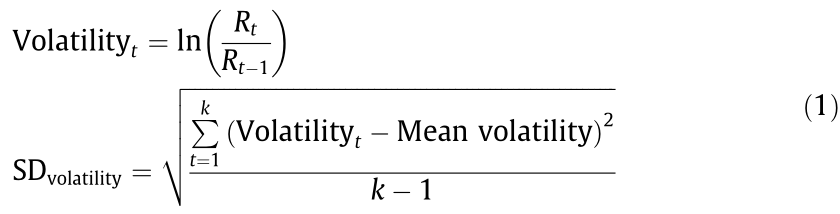
where t = 1, ..., k represents the day at evaluation, k represents the days from the emergence of the first case to the deadline of the analysis, and volatility describes the daily change in R(t) in different countries. Thus, the standard deviation of volatility (SDvolatility) represents the degree of dispersion in the daily R(t) variation. A country that exhibited an abnormal fluctuation in daily new cases and, thus, unusual variation in its R(t)—probably due to insufficient nucleic acid testing capability—was quantified by a high SDvolatility. To prevent such countries from having an impact on the classification of country-level transmission dynamics, the countries and territories with an SDvolatility within the top 10% were excluded from this analysis.
Country-specific policies on NPIs were obtained from the Oxford COVID-19 government response tracker (OxCGRT), accessed on 21 February 2021 [9]. In the OxCGRT, NPIs are grouped into the following 15 categories: eight containment and closure policies (i.e., closings of schools and universities, closings of workplaces, canceling public events, restrictions on private gatherings, closing of public transport, stay-at-home requirements, restrictions on internal movement, and restrictions on international travel) and seven health system policies (i.e., public information campaigns, nucleic acid testing policy, contact tracing policy, emergency investment in healthcare, investment in vaccines, facial coverings policy, and vaccination policy). The original variables for the containment and closure policies in the OxCGRT dataset were ordinal; for this study, we converted these NPI variables into a binary variable: ‘‘no intervention” or ‘‘recorded intervention” [10] (Table S1 in Appendix A). For countries and territories that had province- or state-level NPIs recorded in the OxCGRT (e.g., China and the United States), we first created binary NPI indicators for the states or provinces, and then obtained the country-level NPI variable by averaging the province- or state-level indicators (e.g., if half of the states in the United States introduced a school closing strategy, the status value for the school closing strategy in the United States was 0.5).
《2.2. Data analysis》
2.2. Data analysis
2.2.1. R(t) fluctuation
A serial Bayesian model was used to estimate the R(t) for each country since the beginning of the epidemic [11]. Parameters for the serial interval distribution in the model were set according to the published literature (mean = 5.2 d; SD = 1.58 d) [12].
An R(t) below 0.8 was considered to represent attenuation of the epidemic, while an R(t) above 1.2 was considered to show deterioration. A period with 11 consecutive R(t) values (double the serial interval) greater than 1.2 was considered to be the crest of the wave, whereas a period with 11 consecutive R(t) values less than 0.8 was considered to be the trough of the wave. To compare the epidemic patterns among countries, the number of crests and troughs for every country since the start of the epidemic was standardized as a number per 100 days. According to the data from before 1 October 2020, the countries and territories included in this study were categorized into the following subgroups: ‘‘never under control,” ‘‘once under control,” ‘‘once under control followed by rebound,” ‘‘rebound exceeding the previous maximum,” or ‘‘fluctuate.” According to WHO, countries and territories were divided into five regions, Americas, Europe, Southeast Asia, Eastern Mediterranean, Africa, and Western Pacific.
2.2.2. Country-level transmission risk score
We propose a CTRS to describe the country-level transmission risk of COVID-19:

where Ndaily cases,t represents the number of newly confirmed cases at day t. To simplify, the CTRS represents the log-scaled expected number of new infections produced by the current new cases during one infectious period.
2.2.3. Hierarchical clustering
To identify similarities in the epidemic patterns every six days (approximately one infectious period [12]) among the countries and territories since 1 October 2020, the countries and territories were clustered using an unsupervised cluster analysis by six-day CTRS values.
2.2.4. Alerting spreading potential
Based on the R(t) and daily new cases of the last day in our analysis period, we projected the transmission dynamics of the COVID19 epidemic for the following 12 days using a susceptible– exposed–infected–recovered (SEIR) compartments model. The parameters were as follows: the transmission rate β = R(t) ×  , in which = 5.2 d [12]; and the incubation period (1/α), which was set at 5.2 d [13]. The population size of the model was the size of each country. The initial number of cases (I0) was the total number of new cases in the five days prior to the last day in our analysis period, and the initial number of the exposed population, E0, was determined by E0 = 5.2 × Id, where Id was the number of daily new cases on the last day. The fourth-order Runge–Kutta method (RK4) was used to solve the differential equations to predict the number of daily new cases. Subsequently, the predicted number of daily new cases and the R(t) were used to estimate the time-varying CTRS values.
To validate the proposed model, 9 February 2021 was set as the last day in order to predict the number of new cases in the subsequent 12 days (i.e., from 10 February 2021 to 21 February 2021). The predicted values were tested by comparing them with the observed number of daily new cases and the actual CTRS values for the days from 10 February 2021 to 21 February 2021.
2.2.5. Assessment of non-pharmaceutical interventions
Among the 15 control measures recorded in the OxCGRT, we excluded control measures with an implementing frequency less than 5% or greater than 95%, which left the following nine control measures remaining: closings of schools and universities, closings of workplaces, canceling public events, restrictions on private gatherings, closing of public transport, stay-at-home requirements, restrictions on internal movement, contact tracing policy, and vaccination policy. To find correlations between six-day changes of CTRS and the control measures, we modeled the difference in CTRS between each day from 1 January 2021 to 21 February 2021 and the six days prior to the original day under examination (DCTRS in following equation) and the status of nine control measures in prior 30 days from the original day under examination by means of a mixed model with the following equation:
where i = 1, ..., 151 indicates the index of the involved countries and territories (as the control measures in 151 of the 166 countries and territories were recorded in the OxCGRT); j = 1, ..., 52 represents the days from 1 January to 21 February 2021; k = 1, ..., 9 denotes the index of NPIs;  represents the six-day change in CTRSj –CTRSj–6; NPIijk and bijk are the indicators of the kth NPI on the jth day of the ith country/territory and the corresponding regression coefficient, respectively; and u represents the random effect on the day and e is the residual, both of which follow the normal distribution. To better illustrate, the coefficient was transformed to 10b to reflect the ratio of next-generation cases.
《2.3. Statistical analysis》
2.3. Statistical analysis
All the analyses were performed using R software version 3.6.3 (R Foundation for Statistical Computing, Austria). The R packages EpiEstim version 2.2.3, Pheatmap version 1.0.12, and nlme version 3.1.145 were used to estimate R(t), perform hierarchical clustering, and evaluate the association between the NPIs and the change in CTRS [11,14].
《3. Results》
3. Results
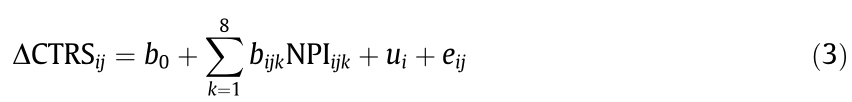
COVID-19 infection data for 206 countries and territories were obtained from the WHO website; of these, 186 countries and territories had over 1000 cumulative infections (Fig. 1). A volatility analysis of R(t) demonstrated that 18 of the 186 countries and territories had high variation in their R(t) volatility and ranked in the top 10%, probably due to insufficient nucleic acid testing capacity or resources (Fig. S1 in Appendix A). After excluding these 18 countries and territories, 168 countries and territories were retained for subsequent analysis. We then excluded two countries or territories in which the COVID-19 epidemic started later than 1 October 2020, for a final total of 166. The variation in R(t) volatility in Africa was significantly higher than that in the other regions (P < 0.0001) (Fig. S2 in Appendix A).
《Fig. 1》
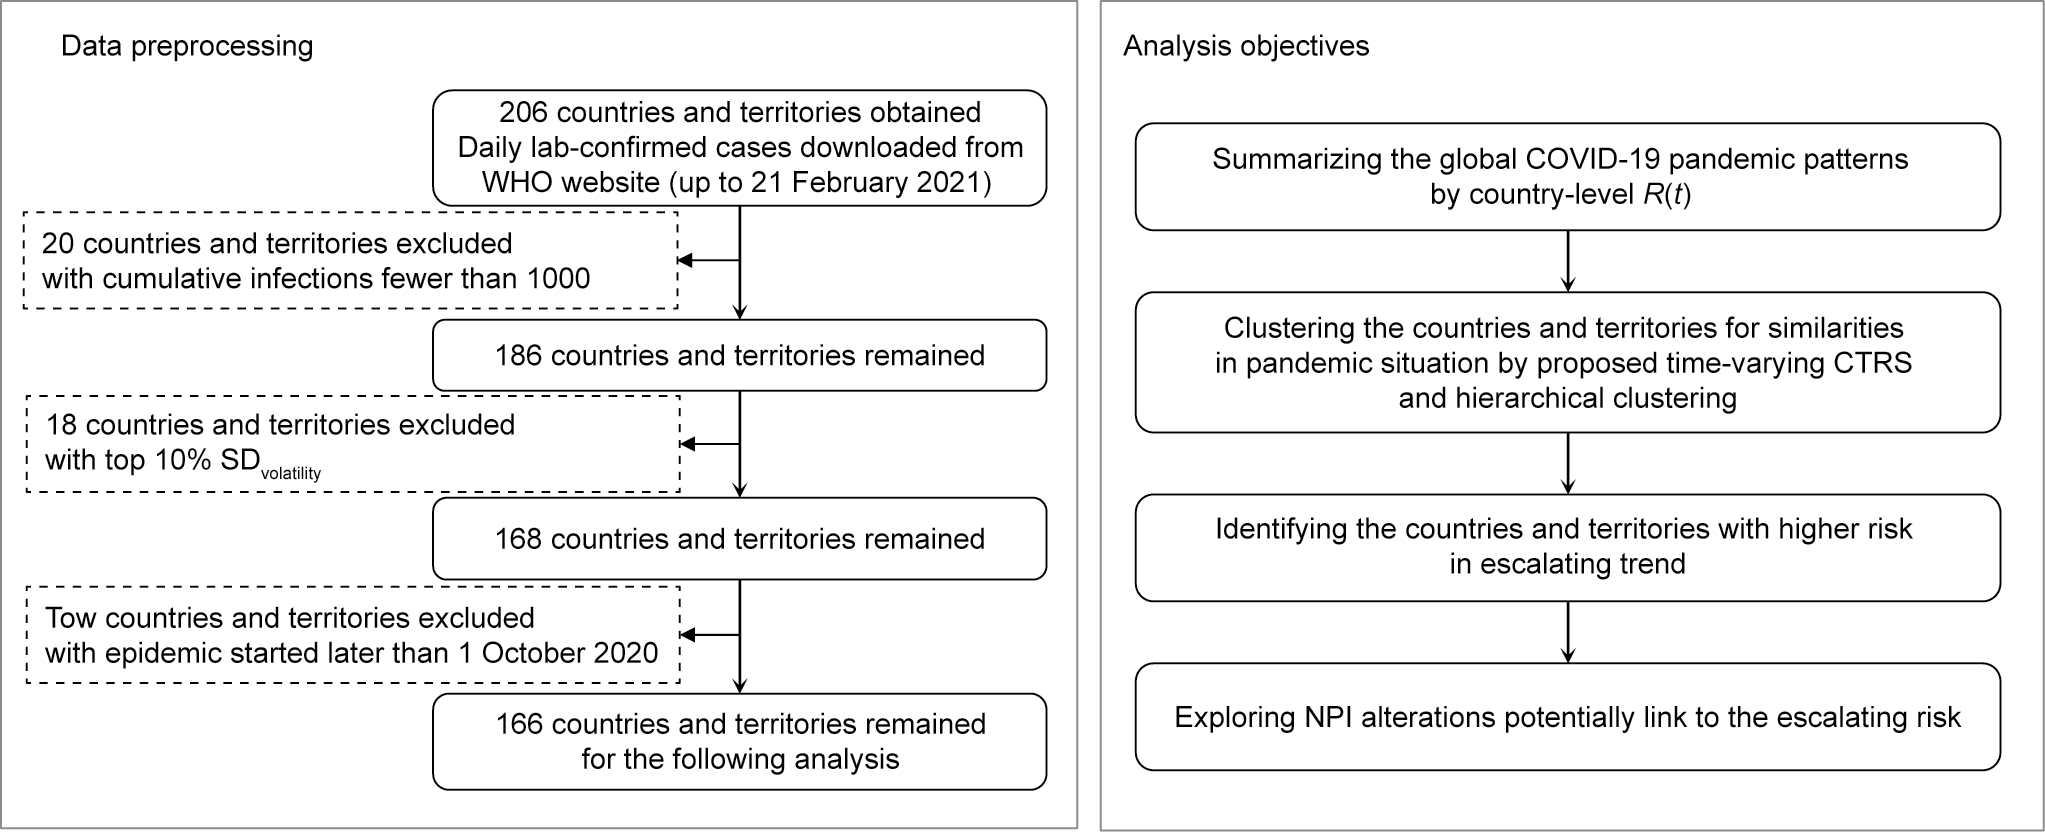
Fig. 1. Data processing and analysis workflow. CTRS indicates country-level COVID-19 transmission potential.
According to the number of crests and troughs normalized per 100 days, the 166 countries and territories were scattered and divided into low, medium, and high level of crests and troughs by tertiles of the standardized number of crests and troughs, respectively (Fig. 2(a)). In addition to the 81 countries and territories that never had the epidemic under control (e.g., the United States), six countries and territories (e.g., Austria, Tunisia, and Iceland) had high-level crests and low-level troughs, which indicated frequent epidemic resurgences without sufficient control measures. On the other hand, ten countries or territories (e.g., Sri Lanka, Jordan, and South Sudan) had high-level crests and highlevel troughs, which represented efficient containment actions against the epidemic waves. Eight countries or territories (e.g., Central African Republic, Finland, and Luxembourg) had low-level crests and high-level troughs. Furthermore, 15 countries or territories (e.g., Canada, Germany, and Italy) had low-level crests and low-level troughs, which showed overall pronounced control results against the COVID-19 pandemic. China was classified into the subset with intermediate-level crests and high-level troughs, which indicate multiple local occurrences or resurgences that were contained quickly and effectively.
《Fig. 2》
Fig. 2. Global prevention and control against COVID-19 pandemic before October 2020. The effect of global prevention and control is described by the R(t). For each country, an R(t) above 1.2 for 11 consecutive days (a period of double serial interval) is considered to be a crest of the epidemic wave. A period with 11 consecutive R(t) values less than 0.8 is considered to be the trough of the wave. The number of crests and troughs of 166 countries and territories were standardized to the number per 100 days. (a) Dark blue points represent the 81 countries and territories never had COVID-19 transmission under control. For the remaining 85 countries and territories that previously had COVID19 under control, the number of crests and troughs per 100 days was categorized by tertiles as low, middle, or high level; the two vertical and two horizontal dashed lines represent the tertiles of the number of troughs and crests, respectively. (b) The prevention and control effect was evaluated for each country and territory. The 166 countries and territories included in this study were divided into the six regions according to WHO list. The numbers in the legend box show the number of countries and territories remained in each region. The numbers on the poles of the radar plot represent the total number of countries and territories with each pattern. The proportions listed on the radar plot represent the proportion of each pattern in each region.
Global prevention and control effects were summarized and classified according to the R(t) before 1 October 2020. Of the 166 countries or territories under study, 85 with at least one trough were classified as ‘‘once under control.” Among these 85 countries or territories, 56 had rebounded records, and—even worse—28 had rebounded to a higher wave (Fig. 2(b)). It was notable that 27 of the 37 countries and territories in the Americas (73.0%), 5 of the 8 countries and territories in Southeast Asia (62.5%), 12 of the 21 countries and territories in the Eastern Mediterranean (57.1%), and 17 of the 36 countries and territories in Africa (47.2%) never had the COVID-19 pandemic under control; these values were higher than those in Europe (17 of 54 countries and territories, 31.5%) and the Western Pacific (3 of 10, 30.0%) (P = 0.0025). The Western Pacific (6 of 10, 60.0%) and Europe (30 of 54, 55.6%) had more countries and territories that rebounded with a subsequent wave that was greater than the previous wave of the epidemic than the other regions (P = 0.0001). Sensitivity analyses were also conducted, in which a period with an R(t) above 1.1 for 11 consecutive days (double the serial interval) was considered to be the crest of the epidemic wave, while a period with R(t) less than 0.9 for 11 consecutive days was considered to be the trough of the wave (Fig. S3(a) in Appendix A). In addition, the situation of a period with an R(t) above 1.3 for the crest of the epidemic wave while a period with R(t) less than 0.7 for the trough of the wave was explored as well (Fig. S3(b) in Appendix A).
Since 1 October 2020, the CTRS per day for each country or territory was estimated. In a six-day moving window (approximately one infection period), the 166 countries and territories were clustered into eight subsets according to the similarity of their sixday consecutive CTRSs; time-varying clustering of the countries and territories clearly demonstrated the country-level pandemic situation and trend from October 2020 to February 2021 (Fig. 3). First, the United States was always ranked in the highest cluster, or was the sole member of the top cluster (I in Fig. 3). Second, the increase in the global pandemic during early and middle December 2020 was probably predominantly driven by the deteriorating situations in the United States (I in Fig. 3) and Turkey (II in Fig. 3), while the aggravating epidemic in Brazil, the United Kingdom, and Russia (III in Fig. 3) further raised the global pandemic wave. Fortunately, the situations in Brazil, the United Kingdom, and Russia were quickly attenuated at the end of December 2020 and the start of January 2021 (IV in Fig. 3), in sharp contrast to the situation in the United States. In middle January 2021, a worsening pandemic situation was observed in Brazil, Spain, and the United Kingdom (V in Fig. 3), while an improving situation was observed in Czechia, Turkey, Poland, Canada, Japan, and Ireland (VI in Fig. 3). In addition, a deteriorating situation was observed in the clustering windows from 23 January 2021 to 28 January 2021: seven countries and territories, including the United States, Brazil, the United Kingdom, Spain, France, Mexico, and Russia, were grouped in the top cluster (VII in Fig. 3), and 13 countries and territories entered the second highest cluster (VIII in Fig. 3) as a result of the waning situation in countries of highest cluster. Furthermore, in the window from 29 January 2021 to 3 February 2021, the epidemics in four countries (France, Mexico, Russia, and the United Kingdom) improved, and these countries entered the second highest cluster (IX in Fig. 3). The situation in Spain also improved from 4 February 2021 to 9 February 2021, and this country entered the second highest cluster (X in Fig. 3). Poland and Malaysia also entered the second highest cluster (XI in Fig. 3). More recently, the situation in several countries and territories continued to improve. For example, in the window from 10 February 2021 to 15 February 2021, Malaysia and Portugal dropped down to the third highest cluster (XII in Fig. 3), while, from 16 February 2021 to 21 February 2021, Israel also downgraded to the third highest cluster (XIII in Fig. 3). Simultaneously, an improving situation was observed in the second highest cluster, as six countries or territories (i.e., Iraq, Ukraine, Chile, the Netherlands, Sweden, and the United Arab Emirates) entered the second highest cluster (XIV in Fig. 3). However, the United States and Brazil—which together comprise a total of 7.1% of the global population—made up the top cluster and were still in serious situations, contributing to 34.6% of the number of daily new cases worldwide during this period.
《Fig. 3》

Fig. 3. River plot illustrating country-level COVID-19 transmission waves around the world from October 2020 to February 2021. Previous clusters, which were clustered by six-day CTRS, are on the left of the blue dashed line, while future clusters are on the right. Future clusters were obtained by conducting hierarchical cluster analysis for every future six-day CTRS predicted by the SEIR model. In this figure, the deeper the red color is, the higher risk the countries and territories are. The height of each box indicates the number of countries and territories in this cluster. Key alterations of clusters are marked by Roman numerals, and the countries and territories of these alterations are listed at the bottom. At the bottom of this graph, the start date of each cluster is shown. The width of the belt between two cluster boxes represents the number of countries and territories moved from the left cluster to the right cluster.
The CTRS also has the ability to identify situations of concern regarding future risks. The method of predicting future CTRS was examined first. Using data prior to 9 February 2021, the number of daily new cases in the next 12 days (10–21 February 2021) was fitted by the SEIR model, which showed high consistency with the observed values (Pearson correlation coefficient r = 0.991, P < 0.001) (Fig. S4(a) in Appendix A). Then, CTRS values for 10– 21 February 2021 were estimated under the hypothesis that the R(t) remained unchanged since 9 February 2021; the Pearson correlation coefficient of the predicted and observed CTRS values was 0.988 (P < 0.0001) (Fig. S4(b) in Appendix A). Therefore, to explore country-level transmission trends in the near future based on data from prior to 21 February 2021, CTRS values in the subsequent 12 days (from 22 February 2021 to 5 March 2021) were estimated and were further used as inputs for country-level or territory-level hierarchical clustering. In the subsequent six days, seven countries (i.e., Argentina, Chile, Colombia, the Netherlands, Spain, Sweden, and the United Arab Emirates) dropped one grade and entered the third highest cluster (XV in Fig. 3).
To interpret the potential reasons associated with the recent alteration in the pandemic situation at the country level, NPIs in the previous 30 days were explored to evaluate their association with the six-day change in CTRS (e.g., the difference of the CTRS of the day under evaluation and the CTRS of the day 6 days prior to that day). A workplace closure policy 1–27 days prior was associated with a 6.8% (95% confidence interval (CI), 0.8%–10.5%) to 10.2% (95% CI, 5.7%–14.5%) reduction in CTRS (Fig. 4(a)). In addition, a stay-at-home requirement in the prior 1–28 days was associated with a statistically significant 3.2% (95% CI, 0.4%–7.2%) to 7.1% (95% CI, 3.8%–10.3%) reduction in CTRS (Fig. 4(b)). The other seven NPIs under study did not have a decisive effect on CTRS change. A combination of a workplace closure policy and stay-at-home requirements 30 days prior exhibited a greater and statistically significant reduction of 6.2% (95% CI, 1.0%–11.2%) to 14.6% (95% CI, 9.9%–19.2%) in the next generation of cases (Fig. 4(c)). Associations for the other NPIs are shown in Fig. S5 and Table S2 in Appendix A. Similar results were observed for the association with the 12-day change in CTRS (Figs. 4(d)–(f) and Fig. S6 in Appendix A).
《Fig. 4》
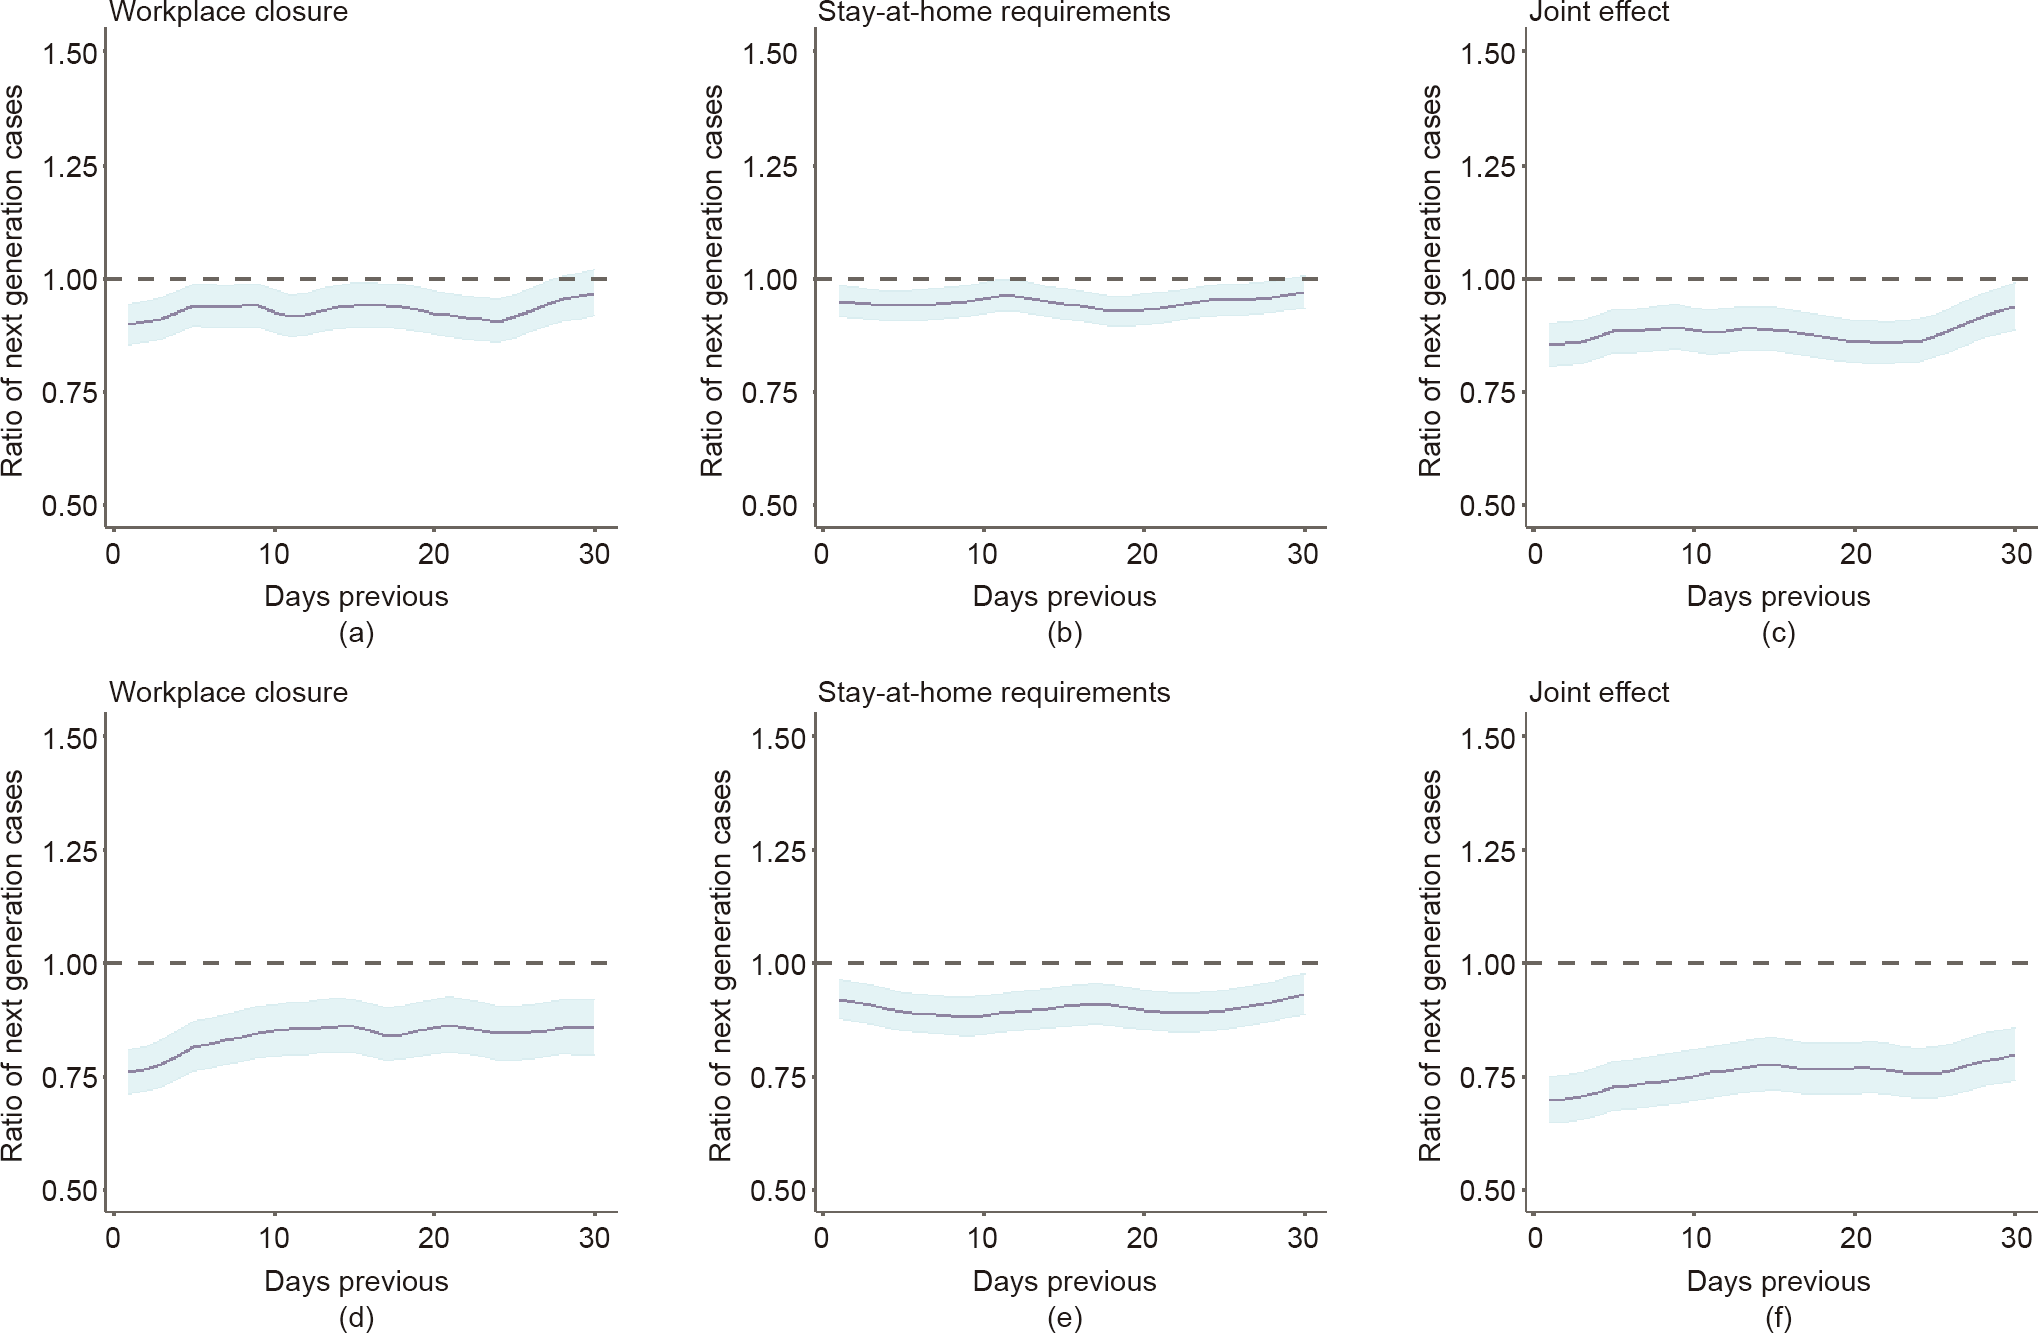
Fig. 4. Effect of workplace closure policy and stay-at-home requirements in the prior 30 days on CTRS. The six-day changes of CTRS were calculated by the difference in CTRS between each day from 1 January 2021 to 21 February 2021 and the 6 days prior to the original day under examination; similar, the 12-day changes of CTRS were calculated as well. The status of the nine control measures in prior 30 days from the original day under examination by means of a mixed model. The ratio of next generation cases indicates that introducing the specific NPI would cause a change in the next generation of cases (e.g., a ratio equals to 0.9 means that the next generation of cases would be reduced by 10% in future 6 or 12 days if the NPI was introduced on that day). The effect of a workplace closure policy, stay-at-home requirements, and the joint effect of these two NPIs on the six-day change in CTRS are shown in (a), (b), and (c), respectively. The effect of a workplace closure policy, stay-at-home requirements, and the joint effect of these two NPIs on the 12-day change in CTRS are shown in (d), (e), and (f), respectively.
《4. Discussion》
4. Discussion
To the best of our knowledge, this is the first study to classify the epidemic patterns of countries and territories worldwide. Overall, this study evaluated the pandemic situation over the first year in countries and territories across the world and identified their similarities in terms of situation and trend. The proposed method was also able to predict and monitor alterations in the country-level trend of the pandemic situation in the near future.
It was notable that 18 countries or territories were excluded due to their high variation of R(t) volatility, half of which were African countries or territories, and African countries had higher variation of R(t) volatility than other countries and territories. High variation of R(t) volatility, which is caused by large fluctuations in the number of daily newly confirmed cases, indicates a potential deficiency in nucleic acid testing capacity and other crucial medical resources. African countries and territories have limited health facilities and experience medical supply shortages in meeting community needs. On average, African countries and territories have 1.8 hospital beds and 0.9 physicians per 1000 people—far less than in Italy (4.0 physicians per 1000 people), the United States (2.6 physicians per 1000 people), or China (2.0 physicians per 1000 people) [15]. Medical supplies in Africa mainly depend on imports; during the early transmission of COVID-19, countries worldwide placed limitations on their export of supplies they deemed necessary for internally tackling COVID-19, which exacerbated resource shortages in Africa [16]. African countries and territories have conducted an average of 29 118 nucleic acid tests per one million individuals, which is far less than the number in North America (660 339 per one million people), Europe (657 773 per one million people), South America (160 837 per one million people), or Asia (127 634 per one million people) as of 21 February 2021 [17]. With an increasing capability of nucleic acid testing, there might be an increase in confirmed cases in Africa.
According to the R(t) of each country or territory, several countries and territories contained their first epidemic waves by means of quick and efficient control measures. However, among the countries and territories that once had the epidemic under control, twothirds experienced multiple subsequent rebound waves. Furthermore, half of the rebounded countries and territories experienced even higher subsequent waves that exceeded the previous scale. Even worse, 81 countries and territories (e.g., the United States) never had the COVID-19 epidemic under control in the past year, accounting for almost half of the countries and territories and 55.3% of the global population. In Europe, 68.5% of the countries and territories controlled the transmission of the first wave, but 55.6% suffered resurgences, and 22.2% had even greater subsequent waves. The relaxation of control measures is a possible reason for these findings. In the subsequent wave of the epidemic, European countries and territories appeared to have learned few lessons from their experiences during the first wave. Notably, according to our analysis, 73.0% of the countries and territories in the Americas (i.e., North, Central, and South America) had never controlled the epidemic; aside from the United States, Canada, and Brazil, these countries and territories in the Americas also warrant more attention and assistance from their neighbors [18–20].
The effective productive number R(t) represents the average number of new patients infected by one index case during an infection period [21]. Thus, the proposed statistic CTRS represents the expected number of new infections produced by the current new cases during one infectious period, and thus reveals the immediate future risk of a country. The validation process, which compared the predicted and observed time-varying CTRS, demonstrated the reliability of this score to reveal country-level or territory-level epidemic risk. Hierarchical clustering analysis using time-varying CTRS values categorized the world’s countries and territories into grades that reflected country-level or territory-level similarity in terms of COVID-19 epidemic risk and trend. Since the last quarter of 2020, the COVID-19 epidemic situation in the United States has always been ranked in the first grade. According to the OxCGRT, less than half of the states within the United States have implemented public transport closures since 1 October 2020, which may be an explanation for the high-level increase of patients in the United States. Furthermore, Brazil once entered the first grade and contributed considerably to the global increase in cases [22]. Some states in Brazil had once lifted their public transport closure strategy and restrictions on internal movement, which might be a possible reason for that one-time aggravation in Brazil. Even with a significant decrease in daily cases, the countries in the first and second highest clusters will continue to further the pandemic worldwide in the near future.
Notably, six-day changes in the global pandemic situation appeared to be associated with the introducing or lifting of a workplace closure policy and stay-at-home requirements; thus, lifting such measures may be the main cause of the observed increases in global daily new cases. Compared with introducing a workplace closure policy, lifting this measure resulted in a 6.1%–11.4% increase in the next generation of cases in a six-day period. Stayat-home requirements were also shown to be worth introducing, as they had a further influence on the pandemic situation; lifting this NPI would maximally cause a 7.6% increase in the next generation of cases within a six-day period. In addition, simultaneously introducing a workplace closure policy and stay-at-home requirements had a greater effect than either NPI individually; thus, this combination may be used as an emergency strategy to control a rapid occurrence of COVID-19. On the other hand, the other NPIs included in this study did not exhibit decisive roles in the sixday changes of CTRS, although lifting them completely could result in a devastating situation [10]. Notably, a vaccination policy had been introduced in some countries. According to our study, a vaccination policy appeared to be effective, but had a limited effect. As shown in Fig. S5(g), a vaccination policy 17–30 days prior was significantly effective in reducing new CTRS, indicating that the influence of a vaccination policy was not immediate. Detailed data are needed for a more accurate analysis of a vaccination policy.
We acknowledge the limitations of this study. First, the analyses were based on the daily newly confirmed cases for each country or territory as obtained from the WHO website. However, a series of countries with abnormal fluctuations in daily cases and an abnormal epidemic-curve, which could not reflect the actual dynamics of COVID-19, was observed, possibly due to insufficient nucleic acid testing capability. To avoid an impact on our analysis, we excluded countries within the top 10% of SDvolatility. Nevertheless, the influence of testing capability still exists. A better analysis would rely on the data of the onset information of the infections, which was not publicly accessible. Second, asymptomatic infections were not considered in this study, and patients with mild symptoms might have been unwilling to go to a clinic; both would result in underestimating the global situation. Third, because of the complex effect of prevention and control measures, the reasons underlying significant changes in countries’ and territories’ pandemic situation and trends remain unclear. Fourth, although the proposed method was demonstrated to be credible for the shortterm prediction of country-level risk, it should be generalized with caution to long-term prediction. Fifth, in this study, we only considered the impact of NPIs on CTRS change. However, weather and climate play a significant role in infectious disease transmission, through impact on host susceptibility, virus survival, and transmission dynamics. A number of studies have indicated that meteorological indicators have an impact on COVID-19 transmissibility. For example, Liu et al. [23] analyzed the association between COVID-19 cases and meteorological factors in 30 provincial capital cities of China and revealed that meteorological factors played an independent role in COVID-19 transmission after controlling for population migration. According to this study, low temperature, a mild diurnal temperature range, and low humidity likely favor transmission. Although there have been studies [24–27] supporting the absence of these correlations, meteorological factors could be important factors in global transmission dynamics and may have an interaction effect with NPIs. Sixth, the OxCGRT dataset for NPI policy records could not reflect how well the policies were implemented or enforced, which had an impact on the pandemic dynamics and thus on the evaluation of measure effectiveness. Seventh, there could be a certain threshold—which warrants exploration by a well-designed study—for decision-making to introduce or lift NPI measures, above which the epidemic would resurge.
In conclusion, after a year of development, the global COVID-19 pandemic has resulted in an unexpected situation in terms of both pandemic size and pattern. Unsynchronized epidemic waves in countries and territories overlay each other to form a steadily escalating pandemic trend worldwide rather than a global waving pattern. In addition to facing a novel and little-known virus, the limited lessons that nations have learned from each other largely contribute to the unpredictable global predicament. The proposed method and statistics, which summarize the lessons learned from countries and territories across the world, can be important for designing effective public responses to constrain future waves of COVID-19.
《Acknowledgments》
Acknowledgments
The study was supported by the National Natural Science Foundation of China (82041024 to Feng Chen, 82041026 to Hongbing Shen, and 81973142 to Yongyue Wei). This study was also partially supported by the Bill & Melinda Gates Foundation (INV-006371).
《Compliance with ethics guidelines》
Compliance with ethics guidelines
Yongyue Wei, Jinxing Guan, Xiao Ning, Yuelin Li, Liangmin Wei, Sipeng Shen, Ruyang Zhang, Yang Zhao, Feng Chen, and Hongbing Shen declare that they have no conflict of interest or financial conflicts to disclose.
《Appendix A. Supplementary data》
Appendix A. Supplementary data
Supplementary data to this article can be found online at https://doi.org/10.1016/j.eng.2021.07.015.


 京公网安备 11010502051620号


