
《1 Introduction》
1 Introduction
In 2013, when President Xi Jinping visited Central Asian and Southeast Asian countries, he proposed the Belt and Road Initiative. The Tianshan Mountain Northern Slope Economic Belt is a comprehensive economic belt that has been given priority for the development of the Belt & Road Initiative of China. Its green development shall be pivotal to the sustainability of the Belt and Road Initiative.
At present, the study of the Tianshan Mountain Northern Slope Economic Belt has begun in the field of economic development [1–3], and has been gradually followed by environmental issues, mainly issues like ecological quality [4,5], environmental carrying capacity [6,7], and urbanization [8,9]. The research on green development focuses on the industries such as food industry [10], construction industry [11], automobile industry [12], mineral industry [13], energy industry [14,15], and so on. However, studies on the green development of the Tianshan Mountain Northern Slope Economic Belt are few. Therefore, this study will evaluate the environmental performance of each economic zone from the perspectives of region and industry and propose a green development strategy for regional industries, with a view to suggesting steps for the policy support to the green development of the industries in the economic belt.
《2 Overview of region areas》
2 Overview of region areas
The Tianshan Mountain Northern Slope Economic Belt is located in the middle of the north slope of Tianshan Mountain, to the southern margin of the Junggar Basin, Xinjiang, with Urumqi, Shihezi and Karamay as its axes. According to the Xinjiang Statistical Yearbook 2015, the total output value of the Tianshan Mountain Northern Slope Economic Belt in 2014 was 638.69 billion Yuan, accounting for 68.9% of the gross output value (927.346 billion Yuan) of Xinjiang Uygur Autonomous Region (hereinafter referred to as Xinjiang). The total output values of the primary, secondary, and tertiary industries in the Tianshan Mountain Northern Slope Economic Belt were 63.299, 293.849, and 281.542 billion Yuan respectively, making up 41.1 %, 74.4 %, and 74.4 % respectively [16], of the output values of Xinjiang, as shown in Fig. 1.
《Fig. 1》
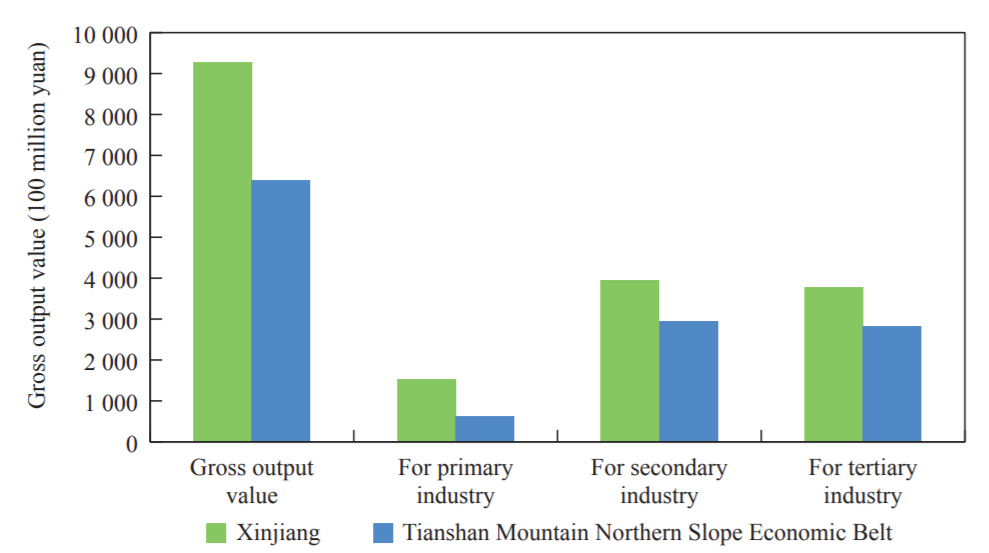
Fig. 1. Economic proportion of the Tianshan Mountain Northern Slope Economic Belt to Xinjiang in 2014.
The 12th Five-Year Plan for the National Economic and Social Development of the Xinjiang Uygur Autonomous Region divides the Tianshan Mountain Northern Slope Economic Belt into six major economic zones. They are the Urumqi–Changji Economic Zone (the Wu–Chang Economic Zone), the Turpan–Kumul Economic Zone (the Tu–Ha Economic Zone), the Shihezi–Manas– Shawan Economic Zone (the Shi–Ma–Sha Economic Zone), the Kuytun–Karamay–Wusu Economic Zone (the Kui–Ke–Wu Economic Zone), the Bortala–Jinghe–Alashankou Economic Zone (the Bo–Jing–A Economic Zone), the Gulja–Korgas–Qapqel Economic Zone (the Yi–Huo–Cha Economic Zone). The study will accordingly conduct assessment of the environmental performance of each economic zone. The 12th Five-Year Plan for National Economic and Social Development of Xinjiang Uygur Autonomous Region also defines the direction of industrial development in each economic zone, as shown in Table 1.
Table 1. Six major economic zones and leading industries of the Tianshan Mountain Northern Slope Economic Belt.
《Table 1》
The gross output values of the six major economic zones from 2011–2014 were as shown in Fig. 2. Except for the Bo– Jing–A Economic Zone, the output of which declined slightly as a result of the drop in the city’s economic activities for 2014, other economic zones have been witnessing an annual growth tendency in the gross output value.
《Fig. 2》

Fig. 2. Gross output values of each economic zone in the Tianshan Mountain Northern Slope Economic Belt from 2011–2014.
In 2014, the total industrial output values of the Wu–Chang and Kui–Ke–Wu economic zones, boasted the largest shares in the gross industrial output values of the Tianshan Mountain Northern Slope Economic Belt at 48 % and 39 % respectively, and were followed by the Tu–Ha (8 %), Yi–Huo–Cha (2 %), Shi– Ma–Sha (2 %), and Bo-Jing-A economic zones (1%).
《3 Evaluation of Environmental Performance》
3 Evaluation of Environmental Performance
ISO14031 [17] defines environmental performance as “measurable results of an organization’s management of its environmental factors.” Methods of environmental performance evaluation are usually based on eco-efficiency analysis, data envelopment analysis, and so on. Considering the coverage and maneuverability of data collection in this study, the pollutant discharge intensity has been selected as the measure to evaluate the regional and industrial environmental performance.
Based on the two dimensions of region (six major economic zones) and industry (five leading industries), the pollutant discharge per unit of economic output (gross industrial output value, industrial added value), i.e., pollutant discharge intensity is selected to evaluate the environmental performance of each economic zone in the Tianshan Mountain Northern Slope Economic Belt, and is compared with the average discharge intensities of the whole country and Xinjiang. The lower the discharge intensity, the better the environmental performance. The formula for calculating the pollutant discharge intensity is as follows:
Pollutant discharge intensity =

The environmental performance evaluation based on pollutant discharge intensity can link the environment with the economy and characterize the level of green development of regional industry. A high discharge intensity indicates that the environmental performance is poor. So, to improve the level of green industrial development, the level of pollution prevention and control must be improved through structural adjustment and process optimization and by bringing down pollutant discharge while maintaining economic development. A low discharge intensity means that the environmental performance is good and that the level of industrial green development is high.
《3.1 Analysis of Discharge》
3.1 Analysis of Discharge
Intensity of Water pollutants The discharges of major pollutants (chemical oxygen demand, ammonia nitrogen) from wastewater in China and Xinjiang in 2014 have been compared in Table 2.
《Table 2》
Table 2. Comparison of discharge of main pollutants in wastewater between China and Xinjiang.

Level of water pollutant discharge in Xinjiang is about 5 times higher than the national average level of water pollutant discharge. Hence, the generally high discharge intensity of main pollutants in the wastewater of the Tianshan Mountain Northern Slope Economic Belt is a common problem, not only because of the industrial structure, but also due to the relatively extensive development mode.
3.1.1 Chemical oxygen demand
The two economic zones with the highest discharge of Chemical Oxygen Demand (COD) in the Tianshan Mountain Northern Slope Economic Belt are the Wu-Chang (32 %) and Shi–Ma– Sha economic zones (32 %), followed by the Bo–Jing–A (20 %) and Kui–Ke–Wu economic zones (12 %), and then by the Tu–Ha (2 %) and Yi–Huo–Cha economic zones (2 %). The comparison of the discharge intensity of COD in each economic zone is shown in Fig. 3.
《Fig. 3》

Fig. 3. Comparison of the discharge intensity of chemical oxygen demand in the 6 major economic zones.
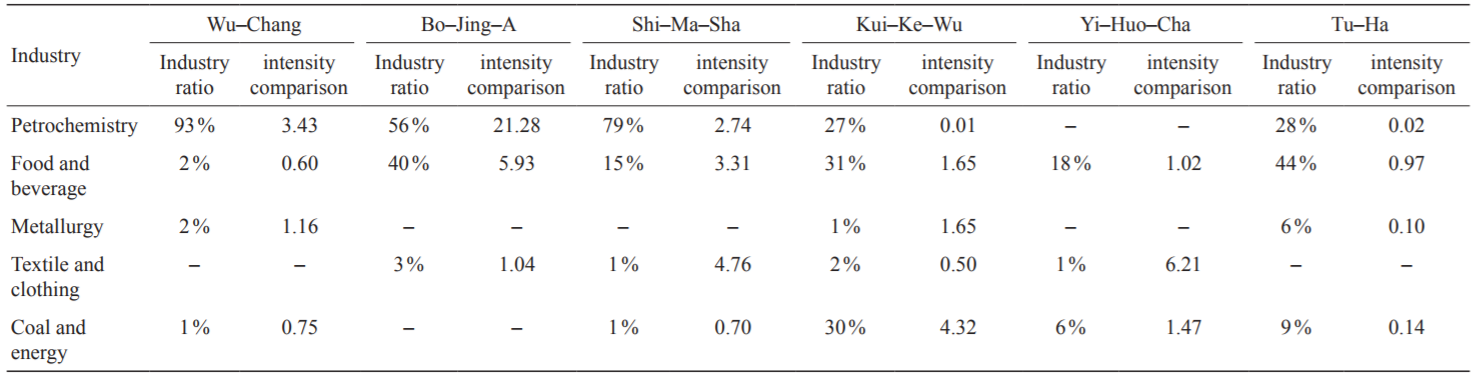
The discharge intensities of COD in the Bo–Jing–A and Shi– Ma–Sha economic zones (17.89 kg/ten thousand yuan, 9.85 kg/ ten thousand yuan) are much higher than that in other economic zones, and are also higher than the average level in Xinjiang and across the country. The main reason is that the wastewater discharge of food and beverage and petrochemical enterprises of the region is large and intense. But from the previous analysis, we know that the petrochemical industry is not a leading industry in those regions; therefore, it should be phased out in future. The ratio of the COD discharge and the discharge intensity are compared with the average level of the Tianshan Mountain Northern Slope Economic Belt as shown in Table 3.
《Table 3》
Table 3. Comparison of discharge ratio and intensity of chemical oxygen demand.

Industry ratio refers to the proportion of the pollutant discharge of leading industries to the gross pollutant discharge of the economic zone; intensity comparison refers to the specific value of pollutant discharge intensity of the industry of the economic zone to that of the industry of the Tianshan Mountain Northern Slope Economic Belt; numbers in italics indicate that they are not leading industries of this economic zone (same hereunder).
This study focuses on identifying two types of industries. The first type is the “non-dominant, high-intensity” industry. It is not the leading industry in the economic zone, but has a high pollutant discharge intensity in the economic zone, for example, the petrochemical industry in the Shi–Ma–Sha Economic Planning Area and the Bo–Jing–A Economic Zone and the food and beverage industry in the Kui–Ke–Wu Economic Zone. Such industries should be phased out in an orderly manner during future development. The second type is the “dominant, low-intensity” industry. It is a leading industry and its discharge intensity in the economic zone is lower than the average level of the Tianshan Mountain Northern Slope Economic Belt, such as the petrochemical industry in the Kui–Ke–Wu Economic Zone and the petrochemical industry and the coal and energy supply industry in the Tu-Ha Economic Zone. Development of such industries in the near future should be a priority; efforts have to be poured in to promote and popularize advanced technology and management concepts in these industries. They can then leading examples of industrial green development.
3.1.2 Ammonia nitrogen
The Wu–Chang Economic Zone shows a trend of monopoly in ammonia nitrogen discharge since it accounts for 87 % of the discharge from the Tianshan Mountain Northern Slope Economic Belt, followed by the Shi–Ma–Sha Economic Zone (6%), and so on. The ammonia nitrogen discharge intensity from four major economic zones, namely, Bo–Jing–A, Shi–Ma–Sha, Wu–Chang, and Yi–Huo–Cha are much higher than the national average, while the Kui–Ke–Wu and Tu–Ha Economic Zones are lower than the national average level, as shown in Fig. 4.
《Fig. 4》

Fig. 4. Comparison of ammonia nitrogen discharge intensity in 6 major economic zones.
The ammonia-nitrogen discharge of the two petrochemical industries of the Bo–Jing–A Economic Zone accounts for 56 % of the gross discharge in this economic zone. Therefore, from the perspective of reduction of ammonia-nitrogen discharge, the Bo– Jing–A Economic Zone shall take into consideration the orderly phasing out of the petrochemical industry. The comparison of ammonia-nitrogen discharge ratio and intensity with the average level of the industries in the Tianshan Mountain Northern Slope Economic Belt is shown in Table 4.
《Table 4》
Table 4. Comparison of ammonia-nitrogen discharge ratio and intensity.
From the point of view of ammonia-nitrogen discharge, the industries that belong to the “non-dominant, high-intensity” industry group are the petrochemical industries in the Bo–Jing– A and Shi–Ma–Sha Economic Zones and the food and beverage and the coal and energy supply industries in the Kui–Ke–Wu Economic Zone; they should all be phased out. The control of ammonia nitrogen pollution in the Kui–Ke–Wu and Tu–Ha Economic Zones is quite proficient for the petrochemical industry (87 %), a key industry producing ammonia-nitrogen discharge. So, it should be developed first, using high-level technology and management, and then popularized.
《3.2 Discharge Intensity Analysis of Atmospheric Pollutants》
3.2 Discharge Intensity Analysis of Atmospheric Pollutants
Discharge of major pollutants (sulfur dioxide, nitrogen oxide) from the nation and Xinjiang in 2014 have been compared as shown in Table 5.
《Table 5》
Table 5. Comparison of discharge of major pollutants in exhaust gas between China and Xinjiang

The discharge intensity of atmospheric pollutants in Xinjiang is three times higher than that at the national level, similar to the discharge intensity of water pollutants. The dominant industrial structure in Xinjiang dictates that the intensity of atmospheric pollutants must be kept at a high level.
3.2.1 Sulfur dioxide
The sulfur dioxide discharge in the three economic zones of Wu–Chang, Kui–Ke–Wu and Tu–Ha accounted for 57 %, 16 %, and 14 % respectively of the gross sulfur dioxide discharge from the Tianshan Mountain Northern Slope Economic Belt, and totaled to 87 %. The three economic zones are also areas with low sulfur dioxide discharge intensity. As shown in Fig. 5, the Tianshan Mountain Northern Slope Economic Belt has done well in sulfur dioxide discharge control.
《Fig. 5》

Fig. 5. Comparison of sulfur dioxide discharge intensity in six major economic zones.
From the dimension of industry, the Yi–Huo–Cha Economic Zone has a large and intense discharge for its coal and energy supply industry, which results in relatively severe air pollution in the economic zone. The Kui–Ke–Wu Economic Zone has the lowest sulfur dioxide discharge intensity but a high concentration (discharge from top ten large-discharge enterprises accounts for 97.9 % discharge in the region).
The ratio of sulfur dioxide discharge and the discharge intensity are compared with the industrial average level of the Tianshan Mountain Northern Slope Economic Belt, as shown in Table 6.
《Table 6》
Table 6. Comparison of sulfur dioxide discharge ratio and intensity.

From the perspective of sulfur dioxide discharge, the industry that belongs to the “non-dominant, high-intensity” industry is the petrochemical industry of the Shi–Ma–Sha Economic Zone and the metallurgy and the coal and energy supply industries of the Kui–Ke–Wu economic region, both of which should be phased out.
3.2.2 Nitrogen oxide
The discharge of nitrogen oxides in the Wu–Chang Economic Zone accounts for 60 %t of the total discharge of the Tianshan Mountain Northern Slope Economic Belt, followed by Tu–Ha (13 %), Kui–ke–Wu (12 %) and so on. The intensity of nitrogen oxide discharge in each economic zone is similar to the intensity of sulfur dioxide discharge. Besides the Kui–Ke–Wu Economic Zone (1.92 kg/ten thousand yuan), the remaining five economic zones have a higher discharge intensity of nitrogen oxides than the national and Xinjiang average levels, as shown in Fig. 6.
《Fig. 6》

Fig. 6. Comparison of nitrogen oxide discharge intensity in six major economic zones.
From the perspective of industry, the petrochemical industry and the coal and energy supply industry in the Shi–Ma–Sha Economic Zone, have a large and intense discharge of nitrogen oxides, which is responsible for the high discharge intensity of the economic zone. Although the petrochemical industry is not the leading industry in this economic zone, the proportion of its industrial output value is as high as 44.7 %. Therefore, for future industrial development, it is suggested that the overall technical equipment level of the industry be raised and the discharge intensity of nitrogen oxides be reduced.
The comparison of nitrogen oxide discharge ratio and intensity with the industry average level in the Tianshan Mountain Northern Slope Economic Belt is shown in Table 7.
《Table 7》
Table 7. Comparison of discharge ratio and intensity of nitrogen oxides.
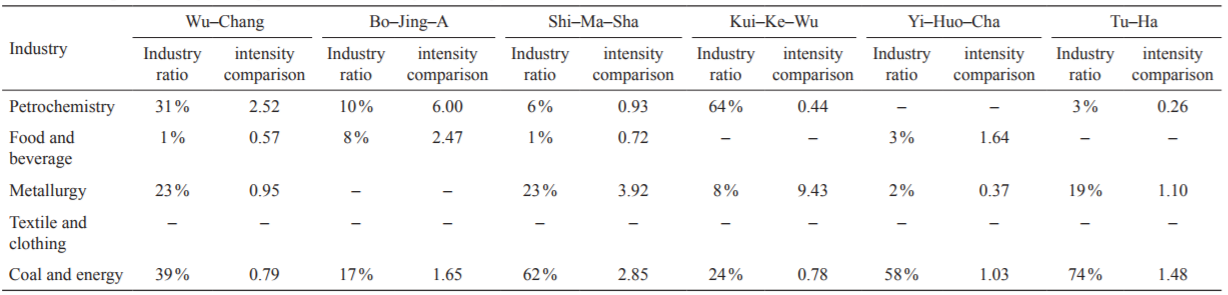
The “non-dominant, high-intensity” industries emitting nitrogen oxide include the petrochemical industry in the Bo– Jing–A Economic Zone, the coal and energy supply industry and the metallurgical industry in the Kui–Ke–Wu Economic Zone, the petrochemical industry in the Bo–Jing–A Economic Zone, and the metallurgy industry in the Kui–Ke–Wu Economic Zone, in particular, all of which should be phased out as soon as possible.
《4 Recommendations on the green development strategy》
4 Recommendations on the green development strategy
The results of the environmental performance evaluation by integrating industrial and regional dimensions, showed that the environmental performance of the north wing (Kui–Ke–Wu) was the best, followed by the south wing (Yi–Huo–Cha, Wu–Chang, Tu–Ha) and the middle wing (Shi–Ma–Sha, Bo–Jing–A). For this reason, the paper proposes recommendations of “one overall and three wings” strategy to promote the green development of industries in the Tianshan Mountain Northern Slope Economic Belt, with the division of “three wings” as shown in Fig. 7.
《Fig. 7》

Fig. 7. Division of the south, middle and north wing of the Tianshan Mountain Northern Slope Economic Belt.
《4.1 Overall: Comprehensively promote pollution prevention and control in the Tianshan Mountain Northern Slope Economic Belt and improve the level of green development of industries》
4.1 Overall: Comprehensively promote pollution prevention and control in the Tianshan Mountain Northern Slope Economic Belt and improve the level of green development of industries
The Tianshan Mountain Northern Slope Economic Belt and the whole of Xinjiang still have a big gap in terms of the prevention and control of industrial pollution with the national average level. It is suggested that the six economic zones should constantly adjust their industrial structure and optimize their new industrial layout during the future development processes, strengthen measures for environmental access, prohibit the addition of backward production capacity, encourage the development of high-quality production capacity, reduce the intensity of pollutant emissions, improve the quality of development, and promote green development in an all-round manner.
《4.2 Middle Wing: Accelerate the elimination of backward production capacity and rigorously implement the environment access for the industries》
4.2 Middle Wing: Accelerate the elimination of backward production capacity and rigorously implement the environment access for the industries
Step up efforts in the elimination of the petrochemical industry and the coal and energy supply industry in the Bo–Jing–A economic zone and the petrochemical industry in the Shi–Ma– Sha economic zone. It is necessary to control the generation of pollutants from the source and to improve terminal treatment facilities and treatment efficiency. In order to reduce the emission intensity of pollutants and improve the emission standards, it is necessary to move forward with the discharge reduction work in an all-round manner in accordance with the national standards.
《4.3 South Wing: Give equal emphasis on source reduction and process control and promote green development of industries》
4.3 South Wing: Give equal emphasis on source reduction and process control and promote green development of industries
Strengthen the prevention and control of ammonia-nitrogen and air pollution in the petrochemical industry of the WuChang Economic Zone. Strengthen the management of pollution discharge of enterprises, impose punitive charges on enterprises that fail to meet the standards of discharge, and collect environmental treatment deposits for environmental improvement from new and expanded enterprises; actively carry out clean production, raise the requirements for meeting the first-class index in clean production standard, pay equal attention to source reduction and process control, and realize the goal of green development of industry and region.
《4.4 North Wing: Focus on innovate environmental management and promote the sustainable green development of industries》
4.4 North Wing: Focus on innovate environmental management and promote the sustainable green development of industries
Promote the petrochemical industry to cluster, scale up, and embrace green development, strengthen the efforts in reduction of water pollutant discharge in the food industry and the coal and energy supply industry, promote reduction of atmospheric pollutants discharge in the metallurgy industry; strengthen the regional fine environmental management, make bold attempts such as introducing the green supply chain, environmental leadership, environmental Internet of things, third party environmental services, emissions trading, and other innovative environmental management measures to promote industrial green sustainable development.


 京公网安备 11010502051620号


