
《1 Introduction》
1 Introduction
The huge energy consumption scale and energy consumption structure associated with coal as the main energy source in China cause the emission of a number of air pollutants. In recent years, large-ranging and lost-lasting fog and haze weather events have occurred in many regions throughout China. This has become a focus of attention in our society. To solve serious atmospheric pollution problems quickly and improve the ambient air quality, the State Council of the People’s Republic of China issued and implemented the Air Pollution Prevention and Control Action Plan in September 2013. Since the action plan was implemented in 2013, the annual average concentration of PM2.5 in 74 cities of China has been lowered. However, the annual average concentration of PM10 in seven provinces of China increases. PM2.5 and O3 pollution in Eastern China is serious. We still face huge challenges regarding ambient air quality in China, as a whole, and in key regions of China.
Atmospheric environmental capacity refers to the maximum allowable emissions of air pollutants in one region under the constraint of a certain environmental target (such as ambient air quality compliance or critical load for acid deposition). In actual studies, we pay more attention to “regional atmospheric environmental capacity,” which refers to the allowable total amount of pollutants, in certain regions, that are emitted from various pollution sources to the atmosphere per unit time under certain weather conditions and pollution source emission conditions and on the condition that the ambient air quality target in the region is met. Besides environmental chemical characteristics of air pollutants, factors affecting the atmospheric environmental capacity include regional environmental target, regional geographic characteristics, and weather characteristics.
In China, atmospheric environmental capacity always is used as an important basis of total amount control of air pollutants and air quality control. Regarding atmospheric environmental capacity under various environmental targets, Chinese scholars have carried out much study. The Ambient Air Quality Standard of China was revised in 2012. PM2.5 became the primary pollutant affecting ambient air quality compliance in our cities. Compared to SO2, NO2, and PM10, the limit value of PM2.5 in ambient air is stricter. Therefore, based on the need of air quality management in China, the atmospheric environmental capacity as per PM2.5 compliance must be calculated, to provide scientific basis for air pollutant emission reduction [1]. Study of atmospheric environmental capacity in the Jingjinji region and five northwestern provinces of China will provide an important basis for establishing a precise fog and haze prevention and control system for regions at different stages of economic development.
《2 Study method》
2 Study method
《2.1 Overview 》
2.1 Overview
In the study, 2013 was used as the base year and 2030 as the target year. The atmospheric environmental capacities for SO2, NOx, primary PM2.5 ,VOCs, and NH3 emissions in the Jingjinji region and five northwestern provinces were confirmed by using the global atmospheric transmission model GEOS-Chem to conduct analog computation of pollutant concentrations in ambient air owing to the emissions from air pollution sources and based on the constraint condition that the annual grid average concentration of PM2.5 in the Jingjinji region and five northwestern provinces in 2030 meets the Ambient Air Quality Standard (GB3095–2012), so as to analyze the overload condition and emission reduction need in the base year.
《2.2 GEOS-Chem model setting》
2.2 GEOS-Chem model setting
(1) Simulation period: entire base year (2013) and entire target year (2030). The simulation interval is 3 h.
(2) Simulation area: China and other Asian regions close to China, extending to Japan in the east, India in the west, Siberia in the north, and Indonesia in the south. The longitude and latitude ranges were 70 ºE–150 ºE and 11 ºS–55 ºN, respectively, and the grid resolution was 0.5º×0.667º [2].
(3) Emission inventory: For artificial source emissions of the base year and target year in China, the latest artificial source emission inventory of Tsinghua University was used [3]. The default emission inventory of GEOS-Chem was used for other conditions.
(4) Selection of meteorological year: the GEOS-5 meteorological field used was updated to 2012 in 2015. Based on the comparison result between emissions of the base year 2013 simulated using the meteorological data of 2010–2012 and monthly average concentration of PM2.5 in Eastern China, the monthly average concentration of 2012 in Eastern China mostly approached the monthly average concentration of three years (2010–2012) (6.28 μg·m−3). The monthly average concentrations of 2010 and 2011 were 25.94 μg·m−3 and −32.22 μg·m−3, respectively. Therefore, the year 2012 was used as the meteorological year.
《2.3 Model verification》
2.3 Model verification
While using GEOS-Chem to calculate the atmospheric environmental capacity, the meteorological field, emission inventory, and concentration field shall be verified. Because the meteorological field for GEOS-Chem is an assimilative GEOS-5 meteorological field, verification of the meteorological field was not conducted in this study.
2.3.1 Comparison and check of emission inventory of the base year
The emission inventory of the base year was compared to other emission inventories of recent years in the study (Table 1). The emission inventories of Liu et al. [4], Xia et al. [5], and Wu et al. [6] were prepared using a bottom-up approach, and the 2015 emission data in Zhao et al. [7] was future predicted data based on the base year 2010. Unless the emission data issued by the Ministry of Environmental Protection is obviously lower than that in the emission inventories used in the study, the emission inventories used in the study are in the variation range of the study. One reason for the low emission data issued by the Ministry of Environmental Protection is that the emissions from non-road-traffic sources is excluded.
《Table 1》
Table 1. Comparison between emission inventories and other recent studies. (×103 t)

*The year in parentheses indicates the year of emission inventory prepared in the study.
2.3.2 Verification of simulated concentration of PM2.5 of the base year
Only if the simulated concentration of ground PM2.5 of the base year is correct, can the reliability of the simulated results in the future be ensured. In section 3.2.1, verification of the simulated concentration of PM2.5 of the base year will be discussed.
《3 Main results and analysis》
3 Main results and analysis
《3.1 Emission inventory of future years》
3.1 Emission inventory of future years
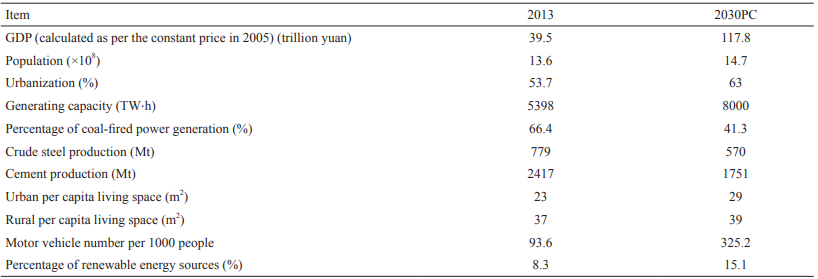
Atmospheric pollution is closely related to energy utilization. Emissions of the main atmospheric pollutants in future years depend on energy consumption as well as the control technology and countermeasures for atmospheric pollution. Emissions of the main atmospheric pollutants in future years are generally determined via the scenario analysis of different energy consumption scenarios and atmospheric pollutant control scenarios. This study is based on the research results of Zhao et al. [8]; it only analyzes the energy scenario (2030PC) and pollution control scenario (2030PC2) that can achieve the 2030 air quality target, as shown in Table 2 and Table 3, respectively.
《Table 2》
Table 2. Key parameters of the energy scenario in 2030.
《Table 3》
Table 3. Future scenario settings for 2030.

The energy scenario is up to 2030, and compared to 2013, the energy consumption in China has increased by 7 %. Coal is still the largest proportion of the energy structure but has reduced from 61% in 2013 to 44%. The percentage of renewable sources and nuclear energy has increased from 8.3 % in 2013 to 15.1 % in 2030. For end control policies, the table lists two endemission control policies for each energy scenario. The distribution ratio of end control technology is mainly calculated based on the relevant government notice and planning. 2030PC2 is set up based on the Air Pollution Prevention and Control Action Plan, assuming the control measures will become stricter gradually through year 2030. In the scenario, flue gas desulfurization (FGD) devices are extensively used in power plants and industrial sectors, and newly built industrial boilers are required to install low NOx burners (LNB). Electrostatic precipitators (ESPs) and high efficiency dusters (HEDs) will gradually replace the inefficient wet scrubbers (WETs). In civil sectors, the utilization rate of low-sulfur coal will reach 100 % in 2030; more advanced coals and biomass stoves also will be widely used. For traffic departments, high emission vehicles will soon be eliminated and nearly 100 % of the vehicles in 2030 will reach the current strictest emission standard in Europe [9].
《3.2 Analysis of atmospheric PM2.5 concentration in future years》
3.2 Analysis of atmospheric PM2.5 concentration in future years
Taking 2012 as the meteorological year, with the pollutant emission inventory of domestic artificial sources in 2013 updated to the emission inventory of the future year and the emission inventory of natural sources and overseas sources remaining the same, the GEOS-Chem was used to simulate the ground distribution of PM2.5 concentration in the Jingjinji region and five northwestern provinces, as shown in Fig. 1. For easy analysis, in addition to the PM2.5 concentration variation in 2030, the monitored and simulated concentrations of said provinces and autonomous regions in 2013 were added. Furthermore, as only 74 cities had complete and continuous PM2.5 monitoring data by the end of 2013 [10] and only the provincial capitals of the said five provinces and autonomous regions were included, the PM2.5 ground monitoring data for 2015 were used in Fig. 1 [11].
《Fig. 1》

Fig. 1. Ground PM2.5 variation in the Jingjinji region and five northwestern provinces. The abscissa has the cities sequenced from left to right with increasing latitude.
3.2.1 Verification of simulation values of ground PM2.5 concentration
The ground PM2.5 concentration simulated by the GEOSChem model was verified via three parameters—standard mean deviation, standard mean error, and the correlation coefficient R. The monitored data of ground PM2.5 concentration of the 13 cities in the Jingjinji region and the five capitals of the five provinces and autonomous regions was compared to the simulated concentration of the GEOS-Chem model grid located in the center of that city, and the results are shown in Table 4. The standard mean deviation of the Jingjinji region is −8.0 %, and the correlation coefficient R is 0.83; the standard mean deviation of the five northwestern provinces is −8.4 %, and the correlation coefficient R is 0.97. The model underestimated the ground PM2.5 concentration. This is because the meteorological year is 2012 and it is widely believed that the diffusion conditions in 2013 were better than in 2012, causing the results of the ground PM2.5 concentration simulated by the model to be slightly lower than the monitored data. Additionally, there are 66 cities in the Jingjinji region and five northwestern provinces, and the correlation analysis results between the monitored value of ground PM2.5 in 2015 and the simulated value in the base year are shown in Table 4. Although there are differences between 2013 and 2015 regarding both the meteorological field and emission inventory, the correlation analysis results can reflect the accuracy of the simulated results. The results indicate that the simulated results of the Jingjinji region, Shaanxi Province, and Qinghai Province were better than those of Gansu, Xinjiang, and Ningxia.
《Table 4》
Table 4. Verification results of the simulated values of ground PM2.5 concentration in the base year

3.2.2 Analysis of ground PM2.5 concentration compliance in the future year
It is shown in Fig. 1 that the mean annual concentration of ground PM2.5 of municipalities and provinces in the Jingjinji region and five northwestern provinces can all achieve the Class 2 air quality standard—35 μg·m−3; however, 15 prefecture-level cities, out of 64, in Hebei Province and the five northwestern provinces cannot reach the standard. This means that the emissions in the emission inventory of the future year is the atmospheric environment capacity constrained by the annual mean concentration of PM2.5 of the grids in the Jingjinji region and five northwestern provinces reaching the ambient air quality standard (GB3095–2012), not the atmospheric environment capacity constrained by the annual mean concentration of PM2.5 of the grids in prefecture-level cities reaching the ambient air quality standard (GB3095–2012). The latter is less than the former, and the specific values of the latter should be determined in future research.
《3.3 Analysis of atmospheric environment capacity》
3.3 Analysis of atmospheric environment capacity
3.3.1 Atmospheric environment capacity
The emissions in the emission inventory of the future year is the atmospheric environment capacity constrained by the annual mean concentration of PM2.5 of the grids in municipalities and provinces in the Jingjinji region and five northwestern provinces reaching the ambient air quality standard (GB3095–2012). The environment capacities of SO2, NOx, primary PM2.5, VOCs, and NH3 are shown in Table 5.
《Table 5》
Table 5. Environment capacity of the main atmospheric pollutants. (×104 t)

3.3.2 Overload rate of atmospheric environment capacity
The ratio between the atmospheric pollutant emissions and environment capacity in the base year 2013 was used to measure the atmospheric environment overload, of which the results are shown in Table 6. It is clear that the total overload of the five northwestern provinces was similar to that of the Jingjinji region. The overload rates of primary PM2.5 and NOx were 158 %–400 % more serious than the other pollutants. If we want to avoid atmospheric environment overload, the emissions of SO2, NOx, primary PM2.5, and VOCs in all regions should be reduced by 30 %–75 % relative to those in 2013. The maximum reduction ratio of NH3 emissions was 53 %.
《Table 6》
Table 6. Overload of main atmospheric pollutants in the base year. ( %)

《4 Conclusions》
4 Conclusions
(1) Under the constraints of the annual mean concentration of PM2.5 of the grids in municipalities and provinces in the Jingjinji region and five northwestern provinces reaching the ambient air quality standard (GB3095–2012), the environment capacities of the five atmospheric pollutants, SO2, NOx, primary PM2.5, VOCs, and NH3, were respectively 609 kt, 745 kt, 295 kt, 1322 kt, and 6260 kt and those in the five northwestern provinces were respectively 926 kt, 947 kt, 349 kt, 758 kt, and 9160 kt. However, the compliance rate of the annual mean concentration of PM2.5 for 66 prefecture-level cities in the Jingjinji region and five northwestern provinces corresponding to the said environment capacities was 76.6 %, and the atmospheric environment capacity corresponding to the 100 % compliance rate should be less than those capacities.
(2) The emissions of the five atmospheric pollutants (SO2, NOx, primary PM2.5, VOCs, and NH3) in the Jingjinji region in 2013 were respectively 2.23 times, 2.74 times, 3.59 times, 1.63 times, and 1.70 times its atmospheric environment capacity and those in the five northwestern provinces were respectively 2.28 times, 2.27 times, 2.81 times, 1.73 times, and 1.28 times its atmospheric environment capacity. The overloads of atmospheric environment capacity between the Jingjinji region and the five northwestern provinces in 2013 were generally the same. Therefore, during the implementation of the Belt and Road Initiative, attention should be paid to the constraints of atmospheric environment capacity of arid zones in western China. If we want to avoid atmospheric environment overload, relative to 2013, the emissions of the five atmospheric pollutants (SO2, NOx, primary PM2.5, VOCs, and NH3) in the Jingjinji region should be respectively reduced by 55%, 64%, 72%, 39%, and 41% and those in the five northwestern provinces should be respectively reduced by 56 %, 56 %, 64 %, 42 %, and 22%.
(3) The uncertainty of atmospheric environment capacity was determined via the air quality model, meteorological field, emission inventory, air quality standard, and other factors when utilizing the air quality model. This study used the GEOS-Chem model and the emission inventory of artificial sources in 2013 prepared by Tsinghua University and determined that the simulated values of ground PM2.5 concentration in Gansu, Xinjiang, and Ningxia provinces are negatively correlated or have low correlations with the monitored values. Therefore, it was confirmed through this study that the uncertainty of the atmospheric environment capacities of these three provinces is higher than that of the Jingjinji region and Shaanxi and Qinghai provinces, indicating the requirement for further studies.


 京公网安备 11010502051620号


