

《1 Introduction》
1 Introduction
Since 2004, China has been a net importer—rather than net exporter—of agricultural products. The bulk of agricultural commodities such as grain, cotton, oil, and sugar have shown a sustained net import trend, especially after the country became a net importer of rice in 2011. In the context of growing demand rigidity for domestic agricultural products, intensifying pressure on resources and environmental constraints, and price fluctuations in the international agricultural product markets, the central government put forward a new national food security strategy in late 2013. It confirmed that food security in China will be ensured by supporting domestic supply with moderate imports. The act further highlighted the government’s determination to enhance production capacity, catalyze the development of agricultural science and technology, and more effectively utilize global agricultural resources. The core features of the new strategy involve making full use of the international market and resources after factoring in the basic domestic supply. Despite the successive bumper harvests of grain in China in recent years, the import of grain and other major agricultural products has increased rapidly. Non-essential imports lead to the problem of excessive stocking, which poses a significant challenge to the Chinese agricultural industry [1,2]. Therefore, accurately assessing the trade situation of agricultural products in China, empirically examining the moderate scale of agricultural imports, developing the necessary tools to ensure the appropriate quantity and reliability of major agricultural product imports, and improving the ability to use these resources in both international and domestic markets are of great significance in relieving pressure on agricultural resources and the environment, promoting strategic adjustment in the agricultural structure, and guaranteeing national food security.
《2 Trends in Chinese agricultural commodities trade》
2 Trends in Chinese agricultural commodities trade
《2.1 Rapid development of agricultural commodities trade accompanied by a widening deficit》
2.1 Rapid development of agricultural commodities trade accompanied by a widening deficit
After entering the WTO in 2001, the trade in Chinese agricultural products exhibited rapid growth, with imports increasing much faster than exports. In 2015, the total trade of Chinese agricultural products yielded 187.56 billion USD—5.72 times the amount yielded in 2001. The average annual growth in trade was 14.6%; imports grew annually at 17.8%, reaching 116.88 billion USD, whereas exports grew 11.2% annually, reaching 70.68 billion USD (Fig. 1). The stature and impact of China’s agricultural product trade has been growing. The volume of China’s trade in agricultural products is the third largest in the world, following the EU and the US. It is the fifth-largest exporter and third-largest importer.
In the late 1990s, the trade volume of China’s agricultural products was around 25 billion USD; that of exports was about 15 billion USD and that of imports was 10 billion USD. Since 2004, China’s trade of agricultural products has changed from long-term surplus to continuous deficit; further, the deficit continues to grow rapidly. The trade deficit of agricultural products was 46.2 billion USD in 2015—8.96 times the amount in 2004—which signifies an annual growth of 23.2%. Among them, the trade deficits of grain, oil, edible vegetable oil, cotton, sugar, and animal by-products have become amplified to varying degrees.
《Fig. 1》

Fig. 1. The import and export of agricultural products in china from 1995 to 2015.
《2.2 The net import of bulk products is increasing, and the export of labor-intensive products remains stable》
2.2 The net import of bulk products is increasing, and the export of labor-intensive products remains stable
Bulk agricultural products, such as grain, cotton, oil, and sugar, are all resource-intensive. Under conditions of agricultural resource endowment with a large population and relatively little arable land, the production of grain, oil, cotton, sugar, and other land-intensive agricultural products in China obviously lacks competitive advantage. Since the trade of agricultural products changed from net exports to net imports in 2004, bulk agricultural products have exhibited an overall net import trend, and their numbers are increasing. During 2001–2015, the grain trade changed from net exports of 420 million USD to net imports of 8.96 billion USD; the net imports of oilseeds and vegetable oil changed from 2.78 billion USD and 500 million USD, respectively, to 37.6 billion USD and 5.8 billion USD; the net imports of cotton and sugar changed from 40 million USD and 250 million USD, respectively, to 2.67 billion USD and 1.72 billion USD; the net imports of animal by-products changed from 130 million USD to 14.56 billion USD (Table 1). According to the estimation of the net imports and Chinese crop yields of that year, the amount of net imports of the main four products was equal to the output of 1.014×10⁹ mu (1 mu ≈ 666.667 m2 ) of farmland; it accounted for 40.7% of the sown area in 2015, and was 4.83 times higher than that in 2001 (Table 2).
《Table 1》
Table 1. Change in China’s main agricultural products’ trade deficits during 2001–2015. Unit: 100 million USD
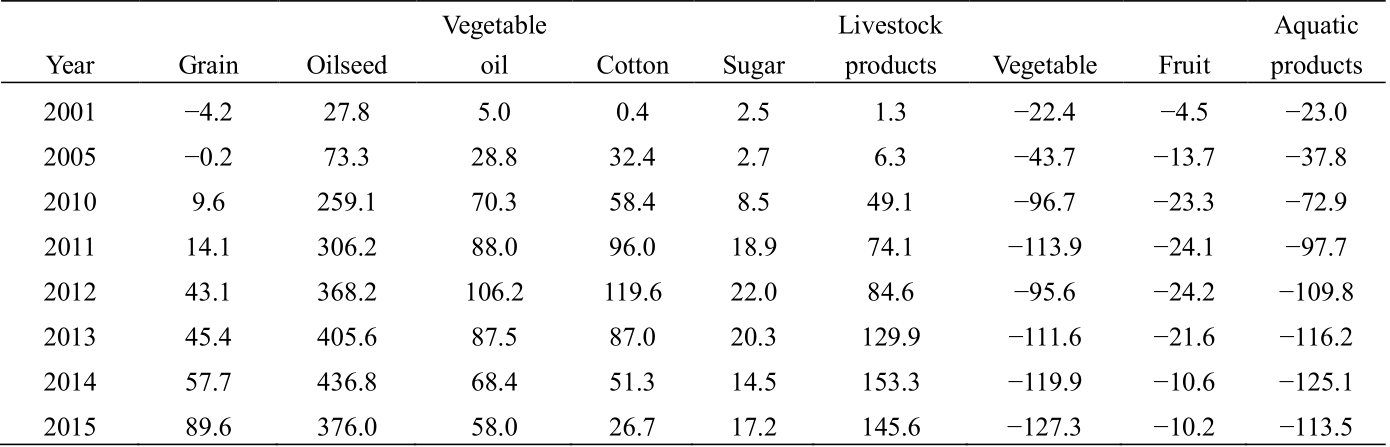
Source: Data from Chinese Customs.
《Table 2》
Table 2. Converted area use of net imports of bulk agricultural products during 2001–2015. Unit: ×104 mu

Source: Import and export data from Chinese Customs; yield data from the Yearbook of Chinese Agriculture.
Note: The area for palm oil is assumed to be the same as that for rapeseed oil.
a Grain includes wheat, rice, barley, and sorghum.
b Oilseed includes soybean and rapeseed.
c Vegetable oil includes soybean oil, peanut oil, rapeseed oil, and palm oil.
Vegetables, fruits, aquatic products, and other labor-intensive agricultural products exhibit price competitiveness and some export potential. Their imports have registered a steady increase. During 2001–2015, the net exports of aquatic products, vegetables, and fruits increased from 2.3 billion USD, 2.24 billion USD, and 450 million USD to 11.35 billion USD, 12.73 billion USD, and 1.02 billion USD, respectively.
《2.3 Distinct driving characteristics of domestic and international price margins》
2.3 Distinct driving characteristics of domestic and international price margins
From the perspective of the balance between supply and demand, there is no deficit in China’s three main grains— rice, wheat, and corn; in fact, there has been a surplus in most years. However, the imports of the three main grains suggest an overall trend of net imports; further, the amount of imports has grown rapidly in recent years and is driven by the price differences in domestic and international markets. The domestic price of the main grains has far exceeded their price in the international market since 2008, and the price margin has been widening. In 2015, the price of grain in China was RMB 600−800 per ton, or 60% higher than in the international market.
The widening price margin poses greater challenges to domestic agricultural development and food security. First, excessive importing causes overstocking. Under conditions of sufficient stock and a balance between supply and demand, the low price of Vietnam’s Indica Rice creates an intense motivation among domestic enterprises to import. The quantity of rice imported has exceeded 2.2×10⁶ t in the last two years. Although imported rice accounts for a very low proportion of total consumption, these import trends have significantly impacted the main areas producing Indica Rice, leading to difficulties in the sale of southern Indica Rice and overstocking. Because of the price margin, stocks of cotton have steeply increased from 2.16×10⁶ t to 1.167×10⁷ t between 2011 and 2013. The cost of maintaining stocks is nearly 20 billion yuan. Stocks of rapeseed oil and sugar are 6×10⁶ t and 5×10⁶ t, respectively. If they are sold at the prevailing market price, the loss would be over 10 billion yuan. Second, it strengthens the “ceiling effect” and affects agricultural industry security and food security [3]. Soybean crops are the most affected among bulk agricultural products and are a clear-cut example of the “ceiling effect”. The tariff on soybeans is only 3%, and the import price has effectively become a price ceiling for domestic soybeans. The domestic price could not increase parallel to domestic demand and increase in cost. As a result, the comparative advantage of soybean production has been declining and has exhibited fluctuations while declining. For example, the production has fallen from 8×10⁶ t to less than 3×10⁶ t. The comparison of agricultural product prices between the Chinese and international market is shown in Table 3 [4].
《Table 3》
Table 3. Price comparison between Chinese and international markets. Unit: Yuan/kg

Source: Data from Analysis and Forecast of Rural Economic Situation in China (2015—2016).
Note: The international price of wheat, corn, and soybeans is the US Gulf Offshore Price; the international price of rice is the Bangkok Price; and the domestic prices of wheat, rice, corn, and soybeans are based on the average wholesale price of these commodities.
aPrice difference = food price in Chinese market − food price in international market.
《2.4 Concentration of import and export trade partners》
2.4 Concentration of import and export trade partners
Except for rice and palm oil, the import sources of bulk agricultural products are mainly the US, Brazil, Argentina, the EU, and other resource-abundant countries or regions. For example, in 2015, 95.0% of the wheat imported came from Australia, the US, and Canada; 81.4% of the imported corn was from Ukraine; 83.8% of the imported sorghum came from the US; 87.5% of the imported soybean oil was from Argentina and Brazil; 99.8% of the imported palm oil was from Indonesia and Malaysia; and 72.1% of the poultry meat was from Brazil (Table 4). The main export destinations of vegetables, fruits (excluding nuts), and aquatic products are ASEAN, Japan, Korea, and surrounding countries and areas (Table 5).
《Table 4》
Table 4. China’s main import partners for agricultural products in 2015.


Table 4 (continued)

Source: Data from Chinese Customs.
Note: The percentages in parentheses refer to the country’s share in the total domestic imports of each product.
《Table 5》
Table 5. China’s main export partners for agricultural products in 2015.

Source: Data from Chinese Customs.
Note: The percentages in parentheses refer to the country’s share in total exports of each product.
《3 Analysis of the import threshold of major Chinese agricultural products》
3 Analysis of the import threshold of major Chinese agricultural products
To avoid the “large country effect” in agricultural trade and its impact on global agricultural trade, and to scientifically calculate the scope or thresholds of China’s imports of agricultural products in the future, we propose the following principles: the growth in China’s share of world agricultural imports should remain within 3% of the value during an evaluation period relative to the base period (2015); China’s newly increased import volume should be less than 30% of global increased trade volume. To reduce risk, China must meet these stringent requirements [5].
《3.1 Major grain》
3.1 Major grain
According to the data available, the imports of major grain in 2025 and 2030 are expected to be 2.386×10⁷ t and 2.564×10⁷ t, respectively. Compared with the import volume of 1.111×10⁷ t in 2015, there is still scope for further adjustments in the international market, which are beneficial to the flexible and moderate adjustment of domestic production; further, they will improve the ability to adjust the domestic agricultural industry’s structure and allow the recuperation it requires (Table 6).
《Table 6》
Table 6. The import threshold of major Chinese agricultural products in 2025 and 2030.

Table 6 (continued)

Source: World trade volumes in 2015 and 2025 are from The Organization for Economic Cooperation and Development and the FAO Agriculture Outlook (2016—2025); World trade volume values in 2030 are based on extrapolations of the Organization for Economic Cooperation and Development’s medium- and long-term global economic growth projections.
3.1.1 Wheat
The volume of wheat imported by China in 2015 was 3.01×10⁶ t, accounting for 2% of global wheat exports. The main sources of imports—Australia, Canada, and the US—accounted for 95% of total imports. It is predicted that the global production of wheat in 2025 will be 7.9×10⁸ t, and the trade volume will be 1.7×10⁸ t (accounting for 22.0% of production). The production in 2030 will be 8.3×10⁸ t, with a trade volume of 1.9×10⁸ t (accounting for 22.9% of production). The projections for wheat imports in 2025 and 2030 are 8.7×10⁶ t and 9.33×10⁶ , respectively; these will account for 5.0% of global exports.
3.1.2 Rice
The volume of rice imported by China in 2015 was 3.38×10⁶ t, accounting for 7.6% of global rice exports. The main sources of imports—Vietnam, Thailand, and Pakistan—accounted for 94.8% of total imports. It is predicted that the global production of rice in 2025 and 2030 will be 7.9×10⁸ t and 8.3×10⁸ t, respectively. The exports in 2025 and 2030 are likely to be 5.1×10⁷ t and 5.5×10⁷ t, respectively (accounting for 6.5% and 6.6% of the total production in those years). The projections for rice imports in 2025 and 2030 are 5.48×10⁶ t and 5.87×10⁶ t, respectively; these will account for 10.6% of global exports.
3.1.3 Corn
The volume of corn imported by China in 2015 was 4.73×10⁶ t, accounting for 3.9% of global corn exports. The main sources of import—Ukraine and the US—accounted for 91.2% of total imports. It is predicted that the global production of corn in 2025 and 2030 will be 1.15×10⁹ t and 1.23×10⁹ t, respectively. The exports in 2025 and 2030 are likely to be 1.42×10⁸ t and 1.52×10⁸ t, respectively (accounting for 12.4% of total production). The projections for corn imports in 2025 and 2030 are 9.71×10⁶ t in 2025 and 1.044×10⁷ t, respectively; these will account for 6.9% of global exports.
《3.2 Cotton, oil, and sugar》
3.2 Cotton, oil, and sugar
The amount of cotton imported by China is huge, but the potential for further increase is limited. On account of the rigid growth and huge demand of edible vegetable oil, we must expand our capacity for imports in order to ensure the balance between future supply and demand.
3.2.1 Cotton
The volume of cotton imported by China in 2015 was 1.76×10⁶ t; this accounts for 23.5% of global cotton exports. The main sources of Chinese cotton imports—the US, Australia, India, Uzbekistan, and Brazil—accounted for 89.9% of the total quantity imported. It is predicted that the global production of cotton in 2025 and 2030 will be 2.8×10⁷ t and 3.1×10⁸ t, respectively; further, the exports in 2025 and 2030 are likely to be 8.69×10⁶ t and 9.36×10⁶ t, respectively (accounting for 31% of total production). The projections for cotton imports in 2025 and 2030 are 2.12×10⁶ t and 2.32×10⁶ t, respectively; these will constitute 24% of global exports.
3.2.2 Vegetable oil
The volume of vegetable oil imported by China in 2015 was 8.39×10⁶ t; this accounts for 14.7% of global vegetable oil exports. The main sources of Chinese vegetable oil imports—Indonesia and Malaysia—accounted for 70.9% of the total quantity imported. It is predicted that the global production of vegetable oil in 2025 and 2030 will be 2.19×10⁸ t and 2.43×10⁸ t, respectively; further, the exports in 2025 and 2030 will be 9.2×10⁷ t and 1.01×10⁸ t, respectively (accounting for 41.5% of total production). The projections for vegetable oil imports respectively are 1.278×10⁷ t and 1.397×10⁷ t, respectively; these will constitute 13.9% of global exports.
3.2.3 Sugar
The volume of sugar imported by China in 2015 was 4.85×10⁶ t, which accounts for 8.5% of global sugar exports. The main sources of Chinese sugar imports—Brazil, Thailand, Cuba, and Guatemala—accounted for 93.6% of the total quantity imported. It is predicted that the global production of sugar in 2025 and 2030 will be 2.10×10⁸ t and 2.35×10⁸ t, respectively; further, the exports in 2025 and 2030 will be 7×10⁷ t and 7.8×10⁷ t, respectively (accounting for 33% of total production). The projections for sugar imports in 2025 and 2030 are 8.08×10⁶ t and 8.97×10⁶ t, respectively; these will constitute almost 11.5% of global exports.
《3.3 Livestock and aquatic products》
3.3 Livestock and aquatic products
There is plenty of scope for importing pork, beef, poultry, and aquatic products, but less so for mutton; this will affect Chinese imports of mutton, to some extent.
3.3.1 Pork
The volume of pork imported by China in 2015 was 7.8×10⁵ t, accounting for 10.6% of the global pork exports. The main sources of import—Germany, Spain, the US, Denmark, Canada, and France—accounted for 80.8% of total imports. It is predicted that the global production of pork in 2025 and 2030 will be 1.31×10⁸ t and 1.38×10⁸ t, respectively; further, the exports in 2025 and 2030 will be 8×10⁶ t and 9×10⁶ t, respectively (accounting for 6.5% of total production). The projections for pork imports in 2025 and 2030 are 1.12×10⁶ t and 1.24×10⁶ t, respectively; these will constitute 13% of global exports.
3.3.2 Beef and mutton
The volume of beef and mutton imported by China in 2015 was 7×10⁵ t, accounting for 5.6% of the global beef and mutton exports. The main sources of imports are countries with abundant agricultural resources, such as the US, New Zealand, and Australia. It is predicted that the production of global beef and mutton in 2025 and 2030 will be 9.5×10⁷ t and 1.03×10⁸ t, respectively; further, the exports in 2025 and 2030 will be 1.5×10⁷ t and 1.6×10⁷ t, respectively (accounting for 15.5% of total production). The projections for beef and mutton imports in 2025 and 2030 are 1.23×10⁶ t and 1.34×10⁶ t, respectively; these will constitute 8.3% of global exports.
3.3.3 Poultry
The volume of poultry imported by China in 2015 was 4.1×10⁵ t, accounting for 3.4% of global poultry exports. The main sources of imports—Brazil, Argentina, the US, Chile, and Poland—accounted for 99.1% of total imports. It is predicted that in 2025 and 2030, the global production of poultry in 2025 and 2030 will be 1.31×10⁸ t and 1.41×10⁸ t, respectively; further, the exports in 2025 and 2030 will be 1.5×10⁷ t and 1.7×10⁷ t, respectively (accounting for 12% of total production). The projections for poultry imports in 2025 and 2030 are 9.9×10⁵ t and 1.12×10⁶ t, respectively; these will constitute 6.4% of global exports.
3.3.4 Aquatic products
The volume of aquatic products imported by China in 2015 was 4.08×10⁶ t, accounting for 10.5% of the global aquatic product exports. The main sources of imports are the US and Australia. It is predicted that the global production of aquatic products in 2025 and 2030 will be 1.96×10⁸ t and 2.10×10⁸ t, respectively; further, the exports in 2025 and 2030 will be 4.6×10⁷ t and 5.1×10⁷ t, respectively (accounting for 24% of total production). The projections for the import of aquatic products are 6.27×10⁶ t and 6.86×10⁶ t in 2025 in 2030, respectively; these will constitute 13.5% of global exports.
《4 Policy recommendations》
4 Policy recommendations
《4.1 Prioritize domestic production and ensure self-sufficiency in major agricultural products》
4.1 Prioritize domestic production and ensure self-sufficiency in major agricultural products
Accounting for the strategic significance of agricultural trade—especially grain trades—and the monopolization of international food trade by the four transnational grain traders, only maintaining a certain level of self-sufficiency can ensure our initiative and impact in global agricultural product trades.
Additionally, because China is a large country with a population of 1.3 billion, international agricultural markets may not be able to provide a sufficient quantity of agricultural products. Meanwhile, the “large country effect” in agricultural trade cannot be ignored. Therefore, we must emphasize the domestic market to ensure self-sufficiency in major agricultural products. This will not only guarantee domestic food security, but is also responsible for international community.
《4.2 Adopt proactive import strategies, combine agricultural imports with a relieving of the domestic resource and environmental pressure, and promote the transformation of Chinese agricultural modes of production》
4.2 Adopt proactive import strategies, combine agricultural imports with a relieving of the domestic resource and environmental pressure, and promote the transformation of Chinese agricultural modes of production
Taking into consideration the moderate agricultural import benefits in terms of relieving resource pressure, we should change the earlier strategy of “import only when our production is insufficient.” Thus, it is necessary to adopt proactive import strategies to fully utilize the international and domestic markets. Further, to ensure the viability of Chinese agricultural production, the focus on agricultural resources—which relieves import pressure—must be combined with soil fertility improvement measures and a transformation in modes of agricultural production.
《4.3 Improve the monitoring of international agricultural markets and import early-warning mechanisms and enhance the capacity to control agricultural trade》
4.3 Improve the monitoring of international agricultural markets and import early-warning mechanisms and enhance the capacity to control agricultural trade
With the basic goal of meeting domestic demand, protecting domestic agricultural development, and effectively coping with price fluctuations in the international agricultural market, it is essential to implement the following measures: (1) increasing efforts to monitor supply and demand conditions in major countries, and focusing on key markets for agricultural products; (2) strengthening information collection, analysis, and research of international market prices, supply, and demand dynamics, as well as trade circumstances and related national trade policies; and (3) enhancing trade control of bulk agricultural products to ensure the stability of their supply.
《4.4 Improve the ability to steadily control international markets and resources》
4.4 Improve the ability to steadily control international markets and resources
It is vital to fully utilize international markets and resources, especially those in the countries and regions along the “One Belt and One Road”. The following measures are recommended: (1) supporting the domestic agricultural enterprises to “go abroad;” (2) establishing overseas production bases and logistics facilities and sustainable, stable, and efficient import supply chains for agricultural products; and (3) expanding our trade channels and environments to foster competitive agricultural enterprises.


 京公网安备 11010502051620号


