

《1. Introduction》
1. Introduction
Metabolic syndrome is a set of widely prevalent and multifactorial metabolic disorders, including obesity, insulin resistance, dyslipidemia, and hypertension [1,2]. These conditions are interrelated and share underlying mediators, mechanisms, and pathways [2]. However, the molecular mechanisms of metabolic disorders are not fully understood. Metabolic disorders are critical risk factors for fatal diseases (including cardiovascular disease, stroke, and cancer) [3–5], which escalate global public health problems and exacerbate the global burden of related fatal diseases. Therefore, exploring the pathogenesis of metabolic traits is of great importance for the prevention and intervention of metabolic disorders.
Glycosylation, as a crucial and common posttranscriptional attachment of proteins, is involved in many biological and/or pathological processes [6–8]. Previous studies have shown that more than half of all known proteins have a glycan structure, which affects the function of the protein [7,9]. As the most common type of antibody, immunoglobulin G (IgG) plays a crucial role in nonspecific immune function. N-glycans are remarkably abundant and diverse, and are usually found on the outermost surface of the IgG binds to cellular and secreted macromolecules. The placement of N-glycans induces the effects of the Fc region of an IgG macromolecule in antibody-based immunity in humans. Alteration of N-glycosylation significantly influences IgG structure and function and, by extension, its immunological properties, thereby causing a shift between pro- and anti-inflammatory IgG functions [7,10,11]. Altered IgG N-glycans have been shown to be involved in several metabolic disorders, including obesity [12], dyslipidemia [13], hypertension [14], and type 2 diabetes mellitus (T2DM) [15,16]. However, the causality between the alteration of IgG Nglycosylation and metabolic traits remains to be determined.
Recently, Mendelian randomization (MR) has been increasingly used to make causal inferences between risk factors and outcomes. More specifically, using a variety of instrumental variable (IV) analysis methods, MR studies rely on the natural, random assortment of genetic variants during gamete formation, which greatly reduces the impact of reverse causality and confounding factors [17–19]. Nevertheless, due to genetic variation, the MR approach is usually biased by weak IVs that only explain a small part of the exposure variance [20–22]. Genome-wide association studies (GWASs) have ascertained genetic variants related to quantitative exposure, and thus provide knowledge of quantitative trait loci (QTLs) [23–26]. Integrating QTL data and GWAS analysis can increase the ability of GWASs to ascertain genetic loci controlling complex traits and improve the explanation of trait variance—suggesting that QTL variants could provide highly effective IVs for risk factors in MR studies [23,26,27]. Previous studies have reported that the polymorphisms of B3GAT1, SLC9A9, MGAT5, FUT8, FUT6/FUT3, and HNF1A are linked with variation within the plasma N-glycome in European adults [28], and that these variants are involved in the regulation of glycoenzymes and play crucial roles in the process of IgG N-glycosylation among people of European descent [29]. Consequently, we assumed that identifying IgG N-glycan-QTLs IVs and integrating them into disease (outcome)-related IVs (genetic variants) in a GWAS could help elucidate the underlying molecular mechanisms of genetic susceptibility to diseases, at least in part due to altered IgG N-glycans.
In fact, it should be pointed out that all current MR approaches present the challenge of discriminating the mediation effect from horizontal pleiotropy [30,31], with the former being interpreted as results when the genetic variant affects the target outcome through multiple phenotypes (outside of the pathway of interest exposure). We hypothesized that the association between IgG N-glycosylation and metabolic traits might have bidirectional causality, which might contribute to bidirectional regulation based on independent pathogenic mechanisms or pathways.
With the continuous development and optimization of glycoengineering techniques, glycans provide a novel dimension of medical science—namely, glycomedicine, in which glycomics approaches can be employed with the aim of better targeting disease diagnostics, drug discovery, and dosing based on individual glycomics profiles to enable preventive, predictive, and precision medicine [32]. Therefore, we undertook a bidirectional MR analysis integrating GWASs for metabolic traits/IgG N-glycans and IgG N-glycan-QTLs/metabolic-QTLs data in order to assess the causation between IgG N-glycosylation and metabolic traits in East Asians. Our study further identified the mechanisms underlying genetic susceptibility to complex traits and explored the regulatory mechanisms of IgG N-glycosylation. This work may provide a certain basis for the development of glycomedicine targeting metabolic status or diseases and may contribute to facilitating timely healthy-lifestyle interventions and treatment decisions for metabolism-related diseases from the perspectives of prediction, prevention, and precision medicine.
《2. Materials and methods》
2. Materials and methods
In this study, we used two approaches relying on two data sources, as follows: We used a one-sample MR approach, in which the IV-exposure and IV-outcome effects were evaluated in the same sample; and we applied a two-sample MR approach, in which the IV-exposure and IV-outcome effects were assessed in different samples. The overall design used for this study is delineated in Fig. S1(a) in Appendix A.
《2.1. One-sample MR study based on individual-level data》
2.1. One-sample MR study based on individual-level data
2.1.1. Study participants
This study was based on a community-based cohort crosssectional study using data from Xuanwu Hospital, Capital Medical University, Beijing, China. More detailed descriptions of the study design and evaluation methodologies have been previously reported [12,33]. All participants met the following inclusion criteria: ① an age greater than or equal to 18 years; ② no medication history in the past 2 weeks; and ③ having IgG N-glycosylation and GWAS data. In addition, the exclusion criteria were presented as follows: If the participants had a history of mental illness, infectious disease, malignant tumor, stroke, or other cerebrovascular diseases and/or presented incomplete data, they were excluded from this study. In total, 536 participants who aligned with the above inclusion and exclusion criteria were included in the study. Each participant was required to sign written informed consent before enrollment. The study was approved by the Ethics Committee of the Capital Medical University, Beijing, China (No. 2009SY16), and was performed in accordance with the principles expressed in the Declaration of Helsinki.
2.1.2. Data collection
All participants completed routine physical examinations that contained anthropometric measurements and biochemical tests; detailed information is described in our previous report [33]. Blood pressure (BP), including diastolic blood pressure (DBP) and systolic blood pressure (SBP), was measured (with at least 5 min of rest) on the right arm with a standard mercury sphygmomanometer by trained nurses. The height, weight, and body mass index (BMI) of the participants were measured with the participants wearing light indoor clothing and no shoes. After an overnight fast, peripheral blood from the subjects were collected in the morning in ethylenediaminetetraacetic acid (EDTA) anti-coagulated tubes for the detection of biochemical indexes. Biochemical traits related to metabolism (triacylglycerol (TG), high-density lipoprotein cholesterol (HDL-C), total cholesterol (TC), low-density lipoprotein cholesterol (LDL-C), and fasting plasma glucose (FPG)) were assayed as previously described [13]. Since the metabolic indicators were not normally distributed, we used zero-mean normalization (z-score normalization) to process the metabolic trait data and then continued the subsequent analysis. In this MR study, we integrated GWAS and QTL data to assess the causality between IgG Nglycosylation and metabolic traits. Therefore, the metabolic traits included in this study were BMI (kg·m–2 ), SBP (mmHg, 1 mmHg = 0.133 kPa), DBP (mmHg), TG (mmol·L–1), HDL-C (mmol·L–1), TC (mmol·L–1), LDL-C (mmol·L–1), and FPG (mmol·L–1), which were used as continuous variables for subsequent statistical analysis.
2.1.3. Analysis of the IgG N-glycome
We performed IgG N-glycans detection on all participants, as previously described [34]. In brief, IgG was separated from the human plasma samples of all subjects utilizing pretreated 96- well protein G monolithic plates. The isolated IgG was dried and denatured according to standard experimental procedure; then, the sample was incubated for 18–20 h (37 °C) to obtain the released IgG N-glycans.
Next, 2-aminobenzamide labeling solution was added to each released IgG N-glycans sample, incubated for 3 h at 65 °C, and then filtered to obtain the labeled N-glycans. Hydrophilic interaction chromatography-ultraperformance liquid chromatography was used to separate and detect the IgG N-glycan profiles. The separated chromatograms were first processed by the automatic processing method with a traditional integration algorithm; then, the chromatograms were manually corrected to ensure that all the analytic samples maintained the same intervals of integration. Finally, 24 glycan peaks (GPs; GP1–GP24) were obtained according to peak position and retention time, and the amount of glycans in each peak was expressed as a percentage (%) of the total integrated area. Detailed structures of the N-glycans in each peak have been previously described [34]. To control the experimental variability, we used batch correction and z-score transformation methods to deal with the original glycan data in order to make all data comparable [13,34].
2.1.4. Genotyping and genotype imputation
The IgG N-glycan-QTL genetic variants were applied as the IVs from the IgG N-glycans GWAS, which was conducted in 536 participants with both genetic and IgG N-glycosylation data from Xuanwu Hospital, Capital Medical University, Beijing, China [33]. We used Illumina Omni Zhonghua chips (Illumina, USA) to perform the genotyping procedures. The quality control process was performed as previously described in detail [35]. Genotypes were imputed using the East Asian component of the 1000 Genomes Project panel phase 3 via the Michigan Imputation Server [36]. Single nucleotide polymorphisms (SNPs) with an imputation quality ratio > 0.30 and a minor allele frequency (MAF) > 0.01 were retained, leaving 7 108 659 imputed SNPs that were subsequently used for IgG N-glycan-QTLs mapping. We did not correct the principal component (PC), as we did not encounter the problem of population stratification.
2.1.5. Statistical analyses
With the individual-level data from one sample, we used a series of MR analyses to investigate the relationship between IgG N-glycosylation and metabolic traits. A genome-wide IgG N-glycan-QTL study was performed to identify genetic variants known to influence IgG N-glycosylation. In total, 7 108 659 imputed genetic variants against each of the 24 IgG N-glycans were tested in 536 participants. Adjusting for age and gender, IgG N-glycans and SNPs were used as dependent variables and independent variables, respectively, and the correlation between each SNP and the IgG N-glycans was tested by means of linear regression. We then performed GWASs for metabolic traits, adjusted for the same covariates of age and gender. Next, using SNPs as independent variables and each metabolic trait as a dependent variable, the correlation between each SNP and each metabolic trait was estimated by means of linear regression. To screen the IgG N-glycan-QTLs as IVs for IgG N-glycans, we performed a relatively conservative Bonferroni correction to select IVs (i.e., P < 1 × 10⁻⁵). Previous studies have suggested that a weak standard of significance level of 1 × 10⁻⁵ can be used for causal inference in MR studies, especially in studies with a small sample size [37,38]. Considering that our GWAS was based on 536 individuals, a relaxed standard 1 × 10⁻⁵ was used to filter out candidate SNPs as instrumental variables (IVs) in the one-sample forward MR analysis. Since there is high linkage disequilibrium (LD) between many significant IgG N-glycan-QTLs and metabolic-QTLs, only the independent IgG N-glycan-QTLs/metabolic-QTLs for each IgG N-glycan and/or metabolic trait was retained (the r2 of LD < 0.001). We selected the SNPs with the lowest P values from the genetic variants with LD. Moreover, LD proxies were defined based on 1000 genomes from East Asian samples. To reduce the bias of vertical pleiotropy, overlapping SNPs as candidate IVs for both IgG N-glycans and metabolic traits were removed [39]. The retained SNPs were then used as final IVs. We estimated the variance in exposures explained by each SNP (R2 = (2 × Beta2 × MAF × (1 – MAF))/(2 × Beta2 × MAF × (1 – MAF) + SEBeta2 × 2 × N × MAF × (1 – MAF)) [40] and summed them to calculate the overall R2 and F-statistics (R2 × (N – 2)/(1 – R2 )). A higher R2 and F-statistic suggested a lower risk of weak instrument bias.
To evaluate the bidirectional causality between IgG N-glycans and metabolic traits, the inverse-variance weighted (IVW) method was adopted in the main MR analyses; this method was performed using the mr_ivw function based on the R package MendelianRandomization (version 0.6.0). We used the observed correlation between IgG N-glycosylation and metabolic traits to explain the relationship between genetic association with IgG N-glycosylation and genetic association with metabolic traits due to sample overlap. An IVW Q test was conducted to test the heterogeneity of the IVs. If heterogeneity existed (P < 0.05), the random-effect IVW method was applied; otherwise, the fixed-effect IVW method was used. We also implemented sensitivity analyses to determine potential violations of valid IV assumptions using the weighted median (WM) and the MREgger regression. The intercept of the MR-Egger analysis can be used to evaluate pleiotropy. If a pleiotropic effect was not observed, meaning that the threshold of the MR-Egger intercept was more than 0.05, then the results of the IVW MR method were retained. The MR pleiotropy residual sum and outlier (MR-PRESSO) was also performed, in which the global test was used to examine horizontal pleiotropy [31] (R package MR-PRESSO, version 1.0). As some weak IVs were included in the one-sample MR analysis, the MR robust adjusted profile score (MR.RAPS) method (R package mr.raps, version 0.2) was further used to make the results more robust [41]. In addition, we performed leave-one-out sensitivity analyses, in which SNPs were excluded in turn for analyses, in order to investigate SNPs that could potentially bias the causal association. Moreover, a previous study reported that an inflammatory marker—namely, C-reactive protein (CRP)—was associated with the level of IgG N-glycans [42]; therefore, the study further investigated whether CRP in fact mediates the effect of IgG N-glycans on metabolic traits and vice versa, by means of a multivariable MR analysis performed using the IVW, WM, and MR-Egger regression approaches. The results were recorded as the Beta and standard error (SE) of the outcomes per genetically predicted increase in each exposure. The power of the MR studies was determined using mRnd online↑ .
↑ https://cnsgenomics.com/shiny/mRnd/; accessed in December 2021.
The study data were cleaned by means of R language 4.0.0, and statistical analysis was conducted using R language 4.0.0 and PLINK 1.9. To adjust for multiple testing, Benjamini–Hoch berg’s (BH) procedure was used to control the false discovery rate (FDR). The above findings showed limited pleiotropic bias (MR-Egger intercept: P > 0.05; MR-PRESSO global test: PFDR > 0.05).
《2.2. Two-sample MR study based on summary-level data》
2.2. Two-sample MR study based on summary-level data
2.2.1. Data source
The GWAS results for the IgG N-glycans based on the above onesample study and GWAS results for metabolic traits based on summary statistics obtained by Biobank Japan↑ [43] were used to perform two-sample MR analyses. The GWASs incorporated gender, age, the top 10 PCs, and the affection status of 47 diseases as covariates. The sample size of the summary statistics of the GWAS about metabolic traits based on Japanese ancestry populations was 158 284 for BMI, 93 146 for FPG, 136 597 for SBP, 136 615 for DBP, 105 597 for TG, 128 305 for TC, 70 657 for HDL-C, and 72 866 for LDL-C. The GWAS summary data for CRP used in the above one-sample MR study was also based on Biobank Japan, with a sample size of 75 391.
2.2.2. Statistical analyses
The IVs for the IgG N-glycans in the two-sample MR were similar to those in the one-sample MR (significance threshold at P < 1 × 10⁻⁵). For each metabolic trait, we selected SNPs associated with the metabolic traits at genome-wide significance thresholds P < 5 × 10⁻⁸ in the two-sample MR study. The process of selecting IVs in the two-sample MR was the same as that in the one-sample MR. Furthermore, in the two-sample MR analysis, the PhenoScanner tool was applied to check and exclude any of the selected SNPs (IVs) associated with other potential phenotypes affecting the outcomes . In the main MR analyses, the IVW method was used to assess the bidirectional causality between IgG N-glycosylation and metabolic traits based on the twosampleMR R package (version 0.5.6). For the two-sample MR analysis of IVW, it was not necessary to consider the problem of sample overlap. The other analyses followed the same processes as those used for the one-sample MR analyses. The BH procedure was used to control the FDR in the MR analysis. The above findings were of limited pleiotropic bias (MREgger intercept: P > 0.05; MR-PRESSO global test: PFDR > 0.05).
http://www.phenoscanner.medschl.cam.ac.uk/; accessed in September 2022.
《2.3. Meta-analysis and the comparison of the one- and two-sample MR analyses》
2.3. Meta-analysis and the comparison of the one- and two-sample MR analyses
If one or both of the one- or two-sample MR results for the same exposure associated with an outcome were statistically significant, we then used IVW meta-analytic technology to combine the IVW method results from the one- and two-sample MR studies (R package meta, version 4.18–2). The combined results are recorded as Beta with a 95% confidence interval (95% CI). Random-effect IVW models were used if heterogeneity existed (P < 0.05); otherwise, a fixed-effect IVW model was used. The use of Bonferroni correction for multiple testing adjusted the significance level to P < 0.05/24 (0.0021) in the meta-analysis. The overlapping potential causal associations of metabolic traits with IgG N-glycans were also compared in the one- and two-sample forward MR studies, and vice versa.
In this study, a P value of less than 0.05 was regarded as suggestive evidence for a potential association. A P value corrected by the BH procedure to be less than 0.05 or a P value corrected by the Bonferroni method to be less than 0.0021 was regarded as evidence for a potential association. All statistical analyses were implemented using R version 4.0.0 and PLINK 1.9.
《2.4. Bioinformatics analyses》
2.4. Bioinformatics analyses
The annotations of the SNPs of the corresponding located genes were obtained online g:Profiler tool↑↑. To functionally annotate putative genetic variants, a functional enrichment analysis for the identified genes was applied using the functional annotation tool Metascape [44] for the genes harboring the IgG N-glycan-QTLs. Enrichment analyses, including the gene ontology (GO) and Kyoto Encyclopedia of Genes and Genomes pathway, were performed using gene symbols, with putative genes (P < 0.05) as the input.
↑↑ https://biit.cs.ut.ee/gprofiler/snpense; accessed in December 2021.
《2.5. Explanations for the findings》
2.5. Explanations for the findings
As presented in Fig. S1(b) in Appendix A, the causal relationships between IgG N-glycosylation and metabolic traits were depicted as four possible conditions, which were investigated through bidirectional MR analysis. Based on the screened SNPs as IVs, the bidirectional MR analysis (i.e., forward and reverse MR settings) did not overlap between IgG N-glycosylation and metabolic traits. Four possible explanations were determined from our results:
• Explanation 1. One or more genetic variants (SNPs) affect metabolic traits, mediated by IgG N-glycosylation.
• Explanation 2. One or more genetic variants (SNPs) affect metabolic traits through alternative biological mechanisms, which then play a downstream role in IgG N-glycosylation.
• Explanation 3. There is bidirectional causality between IgG N-glycosylation and metabolic traits through independent biological pathways.
• Explanation 4. There is no causal association between IgG N-glycosylation and metabolic traits, and the association between IgG N-glycosylation and metabolic traits may be caused by confounders.
In Fig. 1, we provide an overview of the MR approach used to explore these four explanations. A forward MR study was implemented to evaluate whether the level of IgG N-glycosylation influenced the metabolic trait (Explanation 1). To robustly test Explanation 2, reverse MR analysis was performed to appraise whether the metabolic trait affected the IgG N-glycosylation levels of interest. A P value > 0.05 indicated that Explanation 2 was unlikely in each instance. If there was bidirectional causality between IgG N-glycosylation and metabolic traits, with a P value < 0.05 under both forward and reverse MR settings, then these findings were interpreted as supporting Explanation 3—that is, that there is significant causality between IgG N-glycosylation and metabolic traits in both the forward and reverse MR, and that bidirectional regulation is carried out through different pathogenic pathways. When the P value was > 0.05 in both the forward and reverse MR, these results were identified as supporting Explanation 4.
《Fig. 1》

Fig. 1. Analysis pipeline to evaluate explanations for observed associations between IgG N-glycosylation and metabolic traits. This flowchart provides an overview of the analysis plan for evaluating four different explanations that might explain trait-associated glycan-QTLs.
《3. Results》
3. Results
《3.1. Characteristics of genetic variants as IVs for IgG N-glycans and metabolic traits》
3.1. Characteristics of genetic variants as IVs for IgG N-glycans and metabolic traits
IgG N-glycan-QTLs analysis was conducted to explore the relationship between SNPs and IgG N-glycans in 536 participants with available genetic variants and IgG N-glycosylation data. The mean age of the participants was 48 (range, 43–51) years, comprising 169 males (31.53%) and 367 females (68.47%) (Table S1 in Appendix A). A total of 5661 IgG N-glycan-QTL SNPs and metabolic-QTL SNPs at P < 1 × 10⁻⁵ were identified, and overlapping SNP as IVs for either IgG N-glycans or metabolic traits were not found. Finally, 1167 IgG N-glycan-QTL SNPs were used as IVs for IgG N-glycans in one-sample MR studies, and the mean ± SD of R2 and the F-statistics for each QTL were found to be (4.30 ± 0.86)% and 24.04 ± 5.15, respectively (Table S2 in Appendix A). Notably, the number of selected IgG N-glycan-QTL SNPs was reduced from 1167 to 348 after IVs-exposure matching with IVs-outcome in the two-sample MR setting (Table S2). In the one-sample study, 647 metabolic-QTL SNPs were used as IVs for metabolic traits, and the mean ± SD of R2 and the F-statistics for each QTL were found to be (4.49 ± 0.98)% and 25.18 ± 5.85, respectively (Table S3 in Appendix A). In the two-sample study, 231 metabolic-QTL SNPs were used as IVs for metabolic traits, and the mean ± SD of R2 and the F-statistics for each QTL were found to be (0.11 ± 0.28)% and 106.04 ± 240.93, respectively (Table S4 in Appendix A). More details about the number of IgG N-glycanQTL/metabolic-QTL SNPs used as IVs in the analysis of each phenotype (IgG N-glycans or metabolic traits) in the bidirectional MR analyses are presented in Fig. 2 and Tables S2–S4. Furthermore, the mean ± SD proportions of power for the one- and twosample forward MR analyses were found to be (41.11 ± 33.76)% and (21.04 ± 19.34)%, respectively. In addition, the mean ± SD proportions of power for the one- and two-sample reverse-direction MR analyses were found to be (50.48 ± 36.31)% and (12.29 ± 10.00)%, respectively. More information is available in Table S5 in Appendix A. Moreover, QTL SNPs were used as IVs for IgG N-glycans, metabolic traits, and CRP in the multivariable MR analysis and are presented in Tables S6 and S7 in Appendix A.
《Fig. 2》

Fig. 2. The number of SNPs was included in the analysis of each phenotype in the bidirectional one- and two-sample MR analyses. (a) Forward MR analyses; (b) reverse MR analyses.
《3.2. Inferring putative forward causal associations》
3.2. Inferring putative forward causal associations
We evaluated the causal estimates of IgG N-glycosylation with metabolic traits through bidirectional MR analysis. For forward MR analysis, IgG N-glycan-QTL SNPs were used as instruments for IgG N-glycans to test the putative causal influences of IgG Nglycosylation on metabolic traits. In the main MR analyses (IVW method), we observed that 66 and 15 genetically determined IgG N-glycans were associated with metabolic traits in the one- and two-sample forward MR studies, respectively (all P < 0.05). The mean ± SD proportions of power based on the aforementioned significance statistical results in the one- and two-sample studies were (82.56 ± 15.87)% and (71.42 ± 15.32)%, respectively (Table S5). We appraised the pleiotropic bias and retained only those IgG N-glycans with little evidence of pleiotropy for further investigation (MR-Egger intercept: P > 0.05; MR-PRESSO global test: PFDR > 0.05). After controlling for pleiotropic bias, 59 genetically determined IgG N-glycans were identified to be associated with metabolic traits in the forward one-sample MR analysis (all P < 0.05), including nine putatively causal GPs for BMI (GP1, GP7, GP11, etc.), seven for FPG (GP1, GP5, GP12, etc.), six for SBP (GP10, GP13, GP14, etc.), seven for DBP (GP2, GP12, GP13, etc.), ten for HDL-C (GP1, GP2, GP6, etc.), seven for LDL-C (GP3, GP4, GP12, etc.), seven for TG (GP2, GP5, GP10, etc.), and six for TC (GP3, GP4, GP12, etc.) (Figs. 3(a)–(g) and Tables S8–S15 in Appendix A). In parallel, 15 genetically determined IgG N-glycans were associated with metabolic traits in the forward two-sample MR study (all P < 0.05), including five putatively causal GPs for BMI (GP2, GP11, GP13, GP14, and GP24), four for FPG (GP1, GP10, GP16, and GP18), two for SBP (GP6 and GP23), one for DBP (GP6), one for LDL-C (GP11), one for TG (GP6), and one for TC (GP6) (Fig. 3(h) and Tables S8–S15).
《Fig. 3》
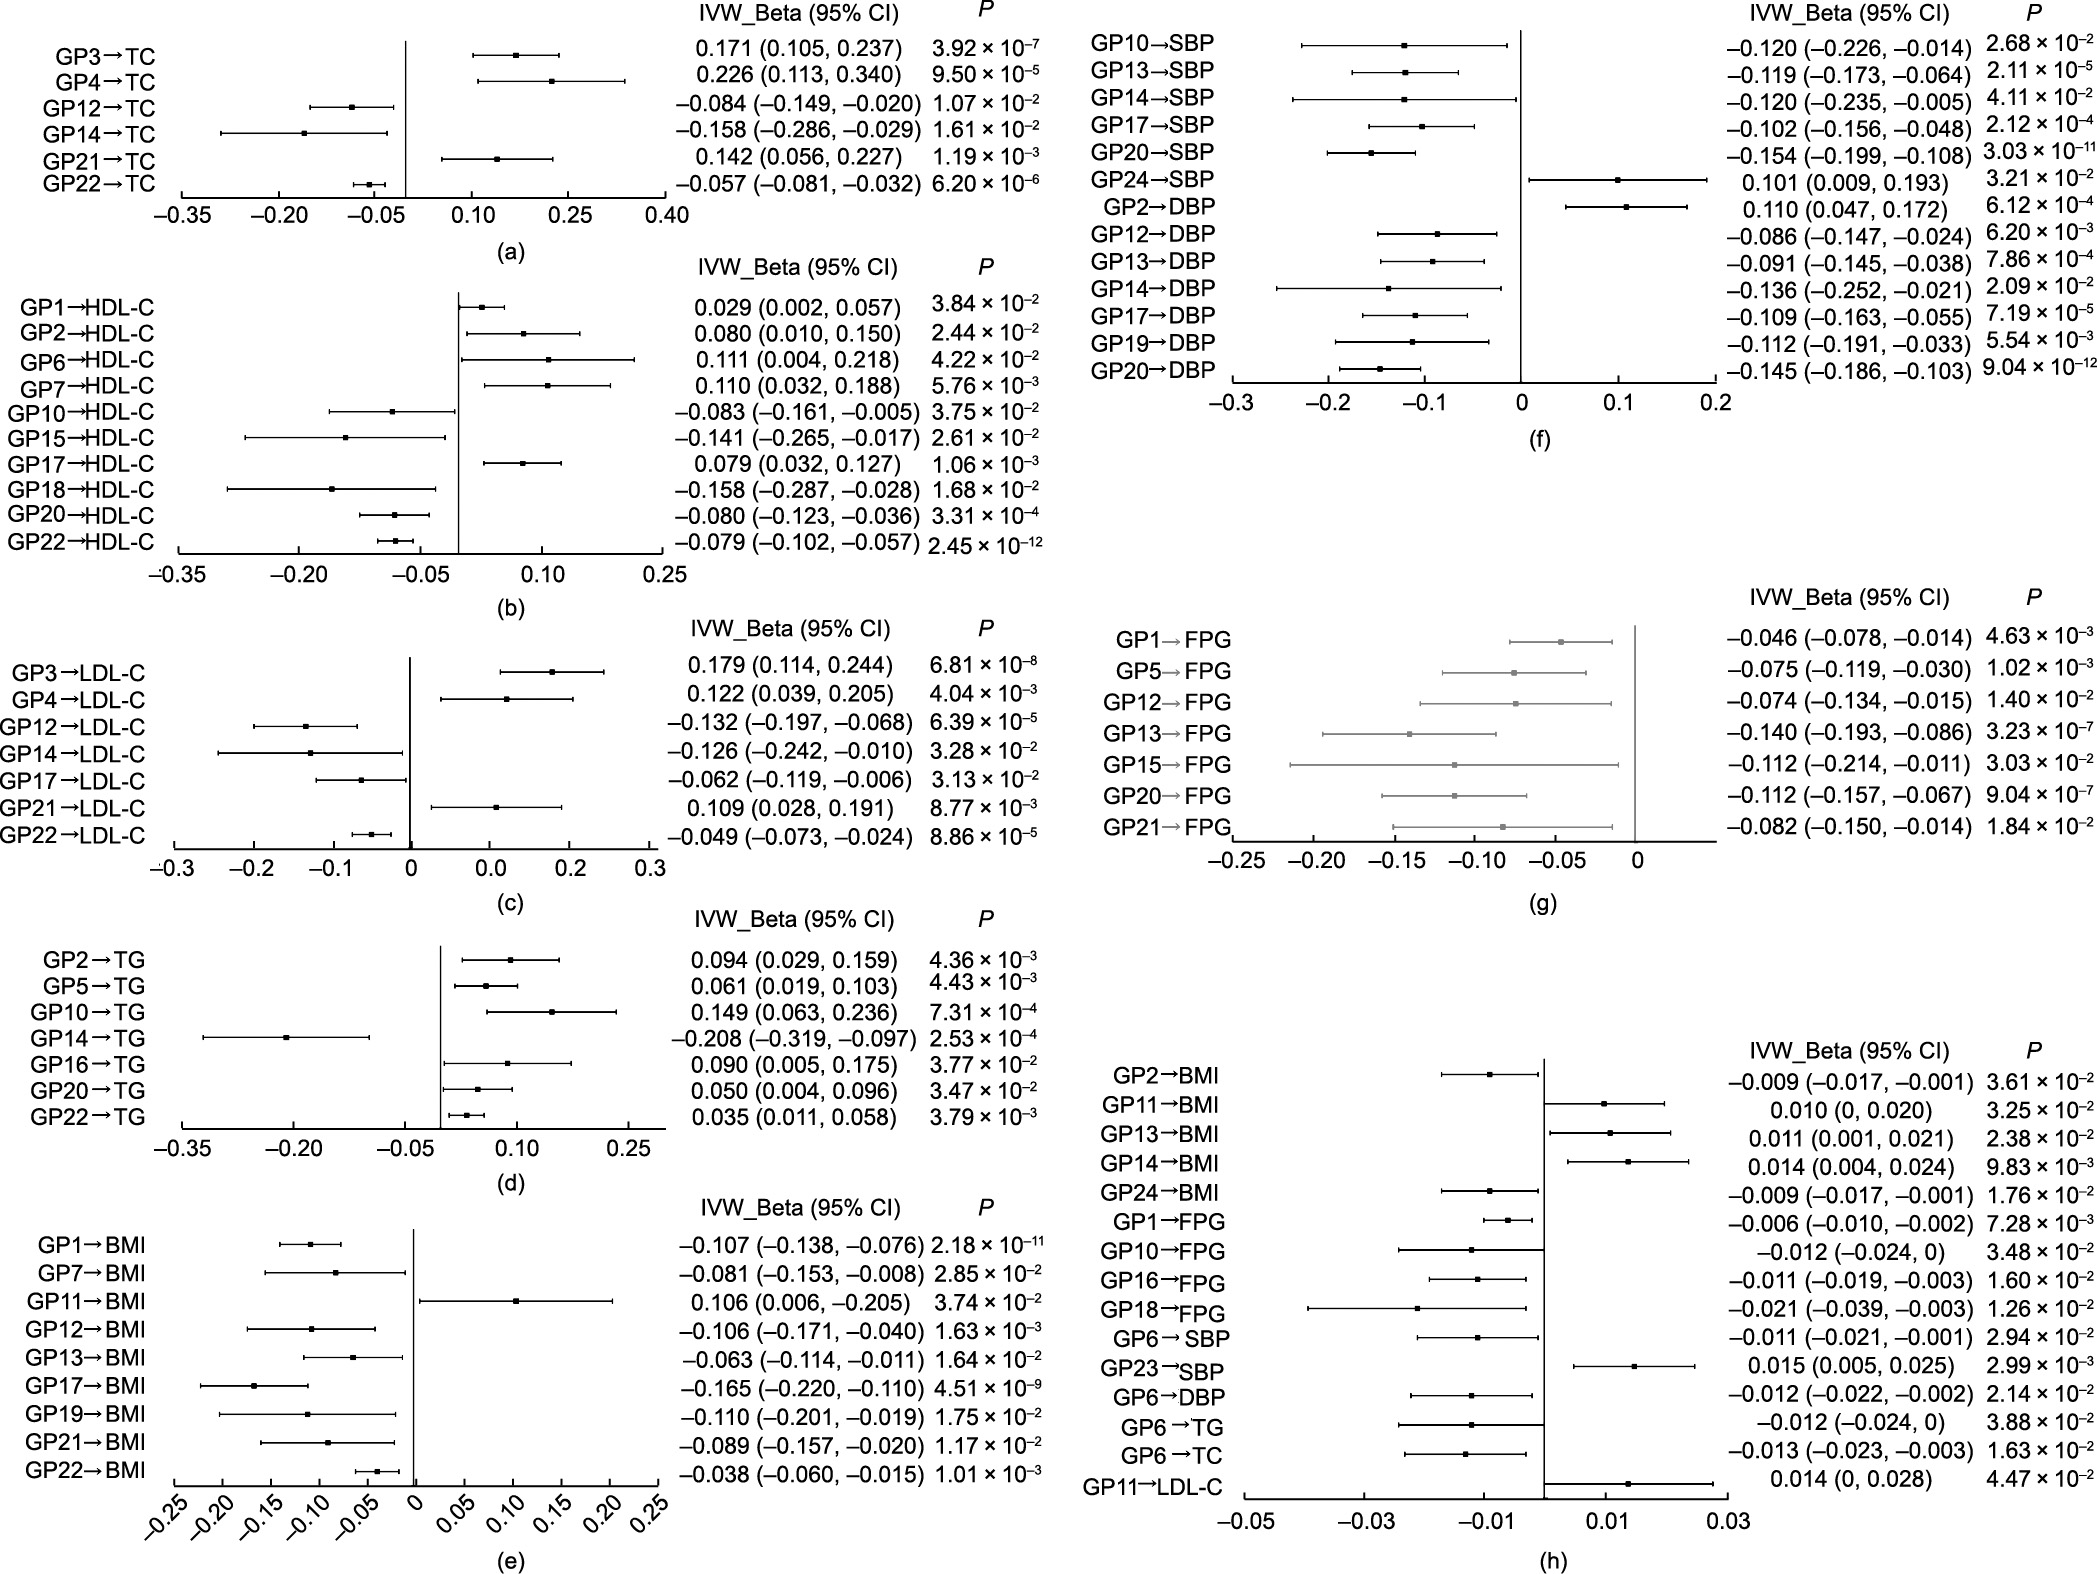
Fig. 3. Causal associations of IgG N-glycosylation with metabolic traits from the primary analysis (IVW) in the forward MR estimates. In one-sample MR analysis for (a) glycans and TC, (b) glycans and HDL-C, (c) glycans and LDL-C, (d) glycans and TG, (e) glycans and BMI, (f) glycans and BP, and (g) glycans and FPG; in two-sample MR analysis for (h) glycans and metabolic traits. P < 0.05 was considered statistically significant.
Moreover, upon further controlling for pleiotropic bias and FDR, we found that 36 genetically determined IgG N-glycans were associated with metabolic traits in the forward one-sample MR analysis (PFDR < 0.05), including four putatively causal GPs for BMI (GP1, GP12, GP17, and GP22), four for FPG (GP1, GP5, GP13, and GP20), three for SBP (GP13, GP17, and GP20), six for DBP (GP2, GP12, GP13, GP17, GP19, and GP20), four for HDL-C (GP7, GP17, GP20, and GP22), five for LDL-C (GP3, GP4, GP12, GP21, and GP22), five for TG (GP2, GP5, GP10, GP14, and GP22), and five for TC (GP3, GP4, GP12, GP21, and GP22) (Table 1 and Tables S8–S15). No glycan-metabolic trait association was observed in the twosample MR study (PFDR > 0.05) (Tables S8–S15). Effect estimates were broadly consistent between the IVW method and the sensitivity analyses based on robust MR methods in the one-sample MR (WM method, MR-Egger regression, and MR.RAPS method) and two-sample MR settings (WM method and MR-Egger regression) (Table 1 and Tables S8–S15). Furthermore, after controlling for the effect of pleiotropic bias and FDR, the results of the multivariable MR analysis showed that the number of genetically determined IgG N-glycans associated with metabolic traits decreased from 36 (the results of the above univariate MR analysis) to 26 in the forward one-sample setting (Fig. S2 and Table S16 in Appendix A). We further observed that 14 new IgG N-glycans and metabolic traits associations were identified in the multivariable MR analysis compared with the univariate MR results, including one putatively causal GPs for BMI (GP19), four for SBP (GP1, GP5, GP12, and GP15), two for DBP (GP14 and GP15), three for FPG (GP6, GP12, and GP15), two for TC (GP5 and GP7), one for HDL-C (GP4), and one for LDL-C (GP5) (Fig. S3(a) in Appendix A). The effect estimates and more details on specific glycans associated with metabolic traits are presented in Fig. S3 and Table S16 in Appendix A.
《Table 1》
Table 1 Causal association of IgG N-glycans with metabolic traits in the forward one-sample MR analysis.

Bold font indicates statistical significance at P < 0.05 based on pleiotropy bias (MR-Egger intercept: P > 0.05; MR-PRESSO global test: PFDR > 0.05); P < 0.05 was considered statistically significant. PFDR: adjusted for FDR using the BH method.
The results of the meta-analysis between one- and two-sample MR identified ten suggestive pieces of evidence for a potential association between IgG N-glycans and metabolic traits (P < 0.05), while only one potential association (GP23 → SBP) was observed (P < 0.0021) in the forward MR analysis (Table S17 in Appendix A). Furthermore, it is worth noting that there were three overlapping suggestive causal associations of metabolic traits with IgG N-glycans (GP11 → BMI, GP13 → BMI, and GP1 → FPG) between the one- and two-sample forward MR studies (P < 0.05) (Table 2). Of these, the results of the meta-analysis further confirmed a positive causal association between GP11 and BMI (fixed-effects model-Beta with 95% CI: 0.0109 (0.0012, 0.0207)) (Table S17). Genetically determined GP1 was identified to be associated with FPG in both the one- and two-sample forward MR settings (fixed-effects model-Beta with SE: –0.046 (0.016) and –0.006 (0.002)); the findings were robust using the WM method and the MR-Egger regression in the one-sample MR analysis (Beta with SE: –0.063 (0.021) and –0.078 (0.030)) and using the WM method in the two-sample MR analysis (Beta with SE: –0.008 (0.003)). In addition, the leave-one-out analysis for the association between GP1 and FPG showed that no outlying genetic variant had a significant influence on the estimate (Figs. S4 and S5 in Appendix A).
《Table 2》
Table 2 Overlapping potential causal associations of metabolic traits with IgG N-glycans between one- and two-sample MR studies.
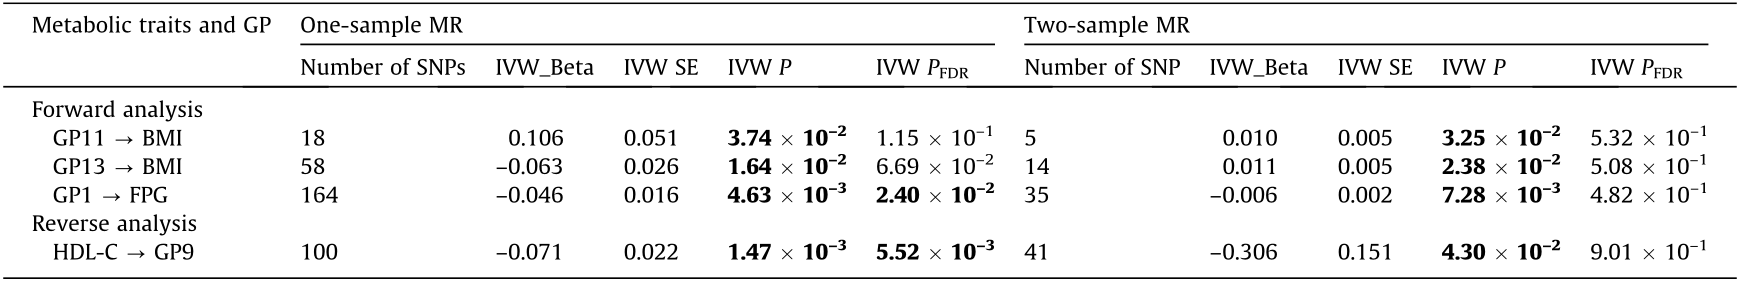
Bold font indicates statistical significance at P < 0.05 based on pleiotropy bias (MR-Egger intercept: P > 0.05; MR-PRESSO global test: PFDR > 0.05); IVW P and IVW PFDR for the association between the metabolic traits and IgG N-glycans, and a value < 0.05 was considered statistically significant.
IVW PFDR: adjusted for FDR in IVW results using the BH method.
《3.3. Inferring putative reverse causal associations》
3.3. Inferring putative reverse causal associations
Taking these putative associations forward, we assessed the potential causal associations by conducting a reverse MR of the metabolic measurements against the IgG N-glycosylation levels by selecting the metabolic-QTLs as IVs for metabolic measurements. For the reverse MR analysis, in the main MR analyses (IVW method), 82 and four genetically determined metabolic traits were identified as being related to the risk of IgG N-glycosylation in the one- and two-sample MR studies, respectively (all P < 0.05). The mean ± SD proportions of power based on the aforementioned significance statistical results in the one-sample and two-sample studies were found to be (87.77 ± 15.32)% and (46.87 ± 9.87)%, respectively (Table S5). After application of the pleiotropic bias test (MR-Egger intercept: P > 0.05 ; MR-PRESSO global test: PFDR > 0.05), 72 metabolic trait–glycan associations were retained in the reverse one-sample MR study (all P < 0.05), including one putatively causal metabolic trait for GP1 (HDL-C), five for GP2 (FPG, SBP, HDL-C, etc.), two for GP3 (LDL-C and TC), four for GP4 (FPG, LDL-C, etc.), two for GP5 (FPG and SBP), five for GP6 (FPG, HDL-C, etc.), two for GP7 (FPG and DBP), two for GP8 (HDL-C and TG), three for GP9 (FPG, HDL-C, and LDL-C), two for GP10 (FPG and TG), three for GP11 (HDL-C, LDL-C, and TG), four for GP12 (FPG, DBP, etc.), four for GP13 (FPG, SBP, etc.), four for GP14 (FPG, HDL-C, etc.), one for GP15 (FPG), four for GP16 (FPG, TG, etc.), five for GP17 (BMI, FPG, etc.), five for GP18 (FPG, HDL-C, etc.), two for GP19 (BMI and TG), three for GP20 (FPG, DBP, and HDL-C), one for GP21 (TG), five for GP22 (BMI, DBP, etc.), one for GP23 (TC), and two for GP24 (HDL-C and TG) (Figs. 4(a)–(g) and Tables S18–S25 in Appendix A). In addition, four genetically determined metabolic traits were retained that were associated with IgG N-glycans in the reverse two-sample MR study (all P < 0.05), including one putatively causal metabolic trait for GP3 (HDL-C), one for GP9 (HDL-C), one for GP16 (TC), and one for GP20 (LDLC) (Fig. 4(h) and Tables S18–S25).
《Fig. 4》
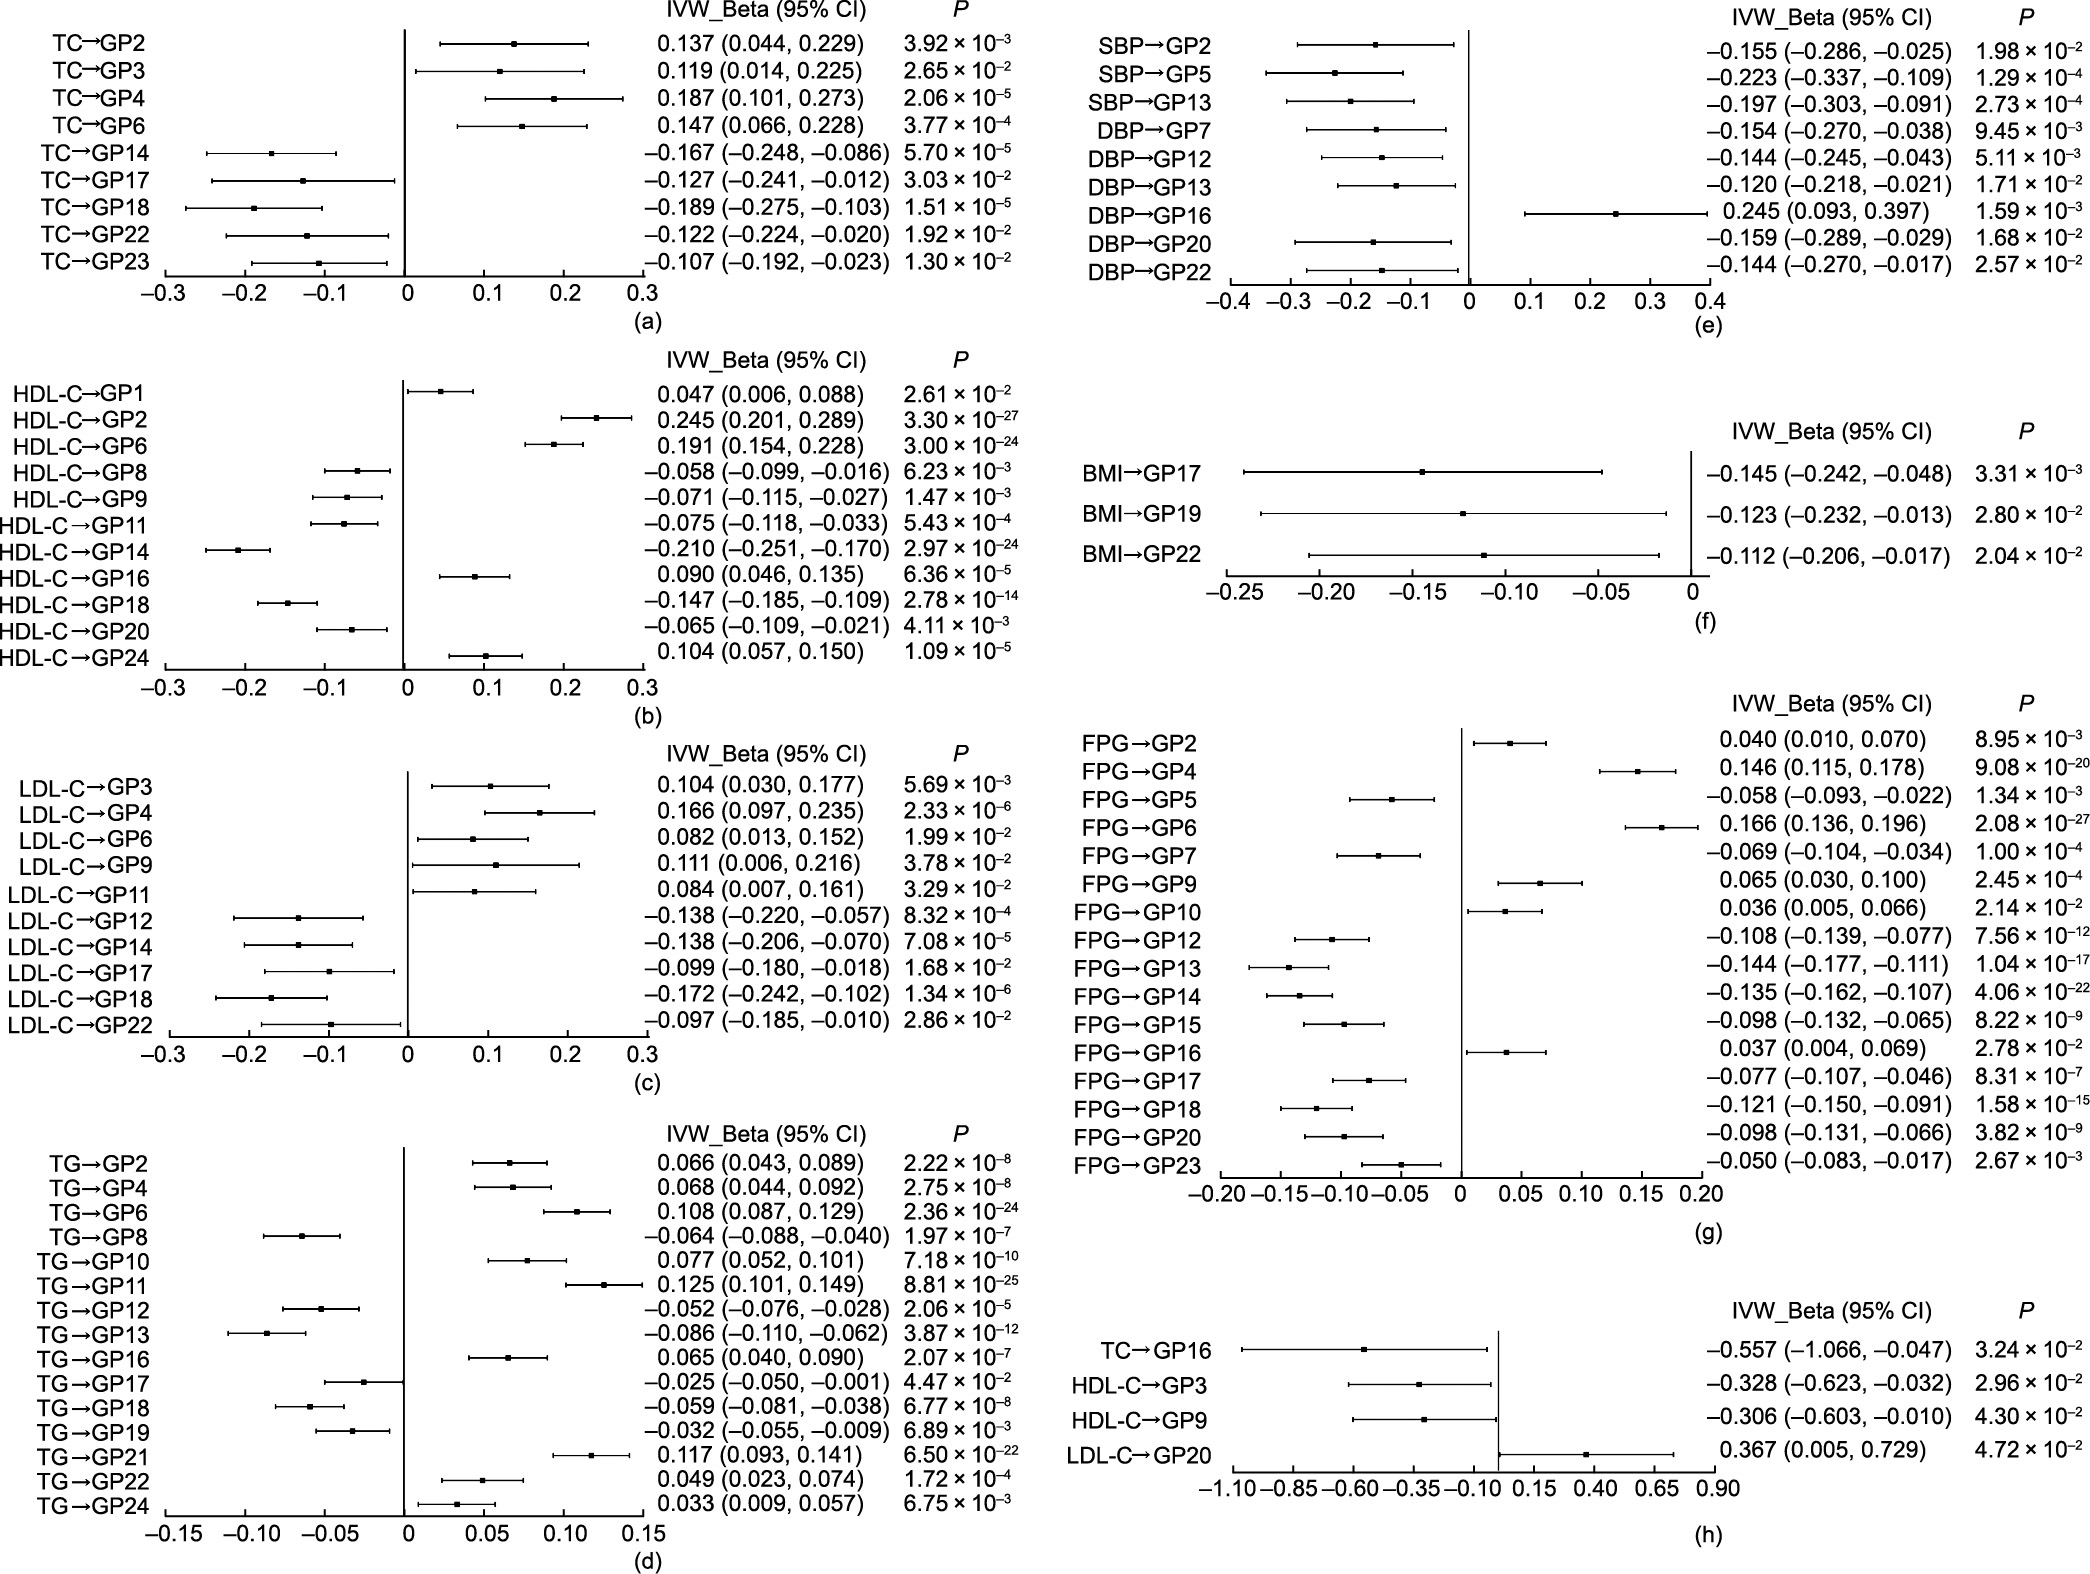
Fig. 4. Causal associations of metabolic traits and IgG N-glycosylation from the primary analysis (IVW) in the reverse MR estimates. In one-sample MR analysis for (a) TC and glycans, (b) HDL-C and glycans, (c) LDL-C and glycans, (d) TG and glycans, (e) BP and glycans, (f) BMI and glycans, and (g) FPG and glycans; in two-sample MR analysis for (h) lipids and glycans. P < 0.05 was considered statistically significant.
Furthermore, to further control the FDR, the number of metabolic trait–glycan associations was reduced to 57 in the reverse one-sample MR analysis (PFDR < 0.05), including four putatively causal metabolic traits for GP2 (FPG, HDL-C, etc.), one for GP3 (LDL-C), four for GP4 (FPG, LDL-C, etc.), two for GP5 (FPG and SBP), four for GP6 (FPG, HDL-C, etc.), two for GP7 (FPG and DBP), two for GP8 (HDL-C and TG), two for GP9 (FPG and HDL-C), one for GP10 (TG), two for GP11 (HDL-C and TG), four for GP12 (FPG, DBP, etc.), four for GP13 (FPG, SBP, etc.), four for GP14 (FPG, HDL-C, etc.), one for GP15 (FPG), three for GP16 (DBP, HDL-C, and TG), three for GP17 (BMI, FPG, and LDL-C), five for GP18 (FPG, HDL-C, etc.), one for GP19 (TG), three for GP20 (FPG, DBP, and HDL-C), one for GP21 (TG), one for GP22 (TG), one for GP23 (TC), and two for GP24 (HDL-C and TG) (Tables S18–S25). Similar to the condition of the forward two-sample MR, no metabolic trait–glycan association was observed in the reverse two-sample MR study (PFDR > 0.05) (Table 3 and Tables S18–S25). Effect estimates were broadly consistent between the IVW method and the sensitivity analyses based on robust MR methods in the onesample MR (WM method, MR-Egger regression, and MR.RAPS method) and two-sample MR settings (WM method and MREgger regression) (Table 3 and Tables S18–S25).
《Table 3》
Table 3 Causal association of metabolic traits with IgG N-glycans in the reverse one-sample MR analysis.
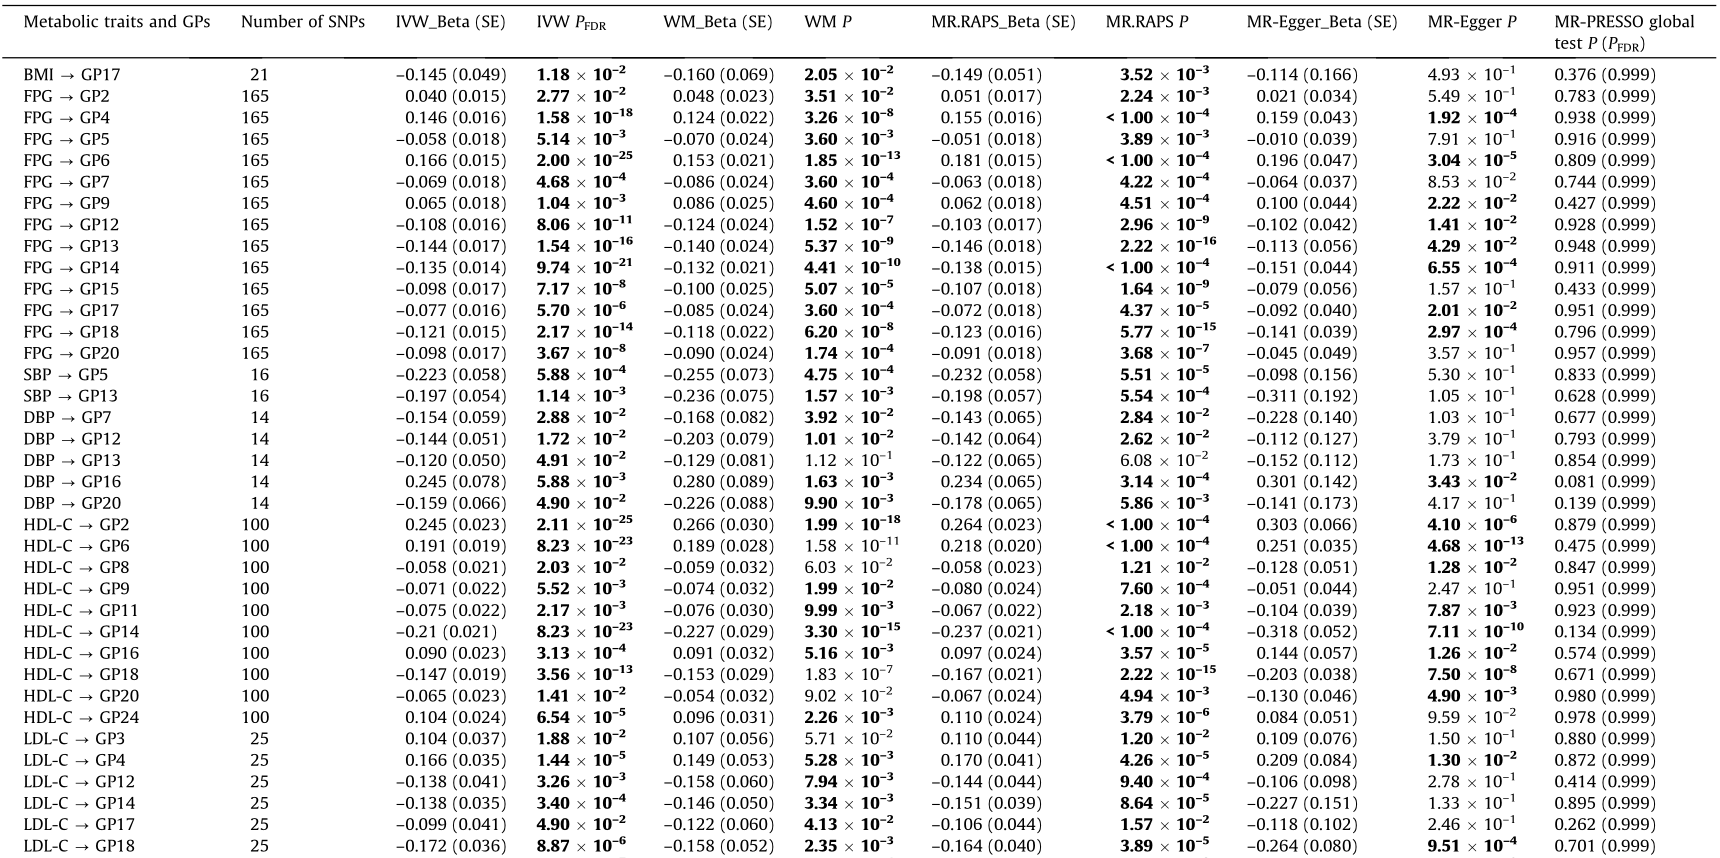
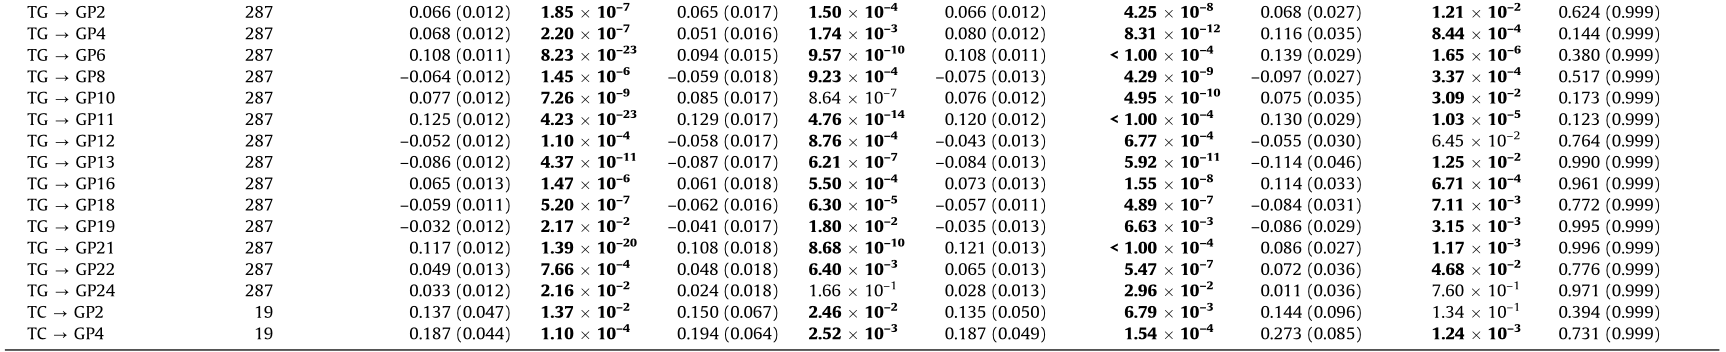

Bold font indicates statistical significance at P < 0.05 based on pleiotropy bias (MR-Egger intercept: P > 0.05; MR-PRESSO global test: PFDR > 0.05); P < 0.05 was considered statistically significant.
PFDR: adjusted for FDR using the BH method.
In addition, in the reverse one-sample MR setting, we observed that the number of metabolic trait–glycan associations was reduced from 57 (i.e., the aforementioned univariate MR results) to 41 based on the multivariable MR analysis (Table S16 and Fig. S6 in Appendix A). More specifically, upon controlling for pleiotropic bias and FDR, the results based on the multivariate MR method identified 12 new metabolic trait–glycan associations compared with those of the univariate MR analysis, including two putatively causal metabolic traits for GP7 (SBP and HDL-C), two for GP11 (FPG and TC), one for GP12 (SBP), one for GP13 (HDL-C), one for GP14 (TG), two for GP15 (SBP and HDL-C), one for GP17 (HDL-C), one for GP20 (SBP), and one for GP22 (FPG) (Fig. S3(b)). Notably, the number of meaningful results between IgG N-glycans and metabolic traits obtained by the multivariate MR method was generally lower than that of the aforementioned univariate analysis in the bidirectional one-sample MR settings, but most of them could be replicated (Figs. 3 and 4 and Figs. S2 and S6).
According to the results of the meta-analysis between the oneand two-sample MR, 45 potential associations of metabolic traits with IgG N-glycans were identified (P < 0.0021) in the reverse MR analysis (Table S26 in Appendix A). Notably, there was only one overlapping potential causal association of metabolic traits with IgG N-glycans between the one- and two-sample reverse MR studies (P < 0.05; Table 2). Genetically determined HDL-C was identified to be negatively associated with GP9 (fixed-effects modelBeta with SE: –0.071 (0.022) and –0.306 (0.151)) in both the one- and two-sample MR settings, which was confirmed by the results of the meta-analysis (fixed-effects model-Beta with 95% CI: –0.0759 (–0.1186, –0.0332)) (Table S26).
《3.4. Functional informatics》
3.4. Functional informatics
Although it is widely hypothesized that genetic variants influence glycosylation, the molecular regulatory mechanism of IgG N-glycosylation is not fully understood. In this research, IgG N-glycan-QTL SNPs were annotated to 553 unique located genes (Tables S2 and S27 in Appendix A). A GO enrichment analysis, which was intended to identify molecular function, biological process, and cellular component pathways, suggested that the identified genes were involved in 20 GO terms (Fig. 5), such as chemical synaptic transmission, regulation of transmembrane transport, cell junction organization, receptor localization to synapse, and regulation of membrane potential.
《Fig. 5》

Fig. 5. Characteristics of the enriched GO terms.
Some of the tagged genes are known to encode glycosylation transferases, including EXT2 , GMDS , ST6GAL1 , B4GALT1, and UTS2, which are involved in the N-glycan biosynthesis/complex type. In Table S28 in Appendix A, the results show that most of the genes are involved in positive regulation of chemical synaptic transmission, cellular component morphogenesis, cell junction organization, and actin filament-based processes (7.62%, 7.62%, 7.06%, and 7.25%, respectively), indicating that these genes—such as MCTP2 , RIMS1 , ITSN1 , GRIN3A , DLGAP2 , DLGAP1 , TTN , ACTC1 , ANTXR1 , HOMER1 , PTK2B , MYCBP2 , PRKN , IFT172, and PTPRD—might play important roles in modifying IgG glycosylation. Further functional experiments are needed to reveal the molecular regulatory mechanism of the above pathways in IgG N-glycosylation. Our research might prove valuable in helping subsequent studies prioritize candidate genes of IgG N-glycosylation for in-depth functional followup studies.
《4. Discussion》
4. Discussion
This study adopted a novel analytical framework in which bidirectional one- and two-sample MR analyses integrating GWASs and IgG N-glycan-QTLs data enabled the identification of causal associations between IgG N-glycosylation and metabolic traits in East Asians. In fact, a one-sample MR study is usually underpowered in a setting with small effect sizes and may result in a type II error. Although a two-sample MR study with a large sample size is unlikely to suffer from the aforementioned bias, it may present bias in terms of population stratification. To address these issues, one- and two-sample MR methods were used in the current study in order to comprehensively investigate causality. Suggestive evidence for bidirectional causality between IgG N-glycans and metabolic traits in the current study might have been supported by the one- and two-sample MR results based on the data from a previous glycan-related study [33] and a large-scale GWAS in a Japanese population [43]. However, the relationship between each pair of IgG N-glycans and metabolic traits was not completely consistent in the different settings of MR analyses. In the forward MR analysis, the one-sample MR provided potential evidence that IgG N-glycans were associated with BMI, FPG, BP, and lipid traits. This result was confirmed in the two-sample setting, further evidencing the causal relationship between IgG N-glycans and metabolic traits. Furthermore, the number of meaningful associations was generally found to be lower in the multivariate MR analysis than in the univariate analysis in the bidirectional one-sample MR setting; however, most of them could be replicated. The multivariate MR analysis further identified some new metabolic trait–glycan/(glycan– metabolic trait) associations, indicating that an inflammatory molecule (CRP) may mediate the causality between IgG N-glycans and metabolic traits to some extent.
The main function of IgG—which is largely affected by glycosylation—is regulation of the systemic inflammation balance at multiple levels, and the alteration of IgG N-glycans plays a crucial role in the pro- or anti-inflammatory process [6,45]. An imbalance between pro- and anti-inflammatory activities leads to the activation of multiple signal transduction pathways, the production of inflammatory cytokine chemokines, and cell migration, which in sequence cause the development of metabolic dysfunction [46,47]. In addition, due to the key role of IgG N-glycans in signal transduction [48], the levels of IgG N-glycans directly and objectively reflect the metabolism status. A previous study showed that the plasma N-glycome could represent alterations in metabolic Table 3 activity in humans [48], and our forward MR results further demonstrate that IgG N-glycans may have causal effects on metabolic processes.
Significant associations between metabolic traits and IgG N-glycans were also observed in the reverse MR analysis in both the one- and two-sample settings, which indicates that metabolic traits may also have causal effects on the IgG N-glycosylation process. Glycosylation is reflected at the molecular level in a wide range of genetic influences and environmental exposures [29,49,50]. Alternative IgG N-glycosylation plays a prominent role in complement activation by modulating complement-dependent cytotoxicity and antibody-dependent cellular cytotoxicity (ADCC), which indicates that altered IgG N-glycosylation could be a part of the molecular mechanism underlying pro-inflammation [7,45]. Chronic inflammation—an important hallmark of metabolic dysfunction—can regulate metabolic function and trigger metabolic disorders [51–53]. Metabolic dysfunction involves insulin resistance, abnormal lipid metabolism, an impaired immune response affecting both innate and adaptive immunity, and regulation of cytokine secretion, which can produce and secrete a variety of inflammatory molecules, including interleukin-1 receptor-associated kinase 1 and tumor necrosis factor-α [51,53]. Inflammatory molecules might in turn regulate the IgG N-glycosylation process. The findings of the reverse MR suggest that metabolic traits might affect IgG N-glycosylation, which influences the immune and inflammatory function of IgG.
The study showed that three pairs of glycan–metabolic trait associations (i.e., GP11 → BMI, GP13 → BMI, and GP1 → FPG) and one pair of metabolic trait–glycan associations (i.e., HDL-C → GP9) were statistically significant in the bidirectional one- and two-sample MR estimates, respectively. Interestingly, the results of the meta-analysis provided further evidence of potential bidirectional causal associations between glycans and metabolic traits (i.e., GP11 → BMI and HDL-C → GP9). The results showed that the effect size of the aforementioned one-sample MR was generally larger than that of the two-sample MR, which might be caused by the fact that there were more IVs included in the one-sample MR than in the two-sample MR setting. To be specific, the findings showed completely consistent evidence for higher levels of IgG N-glycans (GP11) leading to higher levels of BMI and for higher levels of IgG N-glycans (GP1) leading to lower levels of FPG in the forward one- and two-sample MR analyses. In the reverse one- and two-sample MR analyses, completely consistent evidence was presented showing that lower levels of HDL-C lead to higher levels of IgG N-glycans (GP9). IgG N-glycans contain typical biantennary complexes—namely, fucose, galactose, bisecting GlcNAc, and sialic acid—which can inhibit or activate IgG Fc receptors by regulating the binding affinity of IgG, thereby decisively modulating the pro- and anti-inflammatory activities of IgG [54,55]. Fucosylation (GP1, GP9, and GP11) and galactosylation (GP9 and GP11) play vital roles in the inflammatory activities of IgG, and highly fucosylated IgG presents a reduced magnitude of ADCC leading to an anti-inflammatory status of the body. The inverse correlation found between galactosylated and/or corefucosylated IgG glycoforms (GP1 and GP9) and metabolic traits (FPG and HDL-C) in the present study was somewhat expected and was consistent with the alterations of IgG N-glycosylation presented in studies on hypertension [14], T2DM [16], and dyslipidemia [13].
Metabolic trait components include BMI, FPG, BP, and lipids, with the corresponding abnormal conditions being obesity, T2DM, hypertension, and dyslipidemia. These abnormal conditions have been documented as modifiable risk factors for cerebrovascular and cardiovascular diseases (CVDs) and are related to an increased risk of CVDs [56]. In addition, abundant evidence suggests that the inflammatory function of IgG N-glycans is a risk factor for many chronic diseases and accompanies the development of specific health issues, including obesity, hypertension, T2DM, metabolic syndrome, dyslipidemia, and ischemic stroke [12– 15,42,48,57]. The forward MR in the present study confirmed that GPs have a potential causal effect on metabolic traits. Conversely, the causal associations between metabolic traits and GPs found in the reverse MR suggest that IgG N-glycans are likely to be driven by metabolic traits. Therefore, the effects of the bidirectional association that was found between IgG N-glycans and metabolic traits might be attributed to Explanation 3—that is, that there is bidirectional causality between IgG N-glycosylation and metabolic traits through independent biological pathways—further suggesting that reciprocal regulation and coexistence between IgG N-glycans and metabolic traits might accelerate the progression of CVDs.
The comprehensive IgG N-glycan-QTL resources utilized in our study present plentiful information about genetic effects on IgG N-glycans. Apart from some identified IgG N-glycan-QTL tagging genes that are known to be glycosylation enzymes regulating translational initiation, some novel loci tagging genes are involved in glycosylation via metabolic mechanisms rather than directly. For example, INSR, which encodes a member of the receptor tyrosine kinase family of proteins, regulates glucose uptake and release and activates the insulin signaling pathway [58]. In addition, some genes are involved in the regulation of the lipid metabolism pathway, such as elongation of very long-chain fatty acid (ELOVL) elongase 6 gene (ELOVL6) [59] and lipase C, hepatic type gene (LIPC) [60]. These novel genes are very biologically relevant in metabolic disorders, which suggests mechanisms for the regulation of IgG N-glycans and indicates that certain network connections need to be validated in in vitro functional studies.
The present bidirectional MR further dissected the directionally causal association between IgG N-glycans and metabolic traits, which may allow networks of related phenotypes. Because QTLs were shown to have a robust effect on exposure, our bidirectional MR analysis integrating a GWAS and QTL data may have been relatively less affected by bias, and the use of multiple independent QTL variants as IVs may have increased the proportion of the variance in exposures (i.e., IgG N-glycans or metabolic traits). Nevertheless, this study has several limitations, and the findings should be interpreted with caution. Firstly, there is inevitable concern that the small sample size in the one-sample MR analysis is likely to underpower the detection of genetic associations for IgG N-glycosylation, as judged by the latest studies in European populations. Admittedly, the one- and two-sample MR have their own strengths and limitations. Thus, one- and two-sample MR analyses were performed to confirm our findings, and the results were complementary, suggesting that the finding is robust. In addition, compared with recently published studies [61,62], the statistical powers of the present study were acceptable, at 82.56% and 71.42% in the one- and two-sample forward MR analyses, respectively, and 87.77% and 46.87% in the one- and two-sample reverse MR settings, respectively. The number of IgG N-glycan-QTL SNPs used in the one-sample MR analysis (n = 1167) was larger than that used in the two-sample MR analysis (n = 348), which might result in the statistical power being greater in the one-sample MR study than in the two-sample MR study. Secondly, for the limited sample size of IgG N-glycan-QTLs (n = 536), a relatively relaxed threshold of 1 × 10⁻⁵ was used for the selection of IVs in the one-sample MR analysis, which may have led to biased estimates—especially a weak IV bias. To reduce weak IVs, the MR.RAPS results were also reported to make the results more robust [41]. Thirdly, the research data used in this study were obtained from Xuanwu Hospital, Capital Medical University, Beijing, China and Biobank Japan, which were a community-based survey and a patientbased cohort study, respectively. This choice of data may have led to potential selection bias when subjects were included in this study, which may have affected the results of the study to some extent.
In this study, only the suggestive causal associations of three metabolic traits with four IgG N-glycans detected in the onesample MR round were considered to be statistically significant in the two-sample MR, and two pairs of causality were confirmed by meta-analysis. A possible explanation for the phenomenon that the one-sample MR results were not fully confirmed by the twosample MR results is that bias estimation was caused by population stratification in the two-sample MR study or by false positives in the one-sample MR study. Although we analyzed data based on the same studies in obtaining both SNP-IgG N-glycosylation and SNP-metabolic trait estimates while adjusting for the same covariates, other unrecognized or unmeasured confounding factors still cannot be completely excluded. Moreover, although pleiotropy was assessed by MR-Egger and MR-PRESSO analysis, the possibility of residual pleiotropic effects cannot be completely excluded. In addition, we only involved East Asian participants in the current study, so population stratification had little effect on the result. Nevertheless, our findings may be limited in their generalization to other ancestry groups. Therefore, it is necessary to conduct larger MR studies in multiethnic populations in order to examine causal inferences to further validate and replicate the association between IgG N-glycans and metabolic traits for personalized health monitoring and the prevention of metabolic-associated diseases. Finally, one of the challenges presented by all MR analyses is to completely eliminate an alternative direct causal effect—in this case, for IgG N-glycosylation and metabolic traits determined by both diverse environmental exposures and genetic variants.
《5. Conclusions》
5. Conclusions
In summary, the comprehensively bidirectional MR results presented here suggest potential bidirectional causality between IgG N-glycans and metabolic traits, and vice versa. According to our result, this causality might apply bidirectional regulation based on independent pathogenic mechanisms or pathways. The comprehensive IgG N-glycan-QTL resources used in this study and the potential causal metabolic traits uncovered herein delineate for the first time a richness of detail in relation to the regulation of IgG N-glycosylation, which may provide a theoretical basis for the future development and application of glycomedicine in metabolic diseases. A large-scale genome-wide scan for genetic variants of IgG N-glycan-related metabolites and further investigation to understand the molecular regulatory mechanism of IgG N-glycan-dependent metabolites in the development of CVDs are required.
《Acknowledgments》
Acknowledgments
Acknowledgments The study was supported by grants from the National Natural Science Foundation of China (81872682), the Young Taishan Scholars Program of Shandong Province of China (tsqn20161046), the Academic Promotion Programme of Shandong First Medical University (2019RC010), the Shandong Province Higher Educational Young and Innovation Technology Supporting Program (2019KJL004), and the Doctoral Scientific Research Foundation of Shandong First Medical University. The funding organization had the role in the design and conduct of the study and the collection, management, analysis, and interpretation of the data.
We thank all the research subjects for their participation. The Riken group reported the summary data. We would also like to acknowledge the skillful work of all medical staff at Xuanwu Hospital, Capital Medical University, Beijing, China.
《Authors’ contribution》
Authors’ contribution
Youxin Wang and Manshu Song contributed to the conception and design. Xiaomi Meng, Weijie Cao, Di Liu, Isinta Maranga Elijah, Weijia Xing, Haifeng Hou, Xizhu Xu, and Manshu Song contributed to the acquisition and analysis of the data. Xiaomi Meng, Weijie Cao, and Di Liu drafted the manuscript. All authors made important contributions to editing and critically revising the manuscript for important intellectual content. All authors have approved the final version to be published. Youxin Wang and Manshu Song guarantee this work, have full access to all of the data and take responsibility for the integrity of the data.
《Compliance with ethics guidelines》
Compliance with ethics guidelines
Xiaomi Meng, Weijie Cao, Di Liu, Isinta Maranga Elijah, Weijia Xing, Haifeng Hou, Xizhu Xu, Manshu Song, and Youxin Wang declare that they have no conflict of interest or financial conflicts to disclose.
《Appendix A. Supplementary data》
Appendix A. Supplementary data
Supplementary data to this article can be found online at https://doi.org/10.1016/j.eng.2022.11.004.


 京公网安备 11010502051620号


