
《1. Introduction》
1. Introduction
Colorectal cancer (CRC) is the third most commonly diagnosed cancer (10.2% of total cases) worldwide and the second leading cause of cancer death (9.2% of total cancer deaths) [1]. While CRC incidence and mortality rates are stabilizing or decreasing in highly developed countries due to the implementation of population screening, they are still rapidly increasing in developing countries [2,3]. Traditional treatments, such as chemotherapy, radiation therapy, and surgery, have limited success since most tumors are diagnosed when the disease is already at an advanced stage [4]. Moreover, screening methods still have limitations in terms of invasiveness, low sensitivity, and specificity, as well as high costs [5,6]. Recently, the selective elimination of cancer cells by the recognition of specific molecular targets on cancer cells has gained attention [4]. However, treatment failure and resistance are still high due to tumor heterogeneity [4], indicating the need to identify new specific targets for the development of new cancer therapies.
A promising direction is the study of aberrant glycosylation, which is known to be a hallmark of cancer [7]. More specifically, altered expression of N-glycosylation seems to play an important role in the development and progression of various cancers, including CRC and is involved in many biological processes, including cell signaling, cell adhesion, immune modulation, angiogenesis, metastasis, and invasion [8,9]. Changes in glycosylation may result from dysregulation of the expression or activity of the corresponding glycosyltransferases (GTs) and glycosidases, leading to the incomplete or neo-synthesis of aberrant glycan structures [10,11]. Previous research has revealed that the formation of bisected N-glycans is catalyzed by N-acetylglucosaminyltransferase (GnT)-III ,encoded by β-1,4-mannosyl-glycoprotein 4-β-N-acetylglucosaminyltransferase (MGAT3), whose high expression contributes to the inhibition of cancer metastasis [5,12]. In contrast, GnT-V, which is encoded by α-1,6-mannosylglycoprotein 6- β-N-acetylglucosaminyltransferase (MGAT5) and is responsible for the formation of the β1-6 N-acetylglucosamine (GlcNAc) branch of N-glycans, is a cancer-associated enzyme in direct competition with GnT-III [13]. In addition, high expression of α2-6 sialylation and sialyl-Lewis (sLe) structures has been found to be involved in cancer metastasis and associated with a poor prognosis of CRC [14,15].
With the advancement of mass spectrometry (MS), the Nglycosylation of CRC was widely studied in the last decade. Balog et al. [5] analyzed 2-aminobenzoic acid-labeled N-glycans in 13 pairs of CRC tissues and corresponding control colon tissues using a combination of hydrophilic interaction liquid chromatography (HILIC-LC), instead of with matrix-assisted laser desorption/ionization time-of-flight mass spectrometry (MALDI-TOF-MS), revealing the increased levels of sulfated N-glycans, paucimannosidic N-glycans, and N-glycans with a sLe structure, as well as decreased levels of bisected N-glycans in tumor tissues. Another study used porous graphitized carbon liquid chromatography (LC) electrospray ionization tandem mass spectrometry (PGC-LC-ESI-MS/MS) (in negative mode) to uncover the overexpression of oligomannosidic, hybrid, and paucimannosidic N-glycans, as well as N-glycans with α2-6 sialylation, while complex N-glycans and Nglycans with α2-3 sialylation in CRC tissues were found to be downregulated relative to adjacent non-tumorigenic tissues [16]. In addition, Coura et al. [17] found higher expression of oligomannosidic, diantennary hypogalactosylated, and branched N-glycans in CRC tissues compared with normal colonic tissue. These studies used homogenized tumor tissues, and no enrichment of specific cells of interest was performed prior to glycomic analysis. Although such analysis can mask cell-specific glycomic signatures, particularly in tumors with high infiltration of immune cells and stroma, similar patterns were found by the spatially resolved MS imaging of stage II CRC with a higher amount of sialylation and oligomannosidic N-glycans, and lower levels of fucosylation and highly branched N-glycans, in cancer compared with normal epithelial cells [2].
A recent study indicated that the N-glycomic signature of cancer spreads into the surrounding stroma at the invasive front of the tumor [2]. The tumor stroma consists of various non-neoplastic cells containing fibroblasts, immune cells, and endothelial cells [18], as well as connective tissue. The proportion of stroma within the tumor is considered to be a strong prognostic factor for CRC patients in stages II and III [19]. Therefore, in order to study the role of stroma in the pathogenesis of CRC and to search for specific cancer-associated glycans in CRC tissues, spatially resolved glycomics and detailed structural elucidation of isomeric glycans are prerequisites. To overcome the heterogeneity of tumor tissues for LC-MS studies, Hinneburg et al. [20] extracted the cells from the hepatic tumor and surrounding healthy tissue using laser capture microdissection (LCM) followed by a PGC-nanoLC-ESI-MS/MS glycomics approach for an in-depth characterization of the hepatic N- and O-glycome. Our work is based on this methodology, with considerable modifications to ensure higher throughput in a 96- well format, and is applied to reveal CRC-specific N-glycan signatures. Recently, our team discovered that highly specific sLe/Le core two O-glycans play a major role in the differentiation of CRC from healthy colon epithelium using LCM in combination with PGC-nanoLC-ESI-MS/MS [21].
In this study, we investigated the N-glycosylation of different regions of CRC, stroma, and normal colon mucosa for the discovery of specific CRC tumor-associated carbohydrate antigens (TACAs). The approach was applied to the same cohort used in a recently published study on O-glycomic signatures in CRC [21]. In brief, we used LCM to enrich cells from specific epithelial regions of primary tumors, tumor stroma, and corresponding healthy colon mucosa. An optimized high-throughput workflow was employed to release N-glycans from LCM formalin-fixed paraffin-embedded (FFPE) tissues. Subsequently, the measurement of the released N-glycans was performed on a PGC-LC-ESI-MS/MS platform using the negative ionization mode. This method enabled the effective separation and structural elucidation of isomeric N-glycans. A total of 116 N-glycans were identified that showed diverse expression in cancer, stroma, and normal mucosa. In addition, we propose a biosynthetic pathway of N-glycan expression in CRC based on the integration of the revealed N-glycosylation profiling with previously published gene expression data.
《2. Materials and methods》
2. Materials and methods
《2.1. Materials》
2.1. Materials
Trifluoroacetic acid (TFA), NaBH4, HCl, DL-dithiothreitol (DTT), cation-exchange resin Dowex 50W-X8, hematoxylin, tris(hydrox y-methyl)amino-methane, ammonium bicarbonate (ABC), ammonium acetate, and polyvinylpyrrolidone 40 (PVP-40) were obtained from Sigma Aldrich (USA). NaCl, ethanol (EtOH), and methanol (MeOH) were obtained from Merck (Germany). Solid-phase extraction (SPE) bulk sorbent Carbograph (S*pure extract-clean SPE bulk packing material, 38–125 μm) was acquired from BGB Analytik Benelux B.V. (the Netherlands). Acetonitrile LC-MS grade was purchased from Biosolve (the Netherlands). Glacial acetic acid and potassium hydroxide were obtained from Honeywell Fluka (USA). PNGase F (Flavobacterium meningosepticum recombinant in Escherichia coli (E.coli)) was obtained from Roche (Germany). Adhesive cap 500 μL tubes and MembraneSlide 1.0 polyethylene naphthalate (PEN) were purchased from Carl Zeiss Microscopy (Germany). Filter plates of 96-well polypropylene (PP) were obtained from Orochem Technologies (USA). The 96-well PP microplate and MultiScreen®HTS 96-multiwell plates (pore size 0.45 m) with a high protein-binding membrane (hydrophobic Immobilon-P polyvinylidene difluoride (PVDF) membrane) were from (the Netherlands). The Milli-Q water used for all solvent preparation and washing steps was generated from an ELGA system (Veolia, the Netherlands), maintained at ≥ 18 MΩ.
《2.2. FFPE tissue sectioning and staining》
2.2. FFPE tissue sectioning and staining
Anonymized human CRC tissues were obtained from the Department of Pathology at Leiden University Medical Center (LUMC, the Netherlands). The same cohort was used in our recently published work [21]. All samples were handled in a coded fashion, according to the national ethical guidelines (Code for proper secondary use of human tissue, Dutch Federation of Medical Scientific Societies), which agrees with an augmented system of ‘‘opt-out” for further use in the scientific research of coded human tissue, unless there are special circumstances. Primary colorectal tumors (1T–12T), paired normal colon mucosa from the same patients (1C–12C), and six metastatic tissues (15M–21M) obtained from the livers of different patients were selected for the analysis. Paraffin tissue blocks were cut into 10 μm thick sections with a microtome and mounted on polyethylene naphthalate (PEN) membrane slides for LCM. In addition, 5 μm thick sections were mounted on glass slides and used for hematoxylin and eosin (H&E) staining. The slides were dried at 37 °C overnight and stored at 4 °C.
The PEN slides for LCM were first deparaffinized with xylene, which was applied three times for 5 min, and then washed using absolute EtOH for 2 min. Subsequently, the slides were rehydrated by being briefly submerged in 85% EtOH, followed by 70% EtOH and distilled water. The slides were washed with Milli-Q water for 2 min after the application of hematoxylin for 20 s. Dehydration was then performed by submerging the slides first in 70% EtOH, then in 85% EtOH, and finally in absolute EtOH; this was followed by drying at room temperature (RT) and storage at 4 °C. The H&Estained FFPE slides and corresponding tissue slides used for LCM within the target area are provided in the supplementary material of our recently published work [21].
《2.3. Pathologist annotation》
2.3. Pathologist annotation
Tumor and normal epithelial regions were marked on the H&E slide by a pathologist. The differentiation grade was assessed by means of a microscopic evaluation of the glandular formation on the H&E-stained slides.
《2.4. Laser capture microdissection》
2.4. Laser capture microdissection
In brief, the selected regions of the tissue sections were excised by LCM based on the target areas indicated by a pathologist. LCM was performed using PALM RoboSoftware (Germany), and the samples were collected in 500 μL adhesive cap tubes for later use. In total, approximately 20 000–25 000 cells were obtained for each sample. To obtain comparable amounts of cells for analysis, three sections of the tissue with an area of around 2500 μm2 each were used for cell counting. The average area per cell was used to extrapolate the area needed to obtain 20 000 cells. Given that healthy colon mucosa cells are surrounded by immune cells, which could not be efficiently separated from the epithelial cells by means of LCM, lymphoid follicles were dissected from different normal colon tissues and pooled together to obtain the glycan profile of gut-associated immune cells (Impool). Moreover, separate samples containing the stromal regions were collected solely for tumors with high stromal content (4TS, 6TS, 7TS, 11TS, 12TS, 19MS, and 21MS).
《2.5. Release of N-glycans from tissue》
2.5. Release of N-glycans from tissue
To release N-glycans from tissue, 100 μL of lysis buffer consisting of 100 mmol·L–1 of Tris HCl, 0.1 mol·L–1 DTT, 100 mmol·L–1 of NaCl and 1% sodium dodecyl sulfate (SDS) was added to the adhesive caps, and the mixture containing tissue pieces were transferred to a 1.5 mL Eppendorf tube. The samples were placed on ice and sonicated three times each time for 15 s using a Branson sonication rod with an output power of 2/10, with a 20 s cooldown between each cycle. Subsequently, the samples were incubated at 99 °C for 1 h with shaking at 400 r·min–1 . PVDF membrane wells were preconditioned with 100 μL of 70% EtOH and 100 μL of Milli-Q water. An additional 5 μL of 70% EtOH was used to rewet the membrane before sample loading. After cooling down, 100 μL of the tissue lysate was loaded onto the PVDF membrane plate wells and shaken at RT for 20 min. The plate was centrifuged at 500 g (where g is the relative centrifugal force) and washed using 100 μL of Milli-Q to remove the unbound material. To block the membrane, 40 μL of 0.5% PVP-40 in Milli-Q was added to the wells, followed by 5 min incubation on a shaker. Next, the plate was washed with 2× 100 μL of phosphate-buffered saline (PBS), 2× 100 μL of 10 mmol·L–1 ABC, and 2× 100 μL of Milli-Q. Afterward, 10 μL of Milli-Q was added to each sample well to soak the membrane and to prevent the enzyme mixture from passing through the membrane, followed by 5 min of incubation on a shaker. The N-glycans were released by adding 15 μL of an N-glycosidase F mixture containing 2 units (U) of N-glycosidase F with 13 μL of Milli-Q to each well, followed by incubation at 37 °C for 15 min. Prior to the overnight incubation at 37 °C, 15 μL of Milli-Q was added to each well to prevent the membrane from drying out.
《2.6. Recovery, reduction, and purification of N-glycans》
2.6. Recovery, reduction, and purification of N-glycans
The recovery, reduction, and purification of the released N-glycans were performed as previously described [22,23]. In brief, the released N-glycans were collected by centrifuging the plate at 1000g for 2 min. The PVDF membrane wells were washed with 3× 30 μL of water, and the flowthroughs were combined. Subsequently, 20 μL of 100 mmol·L–1 ammonium acetate (pH 5) was added to the collected N-glycans, followed by incubation at RT for 1 h, to hydrolyze the released glycosylamines. The samples were then dried under vacuum at 35 °C. The N-glycans were reduced by adding 20 μL of 1 mol·L–1 NaBH4 in 50 mmol·L–1 KOH to each sample well, followed by incubation at 50 °C in a humidified plastic box for 3 h. To quench the reaction, 3 μL of glacial acetic acid was added to each well, followed by a desalting step. The columns were self-packed by adding 100 μL of a strong cation-exchange resin slurry containing Dowex (50W-X8) in MeOH (50/50, v/v) into each well of a 96-well filter plate and preconditioned by adding 3× 100 μL of 1 mol·L–1 HCl, 3× 100 μL of MeOH, and 3× 100 μL of Milli-Q. The samples were loaded onto the preconditioned columns and washed with 2× 40 μL of Milli-Q. The collected flow-through and wash containing the N-glycans were dried under vacuum at 35 °C. During the course of the drying step, the remaining borate was removed by adding 3× 100 μL of MeOH. Finally, the porous graphitized carbon (PGC)-SPE columns were prepared by packing 60 μL of bulk sorbent Carbograph slurry into a 96-well filter plate. The packed columns were preconditioned by adding 3× 100 μL of 80% acetonitrile in water containing 0.1% TFA, followed by 3× 100 μL of 0.1% TFA. The preconditioned columns were washed with 3× 80 μL of 0.1% TFA after loading the sample. The N-glycans were eluted from the columns using 3× 40 μL of 60% acetonitrile with 0.1% TFA and dried under vacuum.
《2.7. Analysis of released N-glycan alditols using PGC-nanoLC-ESI-MS/ MS》
2.7. Analysis of released N-glycan alditols using PGC-nanoLC-ESI-MS/ MS
The dried samples were redissolved in 12 μL of Milli-Q. The N-glycans were measured on a Dionex Ultimate 3000 nanoLC system equipped with a self-packed Hypercarb PGC trap column (5 μm particle size, 320 μm × 30 mm) and a self-packed Hypercarb PGC nano-column (3 μm particle size, 100 μm × 100 mm), coupled with an amaZon electron transfer dissociation (ETD) speed electrospray ionization (ESI) ion trap mass spectrometer (Bruker Daltonics, USA). For the analysis of the N-glycans, 5 μL of the sample was injected and trapped on a trap column with 2% solvent A (10 mmol·L–1 ABC) at 6 μL·min–1 of loading flow and separated with a nano-column using a multi-step gradient: 2%–9% of buffer B (60% acetonitrile in 10 mmol·L–1 ABC) for 1 min, followed by 9%–49% over an 80 min time span using a 0.6 μL·min–1 flow rate. The column was washed with 95% buffer B for 10 min. A CaptiveSpray source (Bruker Daltonics Inc., USA) was used for ionization by applying 1000 V of capillary voltage in negative ion mode. The drying gas (N2) temperature was set at 280 °C and the flow was 3 L·min–1 . The nebulizer gas (N2) enriched with isopropanol was kept at 3 psi (1 psi = 6.895 kPa), as described before [24]. MS spectra were acquired within the m/z range 500–1850 in negative ion mode with the target mass of the smart parameter settings at m/z 1200. MS/MS spectra were generated by the collision-induced dissociation of the top three precursors.
《2.8. Data processing and statistical analysis》
2.8. Data processing and statistical analysis
The extracted ion chromatograms were generated by including the first three isotopes of each N-glycan in Bruker Data analysis Software (version 5.0). The area under the curve was used for peak integration. The relative quantification was calculated based on the total area of all observed N-glycans (signal-to-noise ratio ≥ 6) within a sample and was normalized to 100%. The packages ‘‘tidyverse,” ‘‘readxl,” ‘‘caret,” ‘‘gridExtra,” ‘‘ggpubr,” ‘‘pcaMethods,” ‘‘Rcpm,” ‘‘ggrepel,” ‘‘Rcpm,” ‘‘data.table,” ‘‘ComplexUpset,” ‘‘ggplot2,” ‘‘UpSetR,” and ‘‘tidyHeatmap” in ‘‘R” Software (version 4.0.5) were used for data analysis and visualization. The Wilcoxon–Mann–Whitney non-parametric statistical test was used to test differences between groups, and p-values were adjusted for multiple testing using the Benjamini–Hochberg method.
《2.9. Gene expression data》
2.9. Gene expression data
Gene expression data from 132 microdissected CRC and paired normal colon epithelium were obtained from the Gene Expression Omnibus (GEO) database with the identifier GSE21815. Gene expression data for bulk CRC tissue were obtained from the Cancer Genome Atlas (TCGA) dataset via the firebrowse.org website.
《3. Results》
3. Results
《3.1. Differences in N-glycan signatures among CRC, stroma, and normal colon mucosa》
3.1. Differences in N-glycan signatures among CRC, stroma, and normal colon mucosa
The studied N-glycans were released from LCM tissue regions derived from the primary tumors of 12 CRC patients (1T–12T) and counterpart normal colon from the same patients (1C–12C), as well as six metastatic CRCs from the liver metastases of six additional patients (15M–21M) (for detailed clinical information, see Table S1 in Appendix A). The stroma regions from cancers with a high stromal content were also analyzed. In total, 116 N-glycans were detected, containing 3–14 monosaccharides (Table S2 in Appendix A). Prominent differences in the expression of N-glycans were found between CRC and the healthy control normal mucosa.
A clear separation was found between cancer, stroma, and normal mucosa (Fig. 1), driven by the diverse expression of N-glycans and glycosylation features. To gain insights into their shared structural components, the identified individual N-glycans were classified according to N-glycan types, such as ‘‘complex,” ‘‘hybrid,” and ‘‘oligomannosidic,” as well as according to glycomic traits, such as ‘‘sialylation,” ‘‘fucosylation,” and ‘‘sulfation.” MS/MS spectra of the selected N-glycans with sulfation can be found in Fig. S1 in Appendix A. N-glycans with the formula Man0–4GlcNAc2Fuc0–1 were assigned as ‘‘paucimannosidic,” and N-glycans that only contained three mannoses and a single antenna were considered as a separate class, called ‘‘monoantennary.” The trait of antennarity represents the number of GlcNAc attached to the 3/6-arm mannose of the core structure; the sialylation and fucosylation traits are designed in a similar way. More information is presented in Table S2. The majority of the cancer samples (blue) were clustered in the lower panel of the score plot (Fig. 1(a)) and revealed a high level of α2-6 sialylation; paucimannosidic, monoantennary, and triantennary N-glycans; expression of the sialyl-Lewis A/X (sLeA/X) epitopes; and phosphorylation (Fig. 1(b)). The high expression of monoantennary N-glycans strongly drives the separation of the cancer samples, with a median relative abundance of 2.8% (Table S3 in Appendix A). Moreover, the sLeA/X epitopes were found to only be expressed in the cancer samples 6T, 3T, and 16M, with relative abundances of 5.0%, 3.0%, and 0.3%, respectively (Table S3). In contrast, the normal mucosa samples were clustered in the upper right section of the score plot (Fig. 1(a); Table S3), mainly driven by the high expression of bisected N-glycans (median 14%), while cancer and stroma regions showed a relatively low abundance (median 4% and 5%, respectively) (Fig. 1(b); Table S3). Moreover, the glycosylation features of α2-3 sialylation, (core-)fucosylation, and (di)antennary and complex N-glycans contributed to the separation of the stroma samples (Fig. 1; Fig. S2 in Appendix A). The median relative abundances of α2-3 sialylation, core-fucosylation, and complex-type N-glycans of the stroma samples were found to be 32%, 44%, and 76%, respectively, in contrast to those of cancer (12%, 30%, and 52%, respectively) and normal mucosa (14%, 34%, 46%, respectively; Table S3).
《Fig. 1》
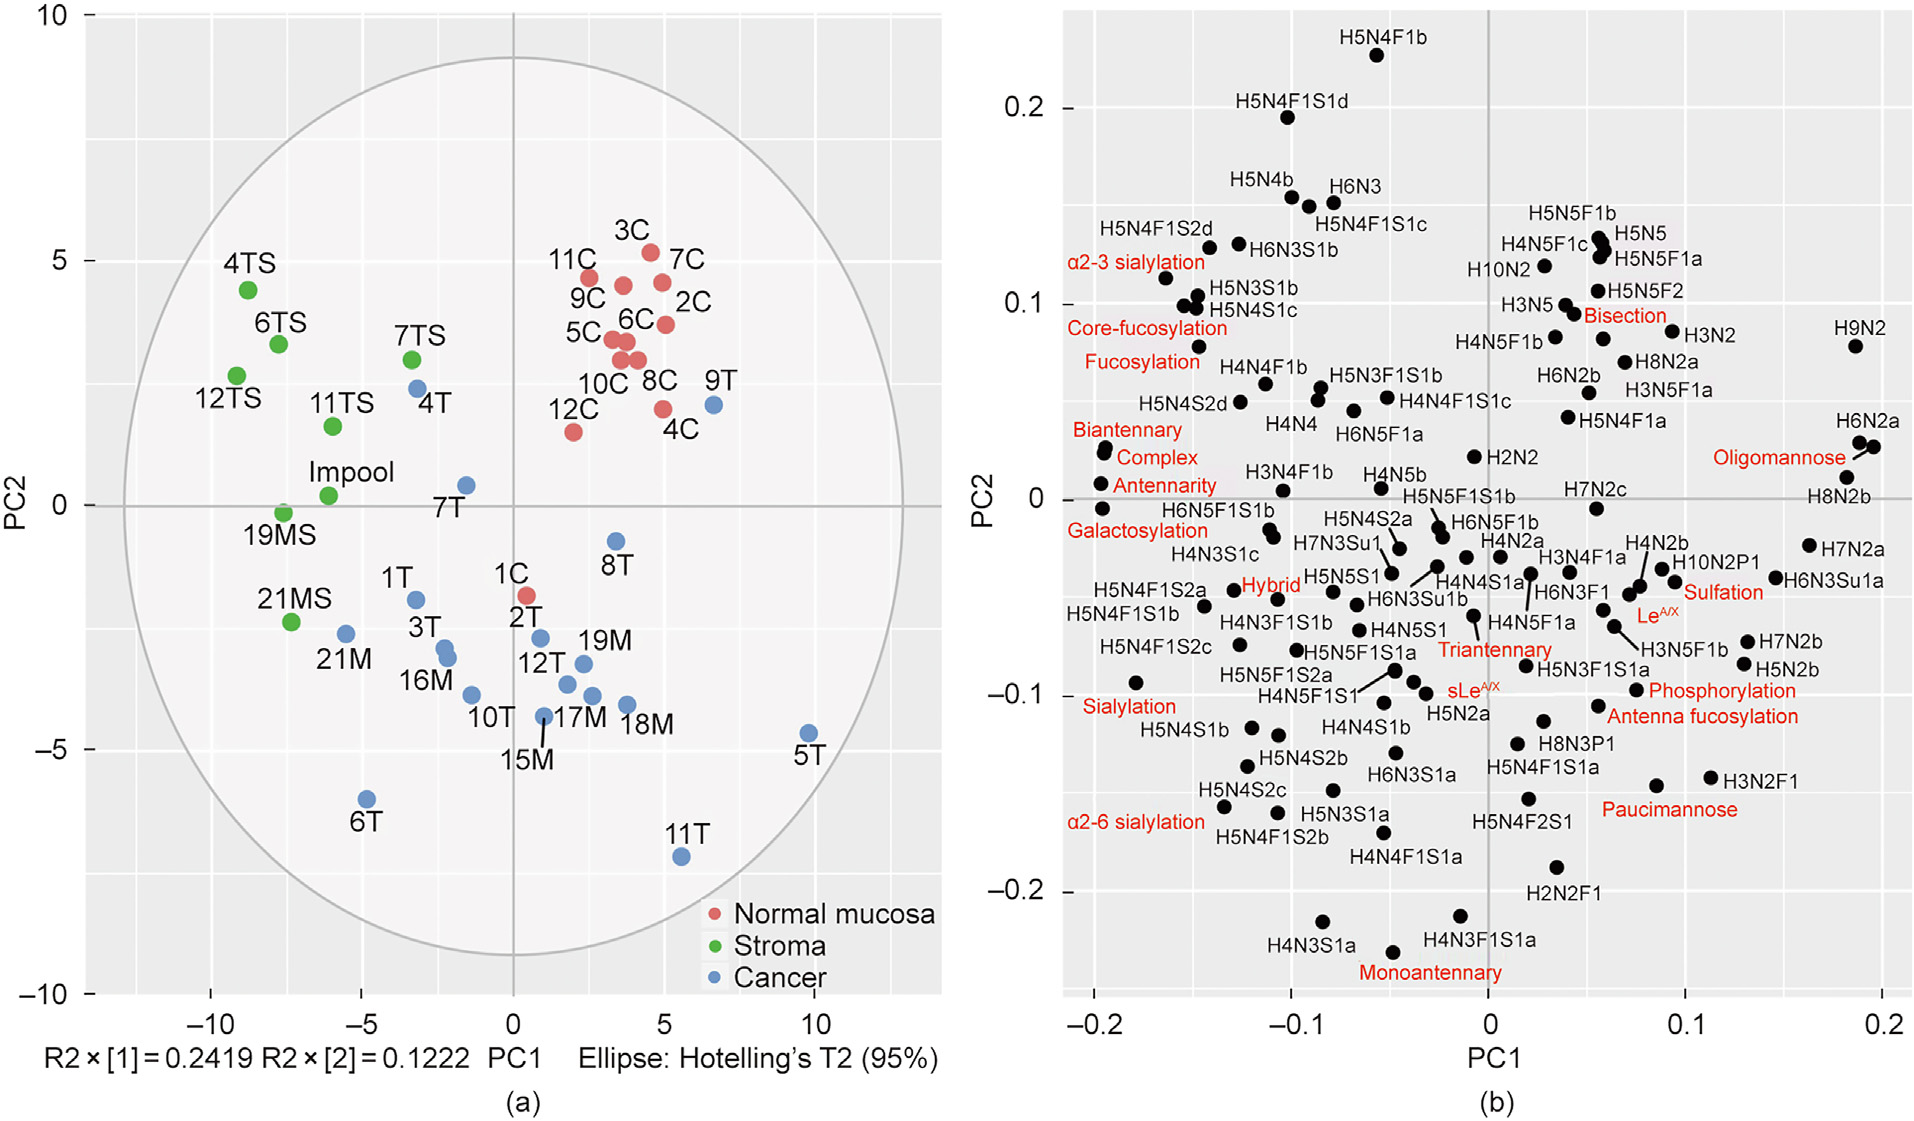
Fig. 1. Distinct glycosylation features in CRC, stroma, and normal colon mucosa. (a) The first two principal components (R2 × [1] and R2 × [2]) of the principal component analysis (PCA) model explain 36% of the variance. The prominent separation between CRC, stroma and normal colon mucosa is illustrated in the principal component (PC) analysis score plot of PC1 against PC2. (b) The loading plot indicates the variables driving the separation of the samples, including individual N-glycans (black) and glycosylation features (red). C: normal mucosa; T: CRC; M: CRC metastasis; S: stroma; MS: stroma of a metastatic tumor; TS: stroma from the primary tumor; R2 × [1] and R2 × [2] give the variance of the first and second principal component, respectively. More information about the glycosylation features can be found in Table S2.
Examples of N-glycan profiles expressed by adenocarcinoma and normal colon mucosa from the same patient are shown in Fig. 2. The adenocarcinoma from Patient 11 shown in Fig. 2(a) is characterized by a higher expression of complex N-glycans carrying α2-6 sialic acid and terminal Le epitopes, monoantennary N-glycans, and the specific expression of paucimannose glycans with the compositions H(2–3)N2F1. In comparison, the normal colon N-glycan profile from the same patient (Fig. 2(b)) shows a higher expression of N-glycans carrying terminal α2-3 sialic acid and bisected N-glycans.
《Fig. 2》
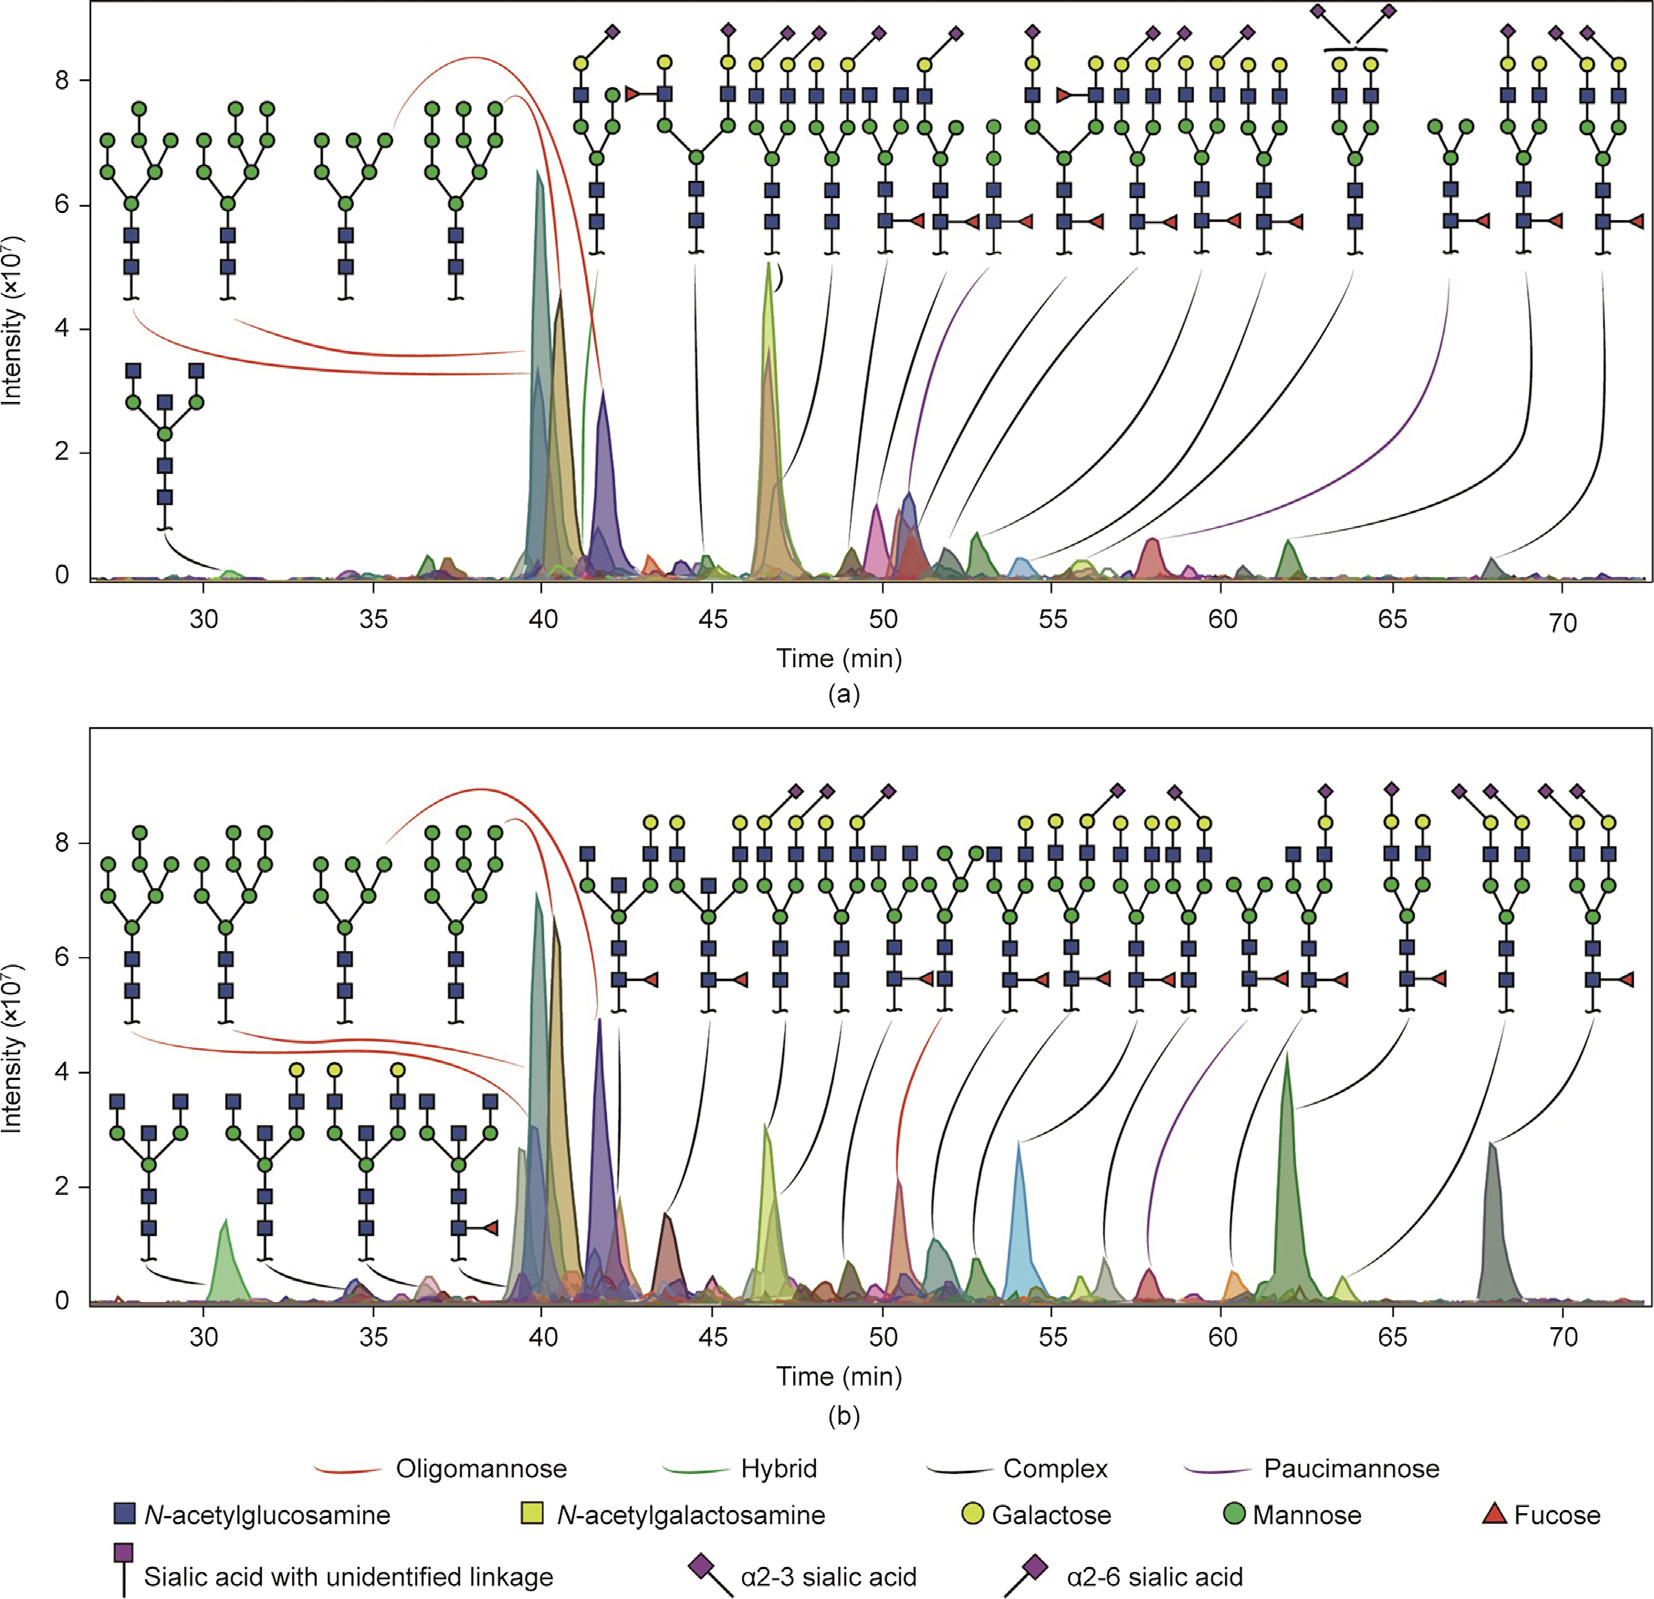
Fig. 2. Examples of N-glycan profiles of (a) adenocarcinoma and (b) normal colon mucosa from the same patient. (a) Adenocarcinoma obtained from Patient 11 was characterized by a higher expression of monoantennary N-glycans and by N-glycans carrying terminal LeA/X epitopes. In addition, more paucimannose and complex N-glycans carrying α2-6 sialic acid(s) were expressed compared with (b) normal colon mucosa from the same patient, which shows a higher expression of bisected and complex N-glycans carrying α2-3 sialic acid(s).
In comparison with normal mucosa, a significantly higher expression of α2-6 sialylation and monoantennary N-glycans was found in cancer tissues (Figs. 3(a)–(c)). More specifically, a significantly higher relative abundance was found in cancer tissues compared with normal mucosa for two monoantennary N-glycans (H4N3S1a and H4N3F1S1a), one hybrid glycan (H5N3S1a), and six complex N-glycans (H5N4S1b, H5N4F1S1b, H5N4S2b/c, and H5N4F1S2b/c), all carrying α2-6 sialylation (Figs. 3(d)–(l); Table S4 in Appendix A). In addition, the paucimannosidic N-glycan H2N2F1 was significantly overexpressed in cancer (Fig. 3(m); Table S4). A prominent difference in expression was observed with regard to bisection (Fig. 3(n)), as the bisected N-glycans H3N5, H3N5F1a, H4N5F1b/c, H5N5, and H5N5F1b were significantly lower in the cancer samples (Figs. 3(o)–(t)). Moreover, two corefucosylated complex N-glycans (H5N4F1b and H5N4F1S1d with α2-3 sialylation), a paucimannosidic species (H3N2), and three oligomannosidic N-glycans (H6N2a, H9N2, and H10N2) were significantly downregulated in cancer (Figs. 3(u)–(z); Table S4).
《Fig. 3》
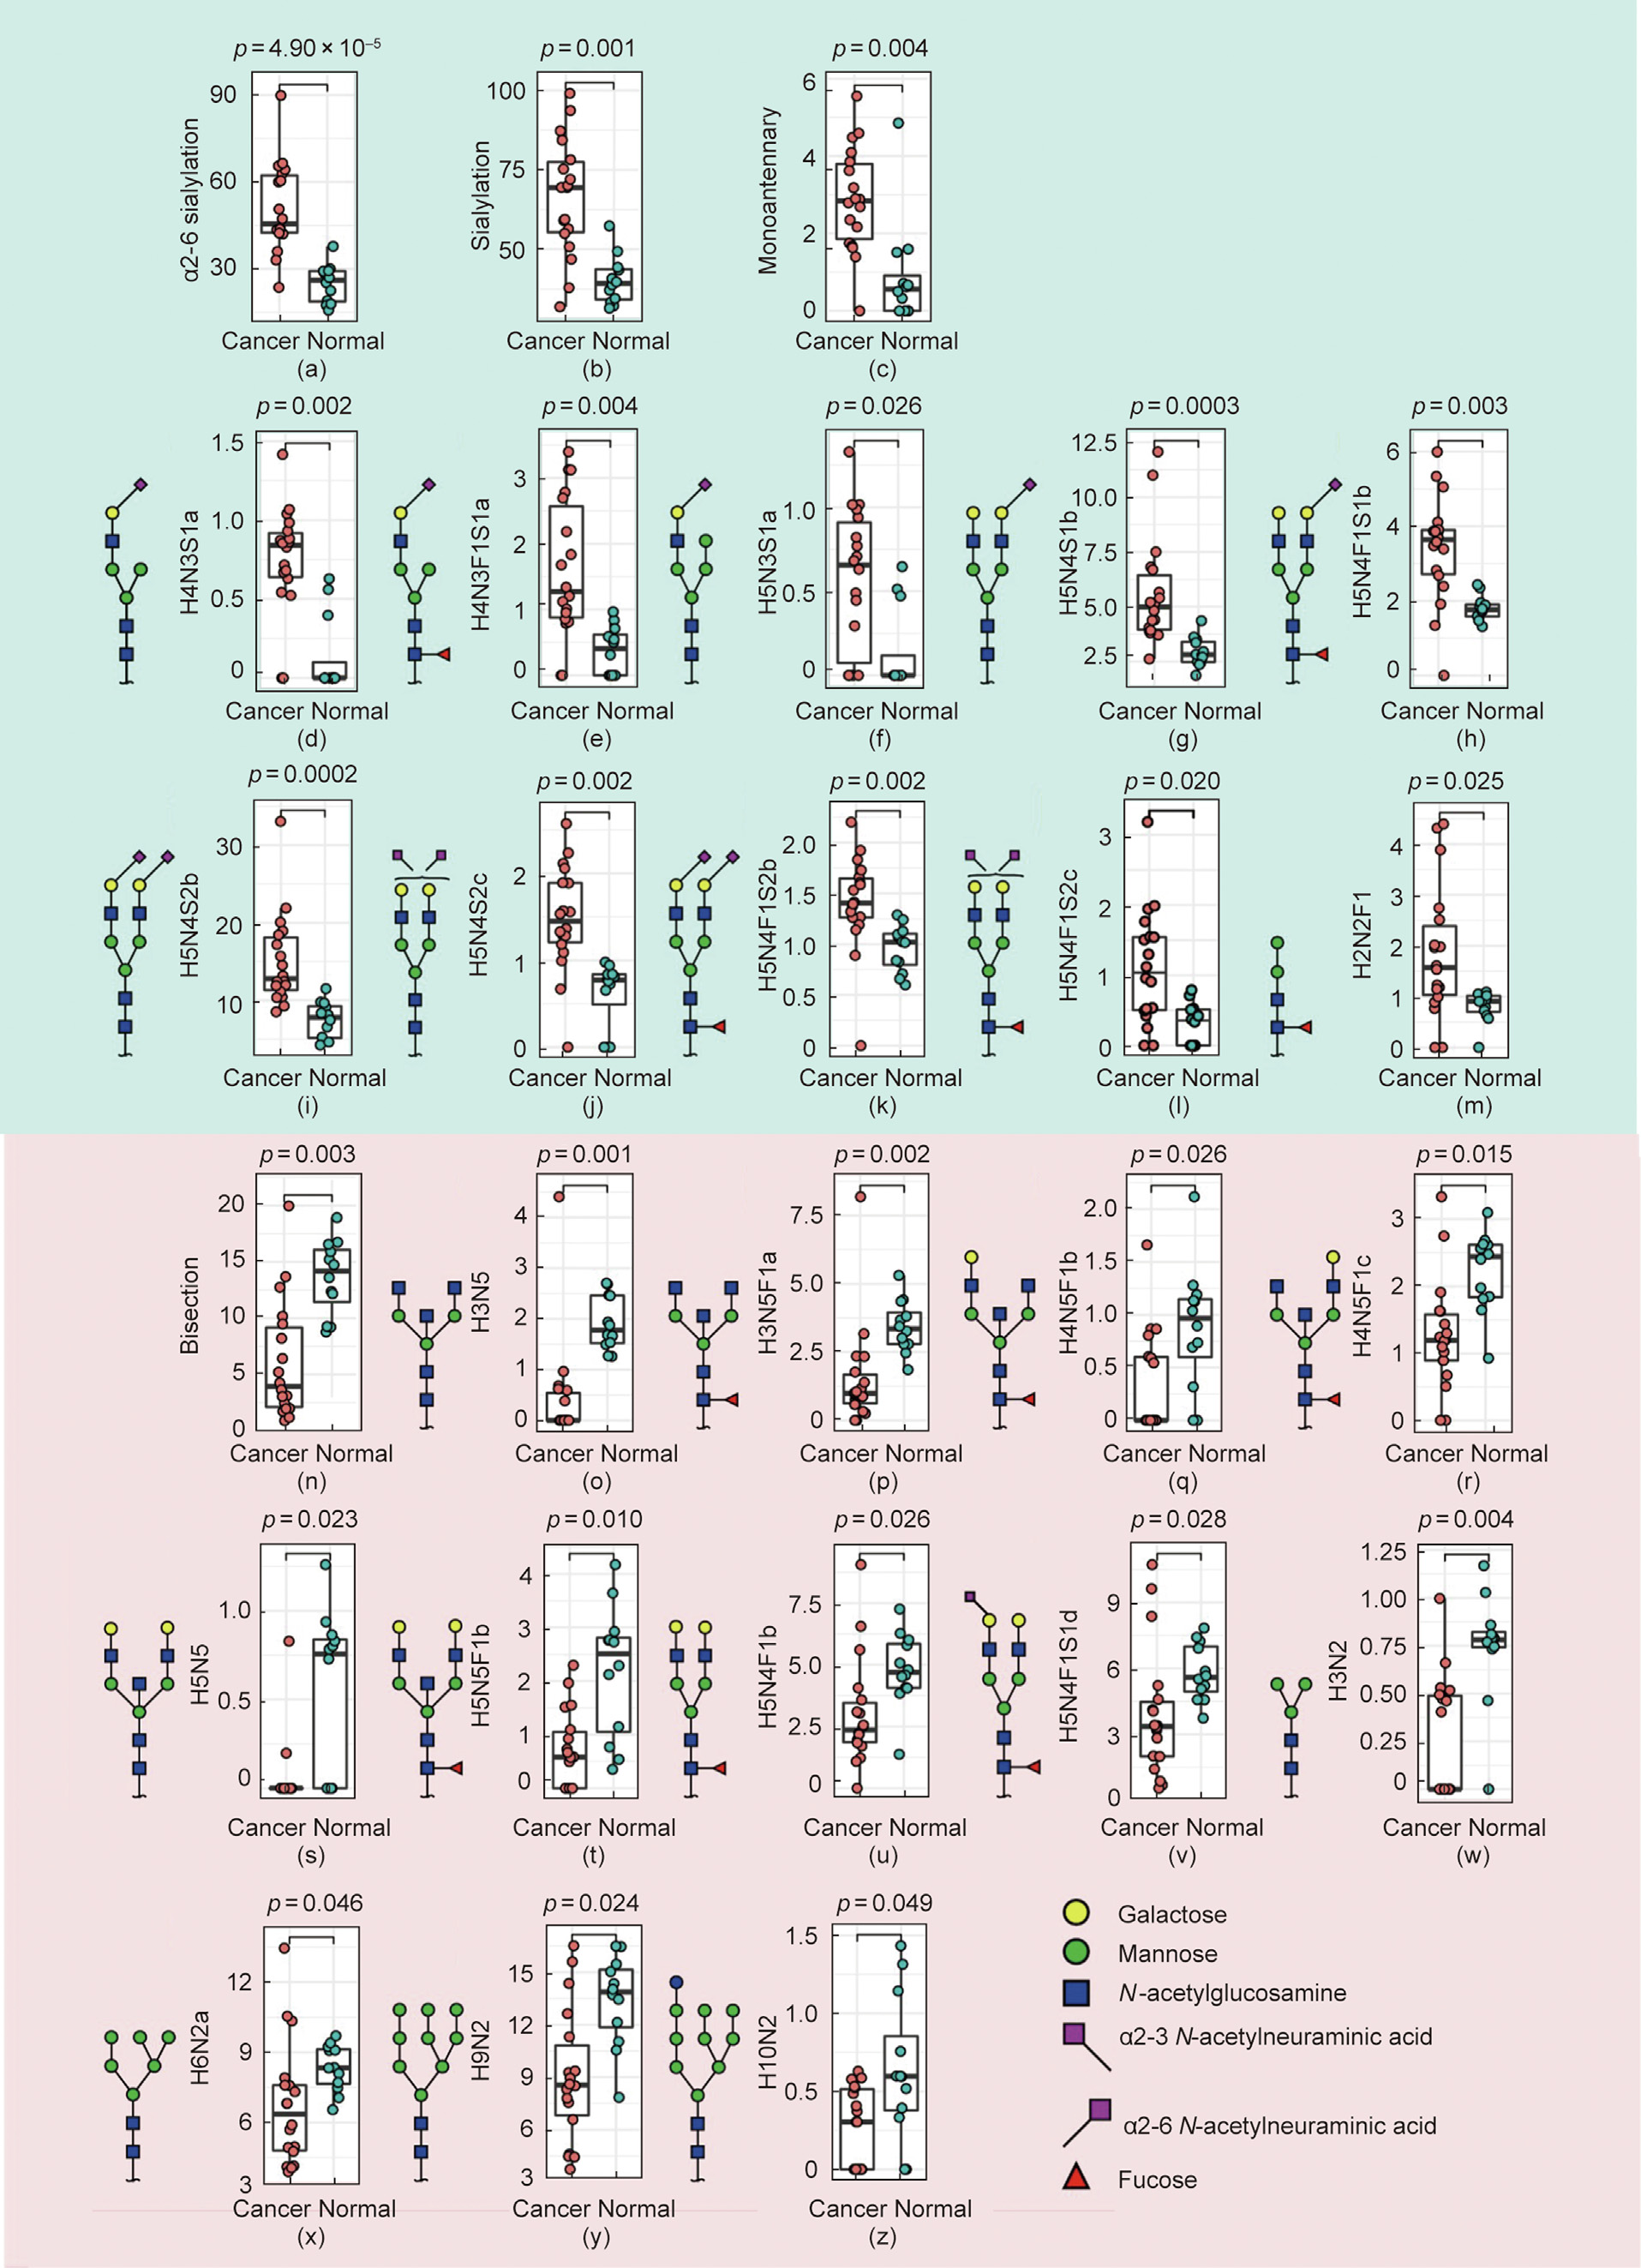
Fig. 3. Relative abundance of N-glycans and glycosylation features significantly (a–m) upregulated and (n–z) downregulated in CRC. (a–c) The N-glycosylation features (a) a2-6 sialylation, (b) sialylation, and (c) monoantennary glycans, as well as (d–m) ten individual N-glycans ((d, e) two monoantennary, (f) one hybrid, (g–l) six complex, and (m) one paucimannosidic species) were found to be significantly upregulated in CRC. In contrast, the expression of (n) bisected N-glycans and (o–z) 12 individual N-glycans were found to be higher in the normal mucosa in comparison with CRC. The Wilcoxon–Mann–Whitney non-parametric statistical test was applied to test differences between groups. Benjamini–Hochberg corrected p-values are shown above each boxplot. Y axes give relative abundance values of individual glycans and glycosylation features.
《3.2. Specific glycosylation signatures of CRC》
3.2. Specific glycosylation signatures of CRC
Collectively, 23 N-glycans were found to be solely expressed in cancer tissues (Fig. S3(a) and Table S5 in Appendix A). The majority of these were complex-type N-glycans; half were sialylated (either α2-3 linkage or unidentified linkage), and most structures carried a fucose modification—either solely core-fucosylation or corefucosylation with antenna fucosylation (Figs. S3(a)–(c) and Table S6 in Appendix A). Notably, the N-glycans carrying sLeA/X or LeB/Y epitopes were only detected in cancer tissues (Fig. S3(d) and Table S6). However, in normal mucosa, nine unique N-glycans were found, most of which carried LeA/X epitopes. It was found that a total of 62 N-glycans were shared between cancer, stroma, and normal mucosa, comprising complex, hybrid, oligomannosidic, paucimannosidic, and monoantennary N-glycans (Fig. S3(a)).
Overall, we found that specific N-glycan traits such as sLeA/X/ LeA/X, triantennarity, sialylation, and phosphorylation were high in CRC. Overall, 23 N-glycans were exclusively expressed in cancer while being absent in stroma and in normal mucosa (Fig. 1; Fig. S3). Among these, the N-glycans with the highest sensitivity were selected (Fig. 4). The N-glycan with the composition H5N4F2S1 (Fig. 4(e)) showed the highest relative frequency of 39% (7 out of 18) in cancer, followed by 17% for each of H5N3F1S1a (Fig. 4(c)), H6N5F1a (Fig. 4(j)), and H7N3Su1 (Fig. 4(m)). In particular, at least one of the five N-glycans illustrated in Fig. 4(n) was found in 89% of the cancers while not being detected in normal colon mucosa (Table S7 in Appendix A).
《Fig. 4》
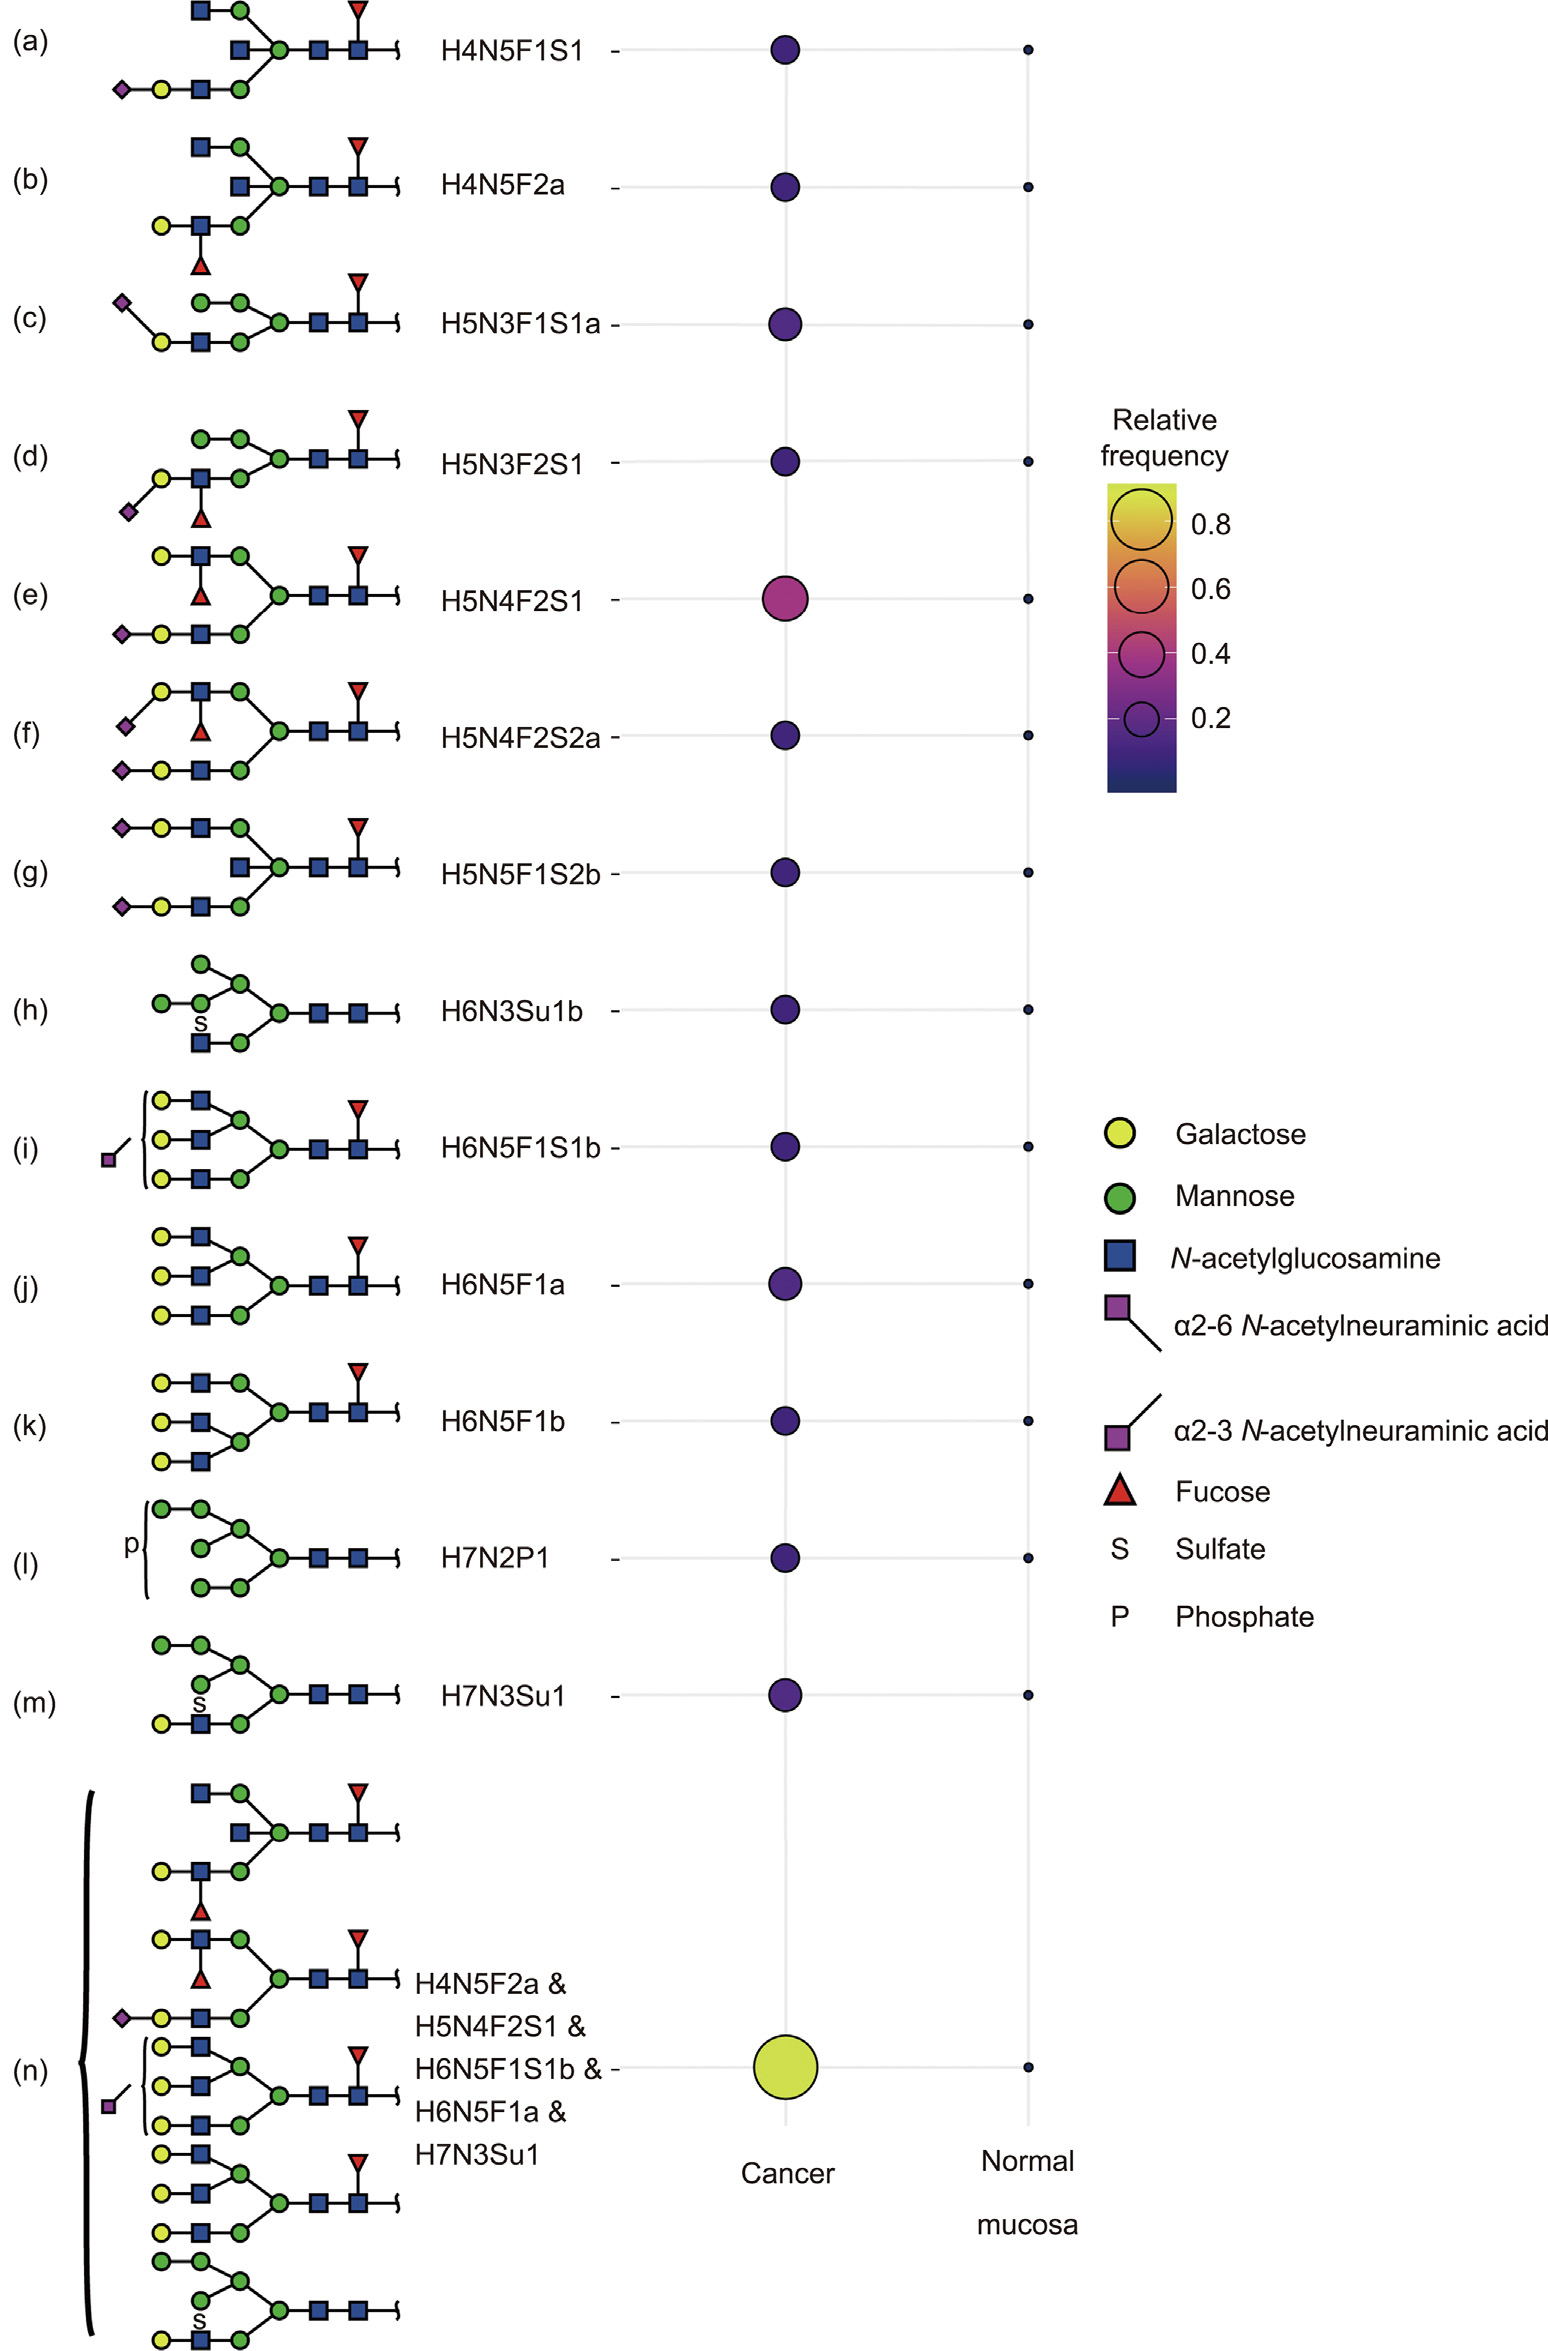
Fig. 4. Selected N-glycans with the highest sensitivity for CRC. (a–m) N-glycans were solely detected in two or more CRC samples and were absent in the normal colon mucosa. (n) At least one of the five illustrated N-glycans (either carrying sLeA/X/LeA/X epitopes or showing triantennarity) was detected in 89% of CRC samples.
《3.3. Pronounced glycosylation differences between CRC and stroma》
3.3. Pronounced glycosylation differences between CRC and stroma
As a dominant component of the tumor environment, the stroma is known to be associated with malignant development [18]. In comparison with cancer, significantly lower abundances of oligomannosidic, monoantennary, and antenna fucosylated N-glycans, as well as N-glycans carrying LeA/X epitopes and sulfation, were observed in the stroma samples (Figs. 5(a) (i)–(v)). Eight identified individual N-glycans were detected with a lower relative abundance in the stroma, compared with cancer; these were the six oligomannosidic N-glycans H5N2b, H6N2a, H7N2a/b, H8N2b, and H9N2 (Figs. 5(a) (vi)–(xi); Table S8 in Appendix A), along with the paucimannosidic N-glycan H3N2F1 and the hybrid-type N-glycan H6N3Su1a (Figs. 5(a) (xii) and (xiii); Table S8). In comparison, the stroma is distinguished by the enhanced level of complex type N-glycans with the glycosylation features of α2-3 sialylation, (core-)fucosylation, (di)antennary N-glycans, and galactosylation (Figs. 5(b) (i)–(viii)). A total of 11 individual N-glycans were detected with a higher relative abundance in the stroma, compared with cancer (Figs. 5(b) (i)–(xix)). Remarkably, the majority of these N-glycans carried one or multiple α2-3-linked sialic acid(s).
《Fig. 5》
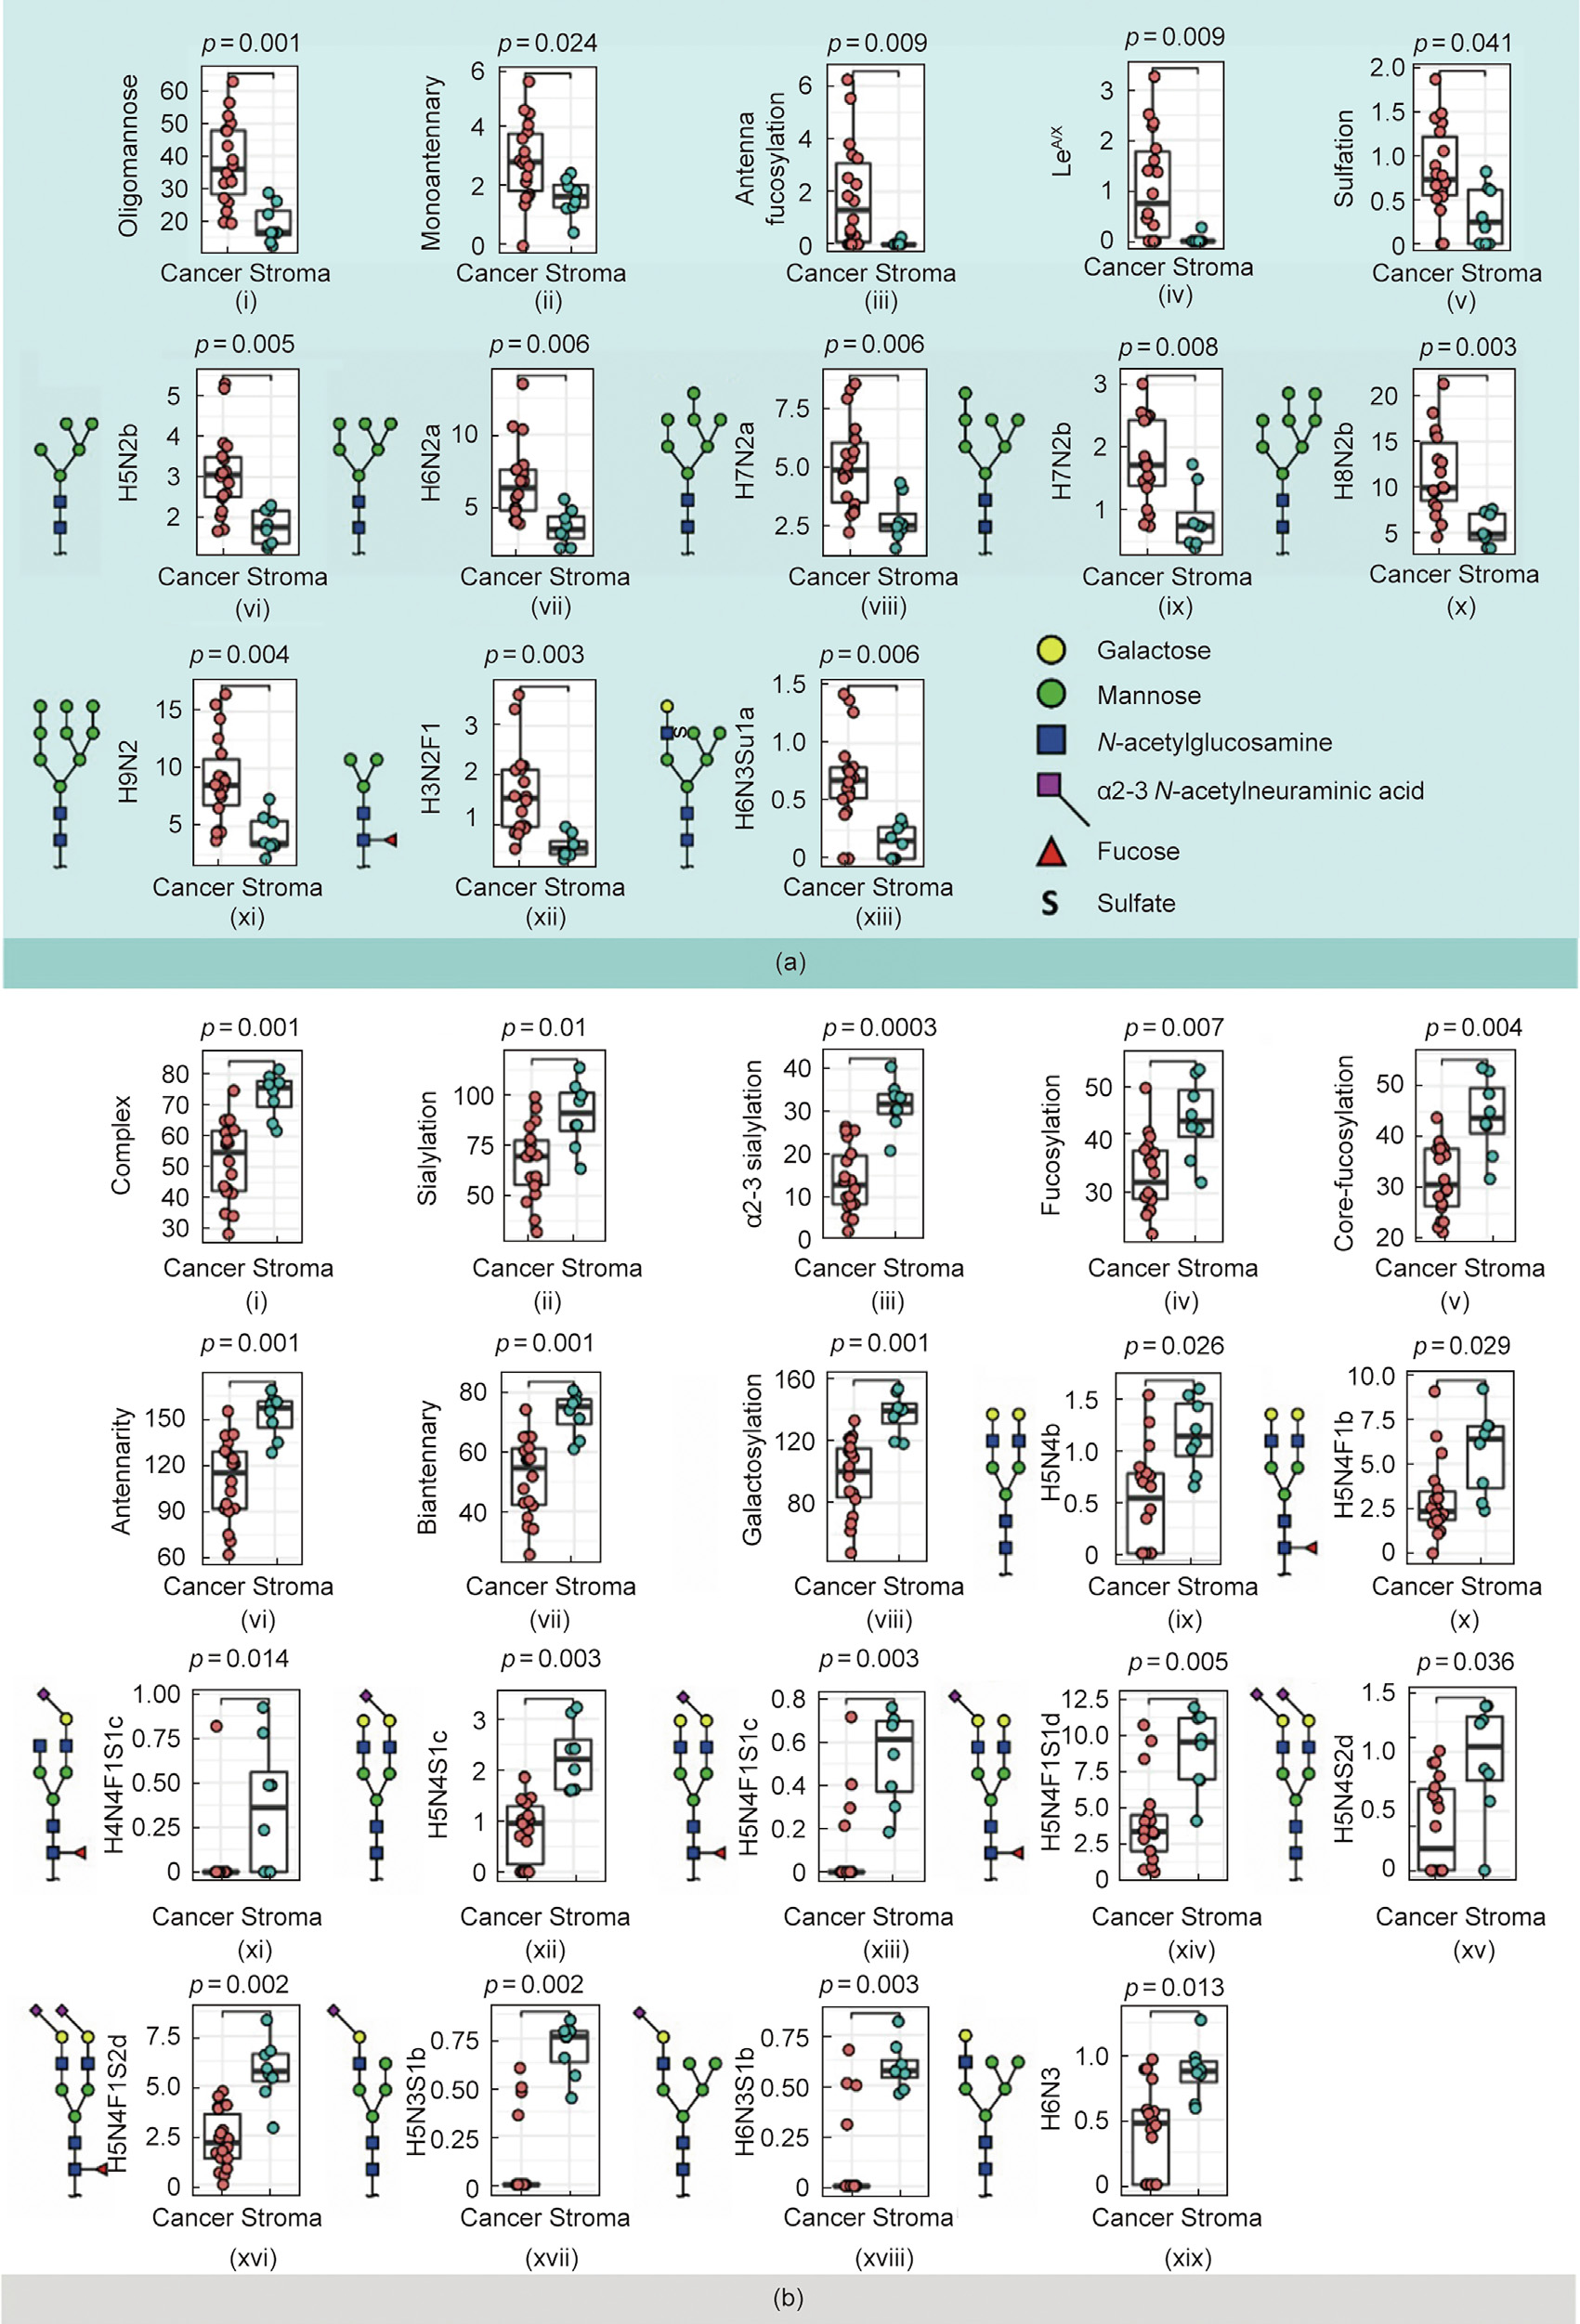
Fig. 5. Relative abundances of N-glycans and glycosylation features upregulated in CRC and in cancer stroma. N-glycosylation features indicated in (a) (blue): (i) oligomannoside, (ii) monoantennary, (iii) antenna fucosylation, (iv) LeA/X, (v) sulfation. In addition, eight N-glycans including (vi–xi) six oligomannosidic types, (xii) one paucimannosidic (H3N2F1), and (xiii) one hybrid-type sulfated N-glycan (H6N3Su1a) were found to be significantly upregulated in CRC. In comparison with cancer, the stroma in (b) (grey) was characterized by (i) a high expression of complex N-glycans, (ii, iii) α2-3 sialylation, (iv, v) (core-)fucosylation, (vi, vii) (bi)antennary glycans, and (viii) galactosylation; there were also (ix–xix) 11 individual N-glycans, mostly expressing α2-3 sialylation. The Wilcoxon–Mann–Whitney non-parametric statistical test was applied to test differences between groups. Benjamini–Hochberg corrected p-values are shown above each boxplot. Y axes give relative abundance values of individual glycans and glycosylation features.
《3.4. Glycosylation of specific CRC subtypes 》
3.4. Glycosylation of specific CRC subtypes
The glycosylation features were further investigated for different subtypes of CRC (adenocarcinoma, metastasis carcinoma, mucinous adenocarcinoma, and neuroendocrine carcinoma; Fig. S4 in Appendix A). More specifically, 12 N-glycans that consist of 11 complex types and one oligomannose N-glycan were only observed in adenocarcinoma (Figs. S4(a) and (c)). Seven fucosylated N-glycans were uniquely expressed in mucinous adenocarcinoma, of which four N-glycans had sLeA/X/LeA/X epitopes (Figs. S4(a) and (d)). In addition, sLeA/X epitopes were only detected in N-glycans derived from CRC, while one monoantennary N-glycan containing LeB/Y epitopes was solely detected in neuroendocrine carcinoma (Figs. S4(a) and (d)). Notably, LeB/Y epitopes were only found on two N-glycans and were exclusively expressed in adenocarcinoma (Table S3 and Fig. S4(d)).
To explore the allocations of various characteristics of CRC based on the N-glycomic signatures, principal component analysis (PCA) was performed (Figs. S5 and S6 in Appendix A). Sulfation and phosphorylation contribute to the grouping of most samples from Dukes Stage D, despite no clear clustering being shown between the other Dukes stages (Figs. S5(a) and (b)). Nevertheless, the majority of cancers with invasion covering Dukes Stages C and D (situated at the right part of the score plot) were mainly driven by oligomannosidic and paucimannosidic N-glycans, sulfation, and those with Le epitopes expression (Figs. S5(a)–(c)). No clustering was observed for tumors with the same differentiation grade and tumor/stroma ratio (Figs. S5(d) and S6(d)). Mucinous adenocarcinomas (3T and 2T) were found in the lower section of the score plot, reflecting a high expression of sLeA/X and a2-6 sialylation (Fig. S6(c) and Fig. S7, and Table S9 in Appendix A). High abundances of oligomannosidic N-glycans and LeB/Y epitopes were observed in sample 5T, which originated from large-cell neuroendocrine carcinoma. Notably, cancers with microsatellite instability (MSI) were separated from microsatellite stable (MSS) cancers, which are attributed to the increased expression of sLeA/X/LeA/X, α2-6 sialylation, paucimannosidic and monoantennary N-glycans, and antenna fucosylation (Figs. S6(a) and (b)). However, these differences were not statistically significant.
《3.5. Proposed biosynthetic pathway of N-glycans in CRC》
3.5. Proposed biosynthetic pathway of N-glycans in CRC
By using the observed N-glycosylation signatures of CRC and integrating the N-glycomic data with previously published gene expression changes in CRC (Fig. S8 and Table S10 in Appendix A) [25], a proposed biosynthetic pathway of N-glycan expression in CRC was constructed (Fig. 6). The elevation of monoantennary N-glycans in CRC likely results from the high expression of MAN2N2 encoding for an α1-2 mannosidase responsible for the trimming of α1-2 mannose residues on the six arm of the N-glycans (Fig. 6; Fig. S8). The high expression of α2-6 sialylation is in line with the high expression of ST6GAL1. The relatively high expression of MGAT2/4B/5/5B corresponds to the expression of triantennary/ tetraantennary N-glycans in CRC (Fig. 6; Fig. S8). Notably, an upregulation of MGAT3 was found in CRC whose corresponding GT adds the GlcNAc to the β-mannose of the core of N-glycans to produce bisected N-glycans. However, a significant downregulation of bisected N-glycans was observed in the CRC glycome (Fig. 6; Fig. S8).
《Fig. 6》
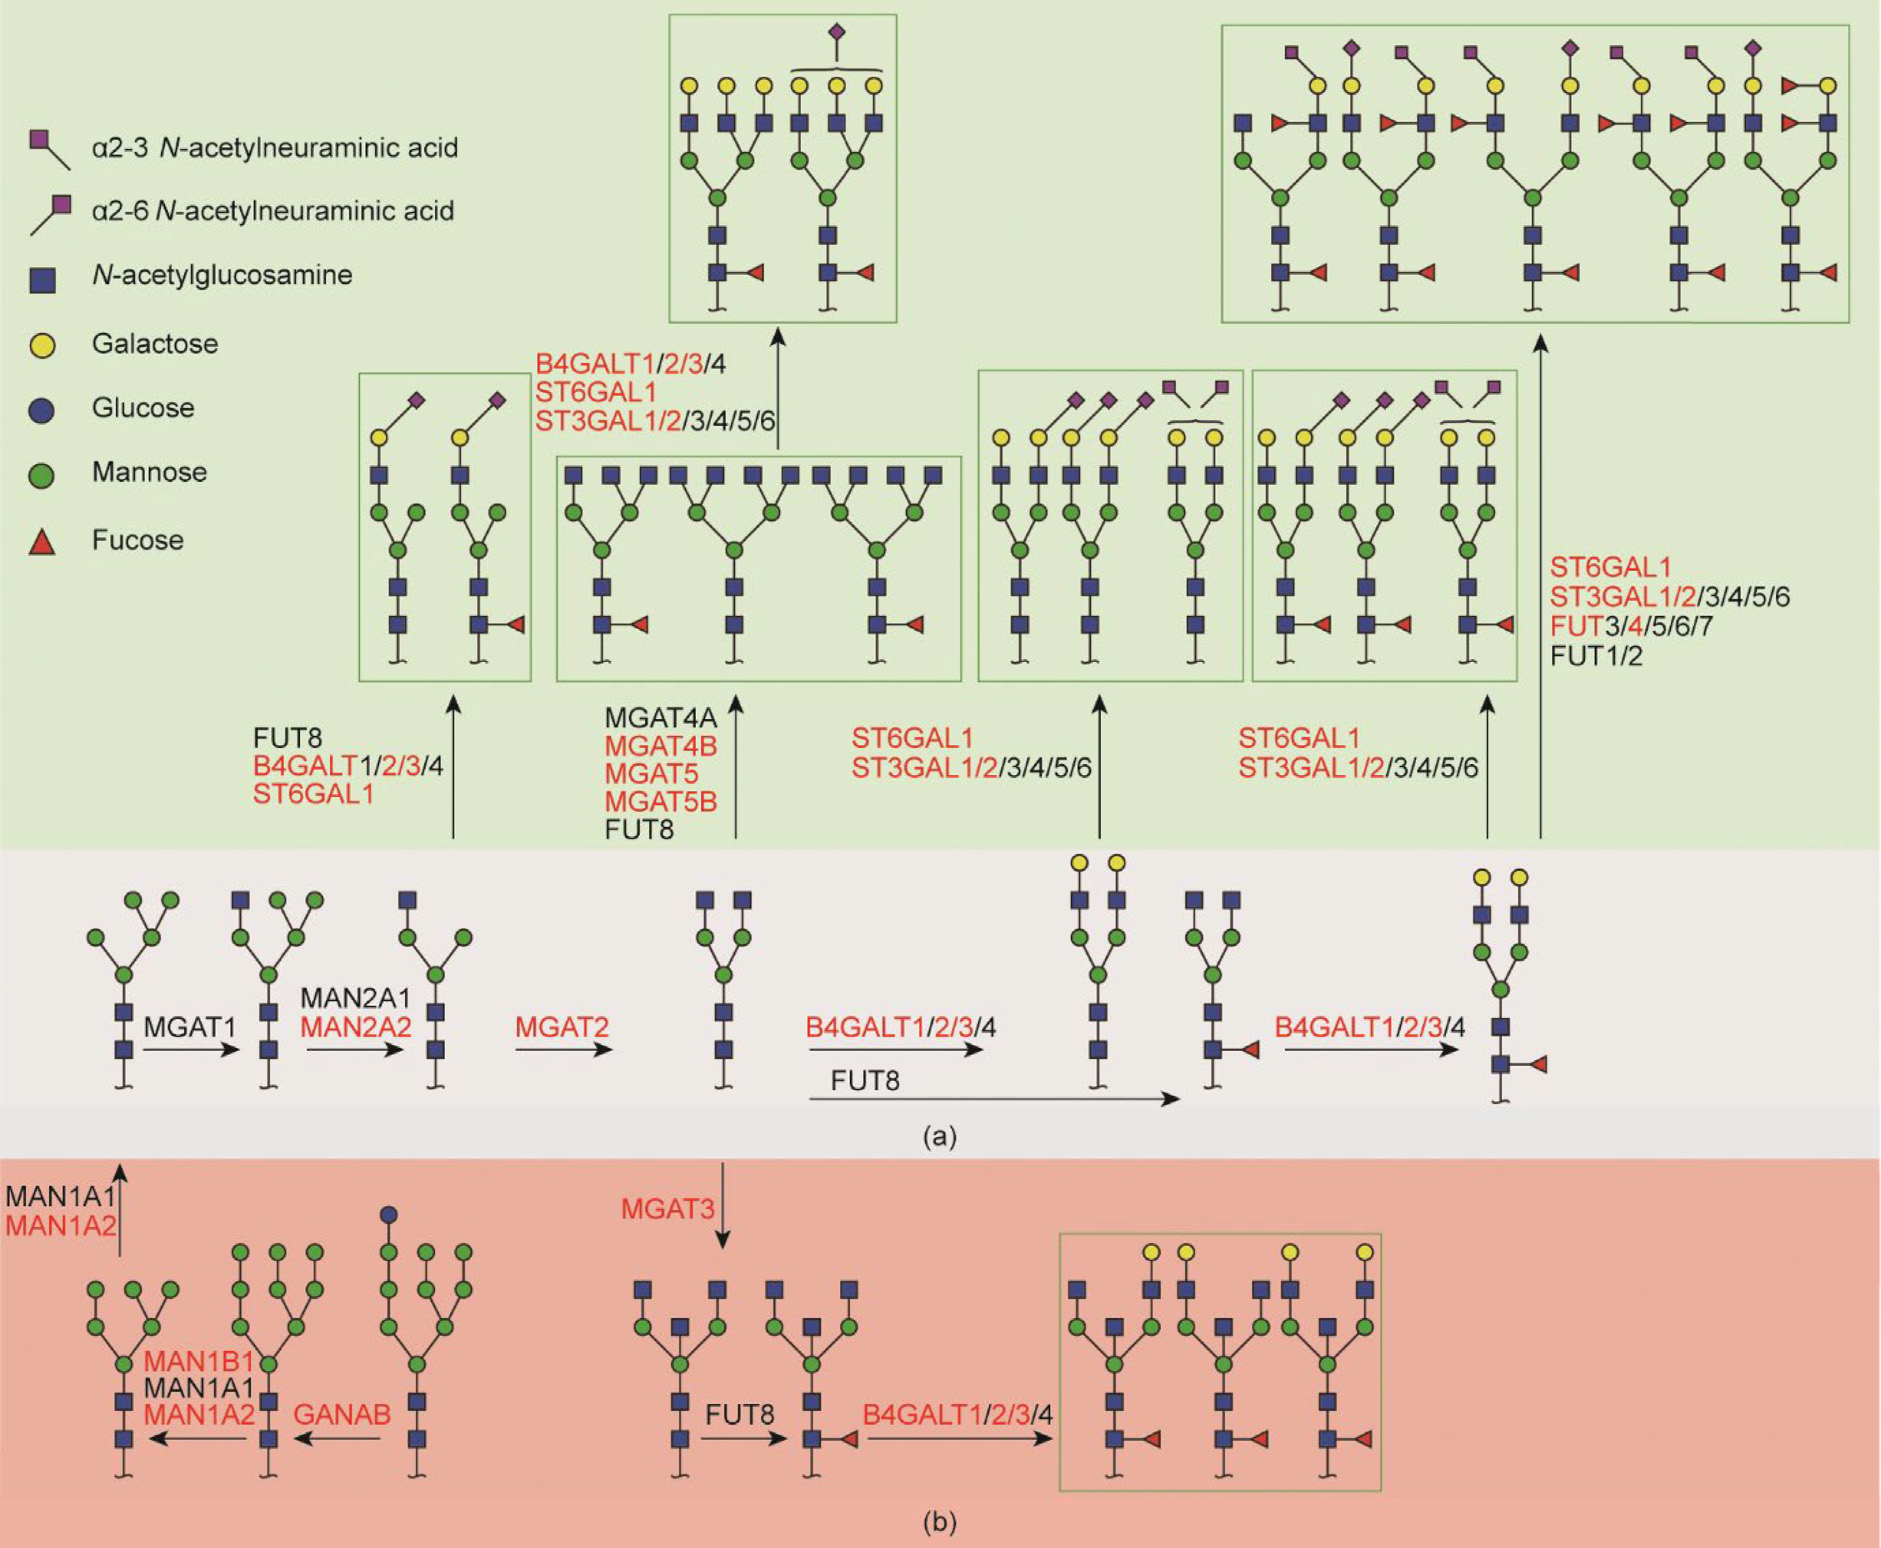
Fig. 6. Proposed biosynthetic model depicting the differences in the N-glycosylation of CRC and normal colon mucosa. High relative abundance and specific expression of N-glycans in (a) cancer and (b) normal mucosa, combined with genes encoding corresponding GTs involved in the biosynthesis of N-glycans. GT genes that are upregulated in cancer are shown in red.
《4. Discussion》
4. Discussion
The detection of cancer-specific glycosylation signatures can be hampered by the heterogeneity of the cells present in the tumor microenvironment, such as fibroblasts and immune cells. In this study, LCM was conducted to overcome this issue and obtain enriched cancer cells while excluding non-neoplastic cells from the tumor microenvironment. This made it possible to obtain the glycosylation signatures of cancer cells and stroma separately, as well as those of normal colon mucosa separated from the other layers such as submucosa and muscle cells. The differences between the N-glycomic profiles for cancer, stroma, and normal mucosa were discovered, and a significantly increased expression of α2-6 sialylation and monoantennary N-glycans and a decreased abundance of bisected N-glycans were found in cancer cells compared with normal mucosa, which was in line with previous studies [5,14,16,26].
Overall, it has been shown that the expression and activity of specific GTs are changed during the development of CRC [27]. Along with our findings on the high or specific expression of N-glycans in cancer and normal mucosa (Fig. S8), we propose an N-glycan biosynthetic pathway that is related to CRC (Fig. 6). For this purpose, we used the difference in the expression of the GTs involved in the biosynthesis of N-glycans from publicly available gene expression datasets [25]. Overall, it was found that the ST6GAL1 gene, which encodes for the GT responsible for the addition of sialic acid to galactose in α2-6 linkage, was significantly upregulated in CRC, which is in line with the overexpression of the α2-6 sialylation of N-glycans in cancer in our study (Fig. 3; Fig. S8). Previous studies have revealed that the expression and activity of ST6GAL1 GT are enhanced in CRC cancer tissues and correlates with metastasis and poor survival [28– 31]. Moreover, α2-6 sialylation in CRC and breast cancer has been found to contribute to reduced cell–cell adhesion and increased invasiveness [14,32]. Interestingly, studies have shown that enhanced expression of α2-3 sialylation is mainly found in the early stages of CRC (stages I and II), while α2-6 sialylation shows high expression in metastatic tumors [28,29,33]. In our study, no difference was found between cancer and normal mucosa in regard to α2-3 sialylation on the identified N-glycans. However, we did find a higher expression of α2-3 sialylation in stroma compared with cancer samples (Fig. 5).
In this study, monoantennary N-glycans showed higher levels in cancer samples in comparison with healthy mucosa and stroma (Figs. 3 and 5). We found a statistically significant increase in the monoantennary N-glycans H4N3S1a and H4N3F1S1a (both with α2-6 sialylation) in our cancer samples, in comparison with the healthy controls (Fig. 3). A previous study that investigated the differences in glycosylation between rectal adenomas and carcinomas revealed that monoantennary N-glycans are expressed more commonly in carcinomas than in adenomas [34]. Moreover, such structures were also detected in another study comparing CRC and a healthy colon [5], in which one monoantennary N-glycan with the composition H4N3F2Su was found to be overexpressed in CRC. Albeit at a relatively low abundance, monoantennary N-glycans were found to be increased in the spatially resolved MSI of CRC tissues [2]. An investigation of the mRNA expression of α1,2- mannosidases revealed that a significantly higher expression of the GTs MAN1A2 and MAN1B1 was presented in cancer compared with normal mucosa, which might also contribute to the increased expression of specific monoantennary N-glycans in cancer, as well as the downregulation of specific oligomannosidic structures (Fig. S8). However, this finding is less consistent with previous findings reporting an elevation of oligomannosidic N-glycans in CRC without a significant difference in the expression of MAN1A2 and MAN1B1 between CRC and a healthy colon [35]. Presumably, the application of LCM may contribute to these controversial results. In contrast, a significant decrease in monosialylated monoantennary N-glycans was reported for epithelial ovarian cancer compared with healthy controls [36]. Therefore, monoantennary N-glycans can be considered to be part of a CRC-associated glycosylation signature.
In the present study, no significant differences between CRC and normal mucosa were found in the expression of oligomannosidic N-glycans. Similarly, spatially resolved MS imaging only revealed a trend toward the overexpression of oligomannosidic N-glycans in stage II CRC [2]. Downregulation of the oligomannosidic N-glycans H6N2a and H9N2 was observed in CRC—a finding that was in contrast to previous findings reporting the abovementioned oligomannosidic N-glycans as being overexpressed in CRC [34,37,38]. Incomplete glycan processing due to shorter division/replication times has been proposed as a cause for the accumulation of oligomannosidic glycans in CRC tissues [12]. Although LCM was used to enrich normal colon mucosa cells, we were unable to completely separate them from the surrounding immune cell infiltration. Another spatially resolved MS profiling of CRC tissues showed downregulation of oligomannosidic N-glycans in the colon mucosa[38], indicating that the majority of the oligomannosidic N-glycans in our study might originate from the epithelial cell microenvironment. To investigate this, we microdissected colon lymphoid follicles in order to decipher the glycosylation profile of immune cells (Impool); however, a low expression of oligomannosidic N-glycans was observed. Although this finding gives an indication that immune cells did not largely contribute to the high expression of oligomannosidic N-glycans in the normal colon mucosa samples, that possibility cannot be excluded, as gutassociated immune cell populations are most likely to be in different stages of maturation in the follicles as compared with the tissue.
Paucimannosidic N-glycans have been previously considered to be uncommon in mammals [39]. However, recent studies have found the elevation of paucimannosidic N-glycans to be associated with various human cancers, including CRC [34,39,40]. In our study, no statistically significant differences were found for paucimannosidic N-glycans between CRC and healthy normal mucosa; however, we did observe a significantly higher expression of one particular paucimannosidic N-glycan, H2N2F1 (Fig. 3). This finding is in agreement with another study, which also reported overexpression of this N-glycan in CRC in comparison with a healthy colon [5]. Interestingly, this N-glycan is known to modify diverse human neutrophil proteins [39]. In our study, we found that the truncated paucimannosidic N-glycan (H3N2) was downregulated in CRC in comparison with the healthy mucosa (Fig. 3). Other studies have described lesstruncated paucimannosidic N-glycans, such as H3N2F1, as being increased in human cancers [39,41–43]. Further investigations are required to study the biosynthesis and role of paucimannosidic N-glycans in the development and progression of cancer.
The fucosyltransferases FUT3–7 and 9 are involved in the biosynthesis of sLe/Le epitopes [44]. Previous reports have revealed that they play an essential role in CRC progression, including the enhancement of tumor cell adhesion and motility, leading to metastasis [45]. Moreover, researchers have found that sLeX antigen acts as an E-selectin ligand and is correlated with poor prognosis in CRC [45]. Here, we found that N-glycans expressing sLeA/X epitopes were exclusively expressed by CRC, although they were only detected in three patients. Changes in FUT4 expression have been found to be associated with multiple cellular processes, including membrane trafficking, the cell cycle, and major oncogenic signaling pathways [46]. Previously, FUT4 has been proposed as a prognostic predictor and therapeutic target in lung cancer metastasis, based on findings that the high expression of FUT4 stimulates lung cancer cell invasion, migration, and epithelial-tomesenchymal transition [46]. The expression of FUT4 has been found to be increased in CRC compared with the corresponding mucosa [30]. Therefore, the high expression of FUT4 in CRC may be the key mediator of sLeA/X biosynthesis (Fig. 5; Fig. S8). On the other hand, LeA/X epitopes, which have previously been associated with poor prognosis [15], were found in both normal colon mucosa and CRC. Nevertheless, N-glycans carrying terminal LeA/X epitopes were detected specifically in CRC (Figs. 4(b) and (e)). Similarly, specific LeA/X N-glycans have been shown to be overexpressed in CRC [16]. However, no overall significant overexpression of LeA/X carrying N-glycans was found.
Upregulation of MGAT5, which encodes GnT-V, was observed in CRC in both LCM and TCGA datasets (Fig. S8), which is consistent with previous findings [30,47]. GnT-V is responsible for the addition of N-acetylglucosamine to α1-6-linked mannose to form the β1-6 branch of complex N-glycans, which appears to promote cancer metastasis [27,48]. However, we did not detect a statistically significant increase of triantennary/tetraantennary N-glycans on the glycome level, although higher expression was shown in some CRC samples. Nevertheless, three core-fucosylated triantennary N-glycans were detected specifically in CRC, without expression in normal colon mucosa (Figs. 4(i)–(k)). Previous studies have found increased expression of N-glycans with a β1-6 branch and MGAT5 in various cancers and associated with cancer malignancy and poor prognosis [12,49,50], but our MS-based N-glycomic analysis did not support this finding [5]. Moreover, our previous study using mass spectrometry imaging revealed a decrease in triantennary N-glycans in CRC compared with normal colon mucosa [2]. In contrast, GnT-III, which is encoded by the gene MGAT3, is involved in cancer suppression and is in charge of transferring GlcNAc with a β1-4 linkage to the core β-mannose residue of N-glycans, creating a bisected glycan [27,51]. Significant downregulation of bisecting GlcNAc N-glycans was observed in CRC (Fig. 3); although the expression of MGAT3 was found to be upregulated in cancers based on the LCM dataset, the TCGA dataset showed downregulation in cancer (Fig. S8).
The cancer-associated glycosylation signature has previously been reported to spread into the surrounding stroma of malignant cancer [2]. The stroma is composed of immune cells, cancerassociated fibroblasts, and the extracellular matrix and forms a fundamental component of the tumor microenvironment supporting malignant cell growth and metastasis [52]. In the present study, (core-)fucosylation, α2-3 sialylation, and complex N-glycans presented higher expression in the stroma in comparison with cancer, in which significantly higher abundances of monoantennary structures, N-glycans with LeA/X epitopes, and sulfated N-glycans were observed. Similarly, higher expression of complex-type N-glycans was found by means of the MSI imaging of CRC stromal regions [2]. The profound difference in N-glycan profiles we found between cancer and the stroma demonstrates the importance of tumorregion-specific MS and the enrichment of cell types of interest for specific glycomic analysis. However, compared with the early stage, the separation of cancer cells from the stroma region becomes more challenging in advanced stages, as scattered cancer cells invade through different layers of the tissue, which may influence the reproducibility and accuracy of LCM enrichment. Our study paves the way for future larger studies focusing on stroma-specific glycosylation signatures and deciphering the potential link between stroma glycosylation and cancer progression.
《5. Conclusions》
5. Conclusions
In this study, an in-depth N-glycosylation analysis of CRC was performed and compared with healthy colon mucosa from the same patients using PGC-LC-ESI-MS/MS. The N-glycome was investigated separately from the epithelial regions of both primary and metastatic CRC, the corresponding tumor stroma, and normal colon epithelia, using LCM to enrich cells from different regions. Profound differences in N-glycosylation were revealed between cancer, stroma, and normal mucosa. Significant overexpression of α2-6 sialylation and monoantennary N-glycans with the downregulation of bisected N-glycans was found in CRC in comparison with healthy mucosa. The alteration of glycosylation was supported by the expression of corresponding GTs involved in the biosynthesis of N-glycans. Downregulation of oligomannosidic and monoantennary N-glycans, LeA/X epitopes, and sulfation, as well as increased expression of (core-)fucosylation and α2-3 sialylation, were observed in the stroma samples. The discovery of altered glycosylation among different types of cells within the same tumors furthers our understanding of the changes in glycosylation that occur during the development of CRC.
《Acknowledgments》
Acknowledgments
The work was supported by the China Scholarship Council. The authors thank Dr. Oleg A. Mayboroda and Dr. Marco R. Bladergroen for their assistance with statistics.
《Compliance with ethics guidelines》
Compliance with ethics guidelines
Di Wang, Katarina Madunic´, Tao Zhang, Guinevere SM Lageveen-Kammeijer, and Manfred Wuhrer declare that they have no conflict of interest or financial conflicts to disclose.
《Appendix A. Supplementary data》
Appendix A. Supplementary data
Supplementary data to this article can be found online at https://doi.org/10.1016/j.eng.2022.08.016.


 京公网安备 11010502051620号


