

《1. Introduction》
1. Introduction
On December 20, 2015, a large landslide occurred at the Hong’ao Village construction solid waste (CSW) landfill in the Guangming New District of Shenzhen, Guangdong, China (103°33′48′′E, 30°54′55′′N) (Fig. 1). The landslide involved 2.73×10⁶ m3 of CSW, and had a length of about 1100 m, making it the largest landfill slope failure in the world. Because the landslide killed 77 people and destroyed 33 houses within an industrial zone of Shenzhen, the State Council of China immediately organized an investigation team to look into the causes of the landslide. The lead author of this paper was the head of the expert group within this investigation team; the second to eighth authors were also group members; and the ninth and tenth authors participated in the remote-sensing and field investigation. The authors collectively produced the cause-analysis report to the State Council of China and prepared this paper based on the field investigation, unmanned aerial vehicle (UAV) drone 3D photogrammetry, the dynamic analysis of multistage remote-sensing images, in situ and laboratory physical-mechanics tests, computer simulation, relevant archives, and witness interviews.
Many municipal solid waste (MSW) landfill landslides have occurred around the world in recent decades due to unsound geotechnical engineering risk controls and practices, revealing the importance of site selection, construction, and operation [1]. For example, on July 10, 2000, a waste landslide with a volume of 16 000 m3 occurred in the Payatas landfill in Quezon City, the Philippines, after two weeks of heavy rain from two typhoons. That event killed at least 330 people and left many homeless, and had one of the worst death tolls of all landfill landslides [2,3]. On February 21, 2005, a catastrophic waste landslide with a volume of 2.7×10⁶ m3 occurred at the Leuwigajah dump site in Bandung, Indonesia, due to heavy rainfalls [4]. This disaster caused 147 deaths and, along with the Shenzhen landslide, was one of the largest landfill landslides to date in terms of the volume of waste involved. With increasing volume of waste and constant changes in a landfill slope’s structures, the physical and mechanical properties and the hydrologic performance of a given landfill change over time. Therefore, in contrast to natural landslide analysis, the study of landfill slope failures must apply a dynamic analysis that probes into boundary conditions and stability. For this landslide investigation, we adopted a multistage modeling technique to study the influence of soil mass structure and hydrologic performance changes on the stability of landfill landslide during different phases of placement. The dynamics of rapid long run-out sliding triggered by liquefaction after slope failure was simulated with LS-RAPID software. Finally, taking typical landfill landslides worldwide into consideration, this paper discusses the geotechnical risk controls of urbanization.
《Fig. 1》

Fig.1 Location of the December 20, 2015 landslide at the construction solid waste (CSW) landfill in Guangming New District of Shenzhen, Guangdong,
《2. Basic features of the landfill and landslide》
2. Basic features of the landfill and landslide
《2.1. Geological conditions》
2.1. Geological conditions
The Shenzhen landfill is located at the foot of the northern side of Dayan Mountain, inside the Guangming New District of Shenzhen. The southern elevation of Dayan Mountain is 306.8 m. A valley with a lowest elevation of 34 m is situated on the northern side of the mountain. The original location was an abandoned open pit. According to a satellite remote-sensing image from December 2013, shown in Fig. 2(a), the pit spread toward the south and north, was surrounded by the mountain on the east, west, and south, and narrowed down at the north. The exposed bedrock of this site is composed of strongly, moderately, and slightly weathered granite, which develops into three prominent and distinctive planes with altitudes of 15°–25°∠75°–84°, 265°–270°∠48°–58°, and 210°–225°∠40°–85°, respectively. The surrounding rock mass provides the landfill with a high degree of stability. There are two types of groundwater under the surrounding rock mass, including fissure water in the block rock mass and pore water in the surface weathered granite regolith.
《Fig. 2》

Fig.2 Comparison of images showing the location, landfill, and landslide. (a) Remote-sensing image three months before the placement of CSW, taken on December 31, 2013; (b) remote-sensing-based effect image two days before sliding of landfill landslide, taken on December 18, 2015; (c) aerial view one day after the landfill landslide, taken on December 21, 2015 from an unmanned aerial vehicle (UAV).
《2.2. Landfill slope of construction solid waste (CSW)》
2.2. Landfill slope of construction solid waste (CSW)
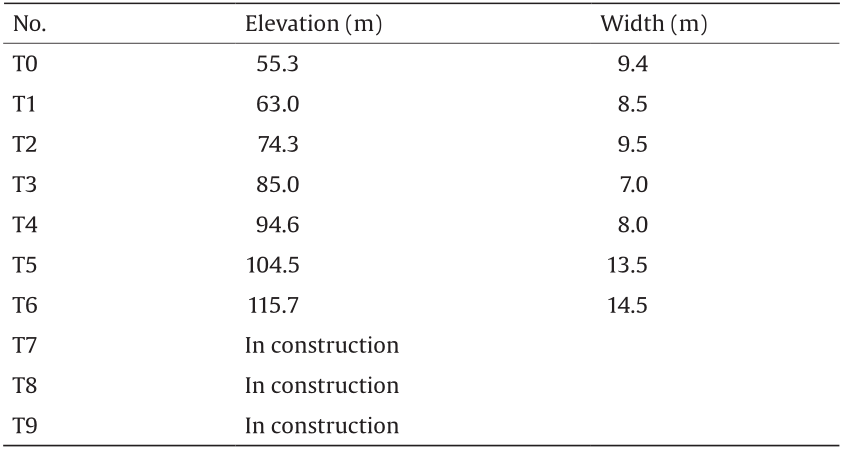
According to remote-sensing images taken two days before the landslide (Fig. 2(b), taken on December 18, 2015) and to the field investigation, the elevation of the back edge of the landfill was 160 m, and the elevation of the front edge of the bottom, consisting of boulder and gravel, was 46.1 m. Out of 10 terraces, terraces T0 to T6 had been compacted, shaped, and afforested, and terraces T7, T8, and T9 were being filled and compacted with a preliminary shape (Table 1). The general angle of the landfill slope downwards had a slope ratio of 1:2.5 (Fig. 3). The surface of the edge slope was covered with grass and with non-woven fabrics that were meant to mitigate rainfall and liquid from seeping into the landfill.
《Table 1》
Table 1
Main dimensions of the terraces and placed slope at the front of landfill before the landslide.
《Fig. 3》

Fig.3 Photograph of the engineered slope and terraces in the front of the landfill taken on October 10, 2015. The surface drainage had been constructed.
《2.3. Zoning of the landslide》
2.3. Zoning of the landslide
The impact area of this landslide was 0.38 km2, with a length of 1100 m from south to north and a width ranging from 150–630 m. The total volume of waste in the landslide was 2.73×10⁶ m3; this volume could be divided into two zones based on how much groundwater seepage was in the ground beneath the waste (Figs. 4 and 5).
《Fig. 4》

Fig.4 Zoning map of the landslide at the Shenzhen landfill. (a) Image showing the zones of the sliding source and accumulation area. The sampling sites for the ring-shear test, component observation in situ, and boreholes for permeability are indicated. (b) Topographical contour map showing the destroyed houses at the front of landslide.
《Fig. 5》
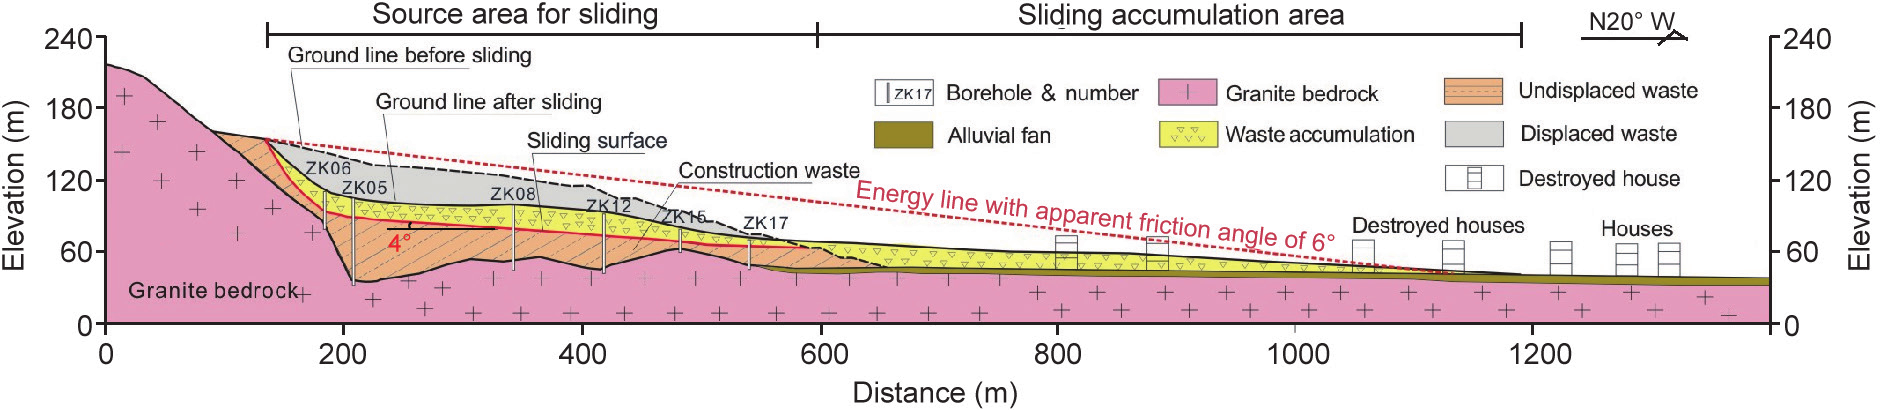
Fig.5 Longitudinal profile of the landslide at the Shenzhen landfill. The energy line is indicated from scar of landslide to the front of accumulation with an angle of 6° and the drilling holes after sliding reveal that the slip zone is translational with an angle of 4°. The landslide is exited at the terrace T1.
2.3.1. Source area of landslide
Based on a comparison of remote-sensing images from December 18, 2015 with digital elevation model (DEM) data from December 30, 2013 (before the construction of the landfill), the landfill had a volume of about 5.83×10⁶ m3 CSW before sliding. On the afternoon of December 21, 2015, the day after sliding, a UAV drone took aerial photos, shown in Fig. 2(c). The source area was located at the part of the CSW landfill that was under construction. The exiting position was at T1, with an elevation of 63 m. Based on a comparison of UAV drone aerial photos from December 21, 2015 (the day after the landslide) with DEM data from December 18, 2015, the sliding area covered 0.116 km2 and had a south-north length of 374 m and an east-west width of 400 m. The total volume of the landslide was 2.51×10⁶ m3, and its thickness ranged from 10–50 m, with an average of 30 m. There were dozens of cracks along the rear of the landfill defining a deforming mass of more than 1×10⁵ m3 in volume, shown in Fig. 6(a).
《Fig. 6》

Fig.6 Photographs taken two days after the landslide. (a) Residual unstable waste mass at the back; (b) destroyed buildings in front and the flow-like landslide accumulation with abundant water.
2.3.2. Accumulation area of landslide
The accumulation area of the landslide was located between T1 and the northern accumulation boundary, and had a south-north length of 726 m and an east-west width ranging from 150–630 m. It covered 0.236 km2 with a volume of 2.73×10⁶ m3. Its thickness ranged from 5–20 m, with an average of 10 m. The major component of the landslide was CSW, which was also mixed with rubble from the buildings destroyed in the landslide, as shown in Fig. 6(b). The volume of the accumulation area ( V2) was 2.73×10⁶ m3, while the volume of the source area ( V1) was 2.51×10⁶ m3; therefore, the coefficient of volumetric expansion was V2/ V1 = 1.08.
《2.4. Material composition》
2.4. Material composition
2.4.1. Sample statistics in situ
A field macro investigation of the material composition at the source area was conducted (Fig. 7). Based on digital photographs of 2 m×2 m sampling windows of longitude profiles, the composition of the CSW was analyzed through statistical inference (also see Fig. 4). The selected sampling windows are described as follows.
No. 1: The sampling window was located at the exit of the landslide source. It was composed of tawny sandy clay, taupe clay, and broken stone. The proportion of broken stone and taupe clay were about 5% and 12%, respectively, and the rest was tawny sandy clay (Fig. 7(a)).
《Fig. 7》

Fig.7 Photographs of the material components of the CSW from statistic windows in situ after the landslide. The CSW was derived from the constructing metro.
No. 2: The sampling window was located at the western front edge of the landslide source area. It was composed of 60% tawny sandy clay and 40% red sandy clay. The sandy clay contained about 30% of fine sand and 1–2 mm gravel particles (Fig. 7(b)).
No. 3: The sampling window was located at the west middle side of the landslide source area, with relatively clear sliding traces on the surface. It consisted of 2% CSW, such as broken stone, rubble, and steel. The rest was almost all red sandy clay with about 30% fine sand and 2–3 mm gravel particles (Fig. 7(c)).
No. 4: The sampling window was located at the western rear side of the landslide source area. It was mainly composed of tawny and red sandy clay. The red sandy clay contained less sand but more water than the tawny sandy clay. This window also had typical CSW such as concrete and steel, as well as domestic refuse scattered on top (Fig. 7(d)).
2.4.2. Analysis from boreholes
After the landslide, in order to determine the distribution of the slide zone, the geological structure of the landfill, and the geotechnical features, 27 holes with depths from 13.6–80.2 m were drilled; the total length of these boreholes was 941 m (also see Fig. 5).
(1) The geotechnical structure: The geotechnical structure of the CSW landfill could be divided into four layers from the top to the bottom:
• The first layer was the slide mass of soil with red, tawny, and grey colors. It consisted of CSW from local weathered soil from lithologies such as granite, migmatite, and sandstone. Some areas also had diluvial gravel, general cohesive soil, and soft soil. It commonly contained CSW such as baked clay bricks, as well as concrete bricks mixed with domestic refuse such as plastic and clothes. The soil was soft, loose, wet, and saturated. The core part was rough, and the fracture surface had no trace of compaction.
• The second layer was landfill soil with red and tawny colors. It consisted of CSW from local weathered soil from lithologies such as granite, migmatite, and malmstone. Some areas also had diluvial gravel and cohesive soil. It commonly contained CSW such as baked clay bricks and concrete bricks. The soil was soft and loose with poor and uneven stratification.
• The third layer was quarry spoil with tawny and red colors. It consisted of soil-rock mixtures of disjunction layers of the quarry. Major components were cohesive soil, quartz sand and gravel, granite rubble, and broken stone. The gradation was poor with no sorting. The soil was saturated, and could be drilled under static pressing. It was difficult to form the core part into a columnar shape, and easy to collapse and deform it.
• The fourth layer was moderately weathered granite with light grey and ashen colors. It had a fine granular blastic texture, a massive structure, and fracture development as well as iron staining. The core part was massive with a crisp sound when hammered; in addition, it was difficult to drill it with an alloy. It was relatively broken, and hard. The general quality grade of this pluton was level IV.
(2) The shape of the sliding plane: The boreholes revealed that the landslide slide plane was almost horizontal, with a dip angle of 4°. The sliding exit was at the T1 terrace at an elevation of 63.6 m. The landslide slide plane extended up slope for 412 m to an elevation of 93.4 m. The trailing edge had an elevation of 156 m, and was twisted into an L-shaped surface.
2.4.3. Grain-size composition
Samples of the CSW landfill were analyzed in the laboratory and found to be mainly composed of weathered soil of stratum such as granite, migmatite, and sandstone. The sieving method was applied to analyze the composition of the weathered soil, which could be divided into seven levels according to size. Grain sizes were<0.075 mm, 0.075–0.25 mm, 0.25–0.5 mm, 0.5–1 mm, and 1–2 mm; grains sized 0.5–10 mm made up 80% of the total weight.
An analysis of sample grains from the sliding plane, the accumulation, and the residual mass of the source revealed the following (Fig. 8):
《Fig. 8》

Fig.8 Grain size distribution of samples taken from the landslide.
(1) Silt and clay grain (<0.075 mm): The proportions of total weight were 41.0%–46.3%, 35.3%, and 19.2%, respectively.
(2) Sand grain (0.075–2 mm): The proportions of total weight were 25.4%–26.1%, 30.5%, and 66.4%, respectively.
(3) Gravel grain (2–20 mm): The proportions of total weight were 28.3%–32.9%, 34.2%, and 14.4%, respectively.
《2.5. Tests on physical and mechanical parameters》
2.5. Tests on physical and mechanical parameters
2.5.1. Basic physical and mechanical parameters
Our study included simple tests on the physical and mechanical parameters of seven samples collected from the surface of the landslide (Table 2). The plasticity index ( Ip) was 8.5–11.4, indicating that the soil of the landslide was silty clay or sandy clay with a low plasticity index.
《Table 2》
Table 2
Physical and mechanical properties from the conventional tests of landslide samples.

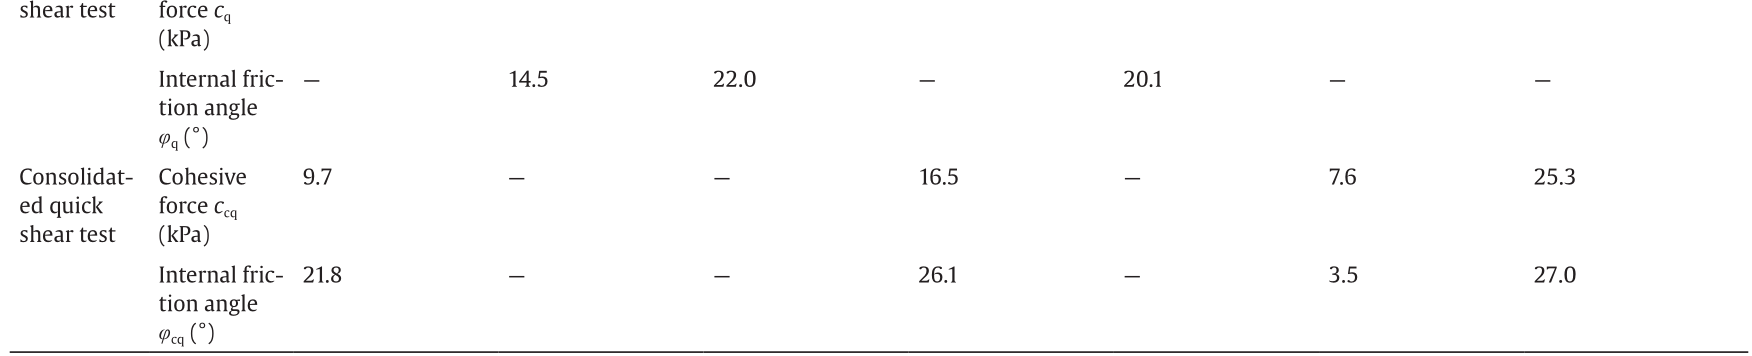
With regard to fine-grained clayey gravel sand, its average natural moisture content was 23.7%; its mean degree of saturation was 78.6%, with a maximum of 90.4%, indicating a “wet” soil body. With regard to silty clay, its average natural moisture content was 46.4% and its degree of saturation was 94.5%, which meant that the soil body was “very wet.” With regard to fine-grained clayey medium sand, its average natural moisture content was 15.9% and its degree of saturation was 47.4%, suggesting it to be “slightly wet.”
The shear strength parameters of the samples were deter-mined by direct shear. In the quick direct shear test with undrained samples, the minimum shear strength index of the samples was φq = 14.5° with cq = 7 kPa. In the consolidated quick direct shear test with sufficient drainage, the minimum shear strength index of the samples was φcq = 21.8° with ccq = 9.7 kPa.
2.5.2. Soil density and moisture content
With the aim of learning the density and moisture content of the CSW of the landfill before the landslide, this study adopted the regular cutting-ring method to collect 34 samples from the residual terraces of the landfill after the landslide, and tested these samples in the laboratory (Table 3).
《Table 3》
Table 3
Test results of moisture content and dry density from samples (cutting-ring test).
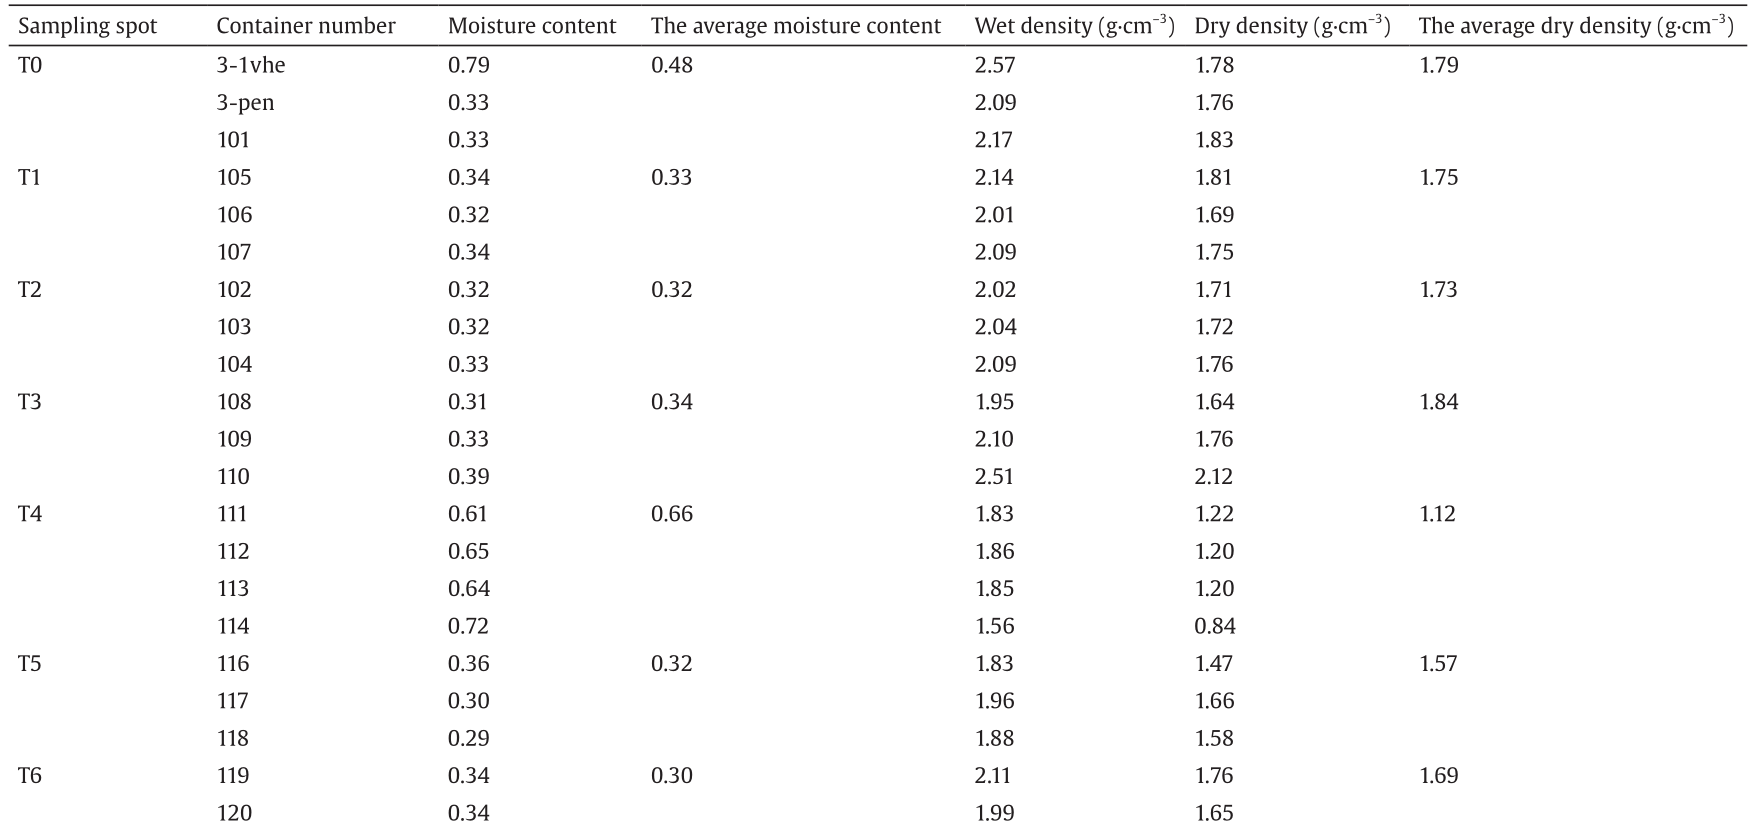

The dry density of the soil in terraces T1 to T7 was between 1.30 g·cm–3 and 1.81 g·cm–3. Accordingly, its relative compaction was 70%–100%. The dry density of the soil in the terraces that were compacted by bulldozers and other vehicles was 1.81 g·cm–3, and the dry density of the soil on the slopes without compaction was 1.3–1.5 g·cm–3. Therefore, the main variation trend of the dry density was that it decreased along with the increase of the elevation of the terrace. The dry density values of the soils in the compacted terraces that were measured by the test of filling sand into a digging pit were similar to the results from the cutting-ring methods.
The moisture content of terraces T1 to T6 was between 18% and 20% (by mass). Accordingly, the degree of saturation was 45%–50%. The average moisture content of terrace T7 was 32% (by mass) and its degree of saturation was 83%. Furthermore, the groundwater on terrace T4 was the most abundant, with a moisture content of 53%–85% and a degree of saturation of nearly 100%.
2.5.3. Shear strength index
(1) Triaxial pre-consolidated undrained shear test on CSW: According to the initial density and water content of the soil samples measured in situ, two types of low-density samples were prepared with different values of degree of saturation. Afterward, we set up a pre-consolidated test in a confined pressure of 50–500 kPa on a triaxial vehicle and conducted an undrained shear test to determine the shear strength index of the soil samples. One of the low-density samples had an initial dry density of 1.3 g·cm–3 and a degree of saturation of 48%. The experimental results were as follows: internal friction angle φcu = 24.8° and cohesion ccu = 22 kPa. The other low-density sample had an initial dry density of 1.3 g·cm–3 and a degree of saturation of 66%. The shear strength measured in this sample was: internal friction angle φcu = 22° and cohesion ccu = 3.4 kPa.
(2) Direct shear test on silt layer: We collected disturbed soil samples with intercalated silt layers in CSW from terrace T4, which was located at the southwestern side of the landslide source area. We conducted repeated direct shear tests in order to determine the residual shear strength index. The result of these tests was: internal friction angle φr = 17° and cohesion cr = 10 kPa.
《3. Mechanism of landslide failure》
3. Mechanism of landslide failure
Our initial investigations suggested that the triggering mechanism of the CSW landslide at the Shenzhen landfill was water related; that is, water builds up within the waste mass from rainfall and direct placement of wet solid waste. Many other studies of similar materials indicate a similar cause of failure [1]. Koerner et al. [5,6] used the simplified Bishop method to analyze the stability of ten large landfill failures in which five were unlined or soil lined, and five were lined with one or more geosynthetic materials. Excessive liquids, generating high pore water pressures above, below, and within the failure surfaces, were the triggering mechanisms and contributing causes of failure in all ten case histories presented and analyzed in their studies [5,6]. Stark et al. [7] discussed the cause of a waste slide in Cincinnati, Ohio, USA. A 9–20 m thick layer of waste was placed over an existing 60 m high waste pit in the 14 months prior to that waste slide. This corresponds to an average filling rate across the slope of 0.02–0.05 m·d–1. It was thought that this filling may have generated excess pore water pressure in the brown native soil and, consequently, a decrease in the effective normal stresses acting on the failure surface [7].
Thus, we investigated the mechanism of landslide failure from the perspective of a gradual cumulative fill-placement processes and the hydrologic performance of the CSW.
《3.1. Placing processes of CSW at landfill》
3.1. Placing processes of CSW at landfill
According to the remote-sensing images and the field investigation, the volume of CSW in the landfill was 5.83×10⁶ m3 before sliding. Terraces T0 to T6, up to an elevation of 115.7 m, had been compacted into shape, with a total volume of 4.856×10⁶ m3. Between May and December, 2015, terraces T7, T8, and T9, located at the back of the CSW landfill with an elevation of 115–160 m, were still in construction (Fig. 9). According to the statistics from muck carrier vehicles, the total volume of CSW landfill added during the 233 days from May 1, 2015 to December 20, 2015 was about 9.74×10⁵ m3.
《Fig. 9》

Fig.9 Remote-sensing image showing the landfill, terraces, and engineered slope on December 18, 2015. The landfill was divided into two units: the front landfilled slope unit with low water-bearing CSW, and the rear placing and ponding unit with rich water-bearing CSW.
In order to simplify the analysis, the placing process of the CSW at the landfill was divided into five stages (Fig. 10), with the first stage being the main placing stage of the front landfill slope and terraces at the landfill. The second to fifth stages were the placing stages of CSW in the rear pond of the landfill. However, it is noticeable that the design and construction of the CSW landfill only considered surface drainage ditches and blind ditches, and did not include ground drainage facilities.
《Fig. 10》

Fig.10 Longitudinal profile showing the placing phases and the landfill slope structures. The rear slope with terraces T0 to T6 had been shaped prior to April 31, 2015, and the rear pond was gradually filled from May to December of 2015 with a volume of near 1×10⁶ m3. The surface water during the rainfall at back was directly runoff to the pond due to low permeability of the slope.
《3.2. Rainfall and infiltration》
3.2. Rainfall and infiltration
In landfill designs, the hydrologic evaluation of landfill performance (HELP) model can be applied to account for the effects of surface storage; snow melt; runoff; infiltration; evapotranspiration; vegetative growth; soil-moisture storage; lateral subsurface drainage; leachate recirculation; unsaturated vertical drainage; and leakage through soil, geomembrane, or composite liners [8]. It is difficult, however, to reconstruct the hydrologic performance of the Shenzhen landfill. Therefore, we considered only a few simple factors such as precipitation, average runoff volume, and seepage.
3.2.1. Runoff due to rainfall
The average annual precipitation for the region where the Shenzhen landfill is located is 1605.3 mm. The rainy season lasts from April to September. We examined precipitation records since January, 2014 for the Tangjia Observation Station of Precipitation, which is located about 2 km away from the landfill. The maximum precipitation during this period, occurring on May 11, 2014, was about 147.2 mm (Fig. 11(a)). According to the field investigation, there were two gullies at the rear of the landfill. One of these was located in the south, with a topographic slope of 11°, a length of 500 m, and a catchment area of 50 000 m2. The other one was located in the southwest, with a topographic slope of 17°, a length of 240 m, and a catchment area of 24 000 m2. Thus, the total catchment area was about 74 000 m2. The groundwater of the CSW landfill mainly came from the surface water of the slope and the infiltrated groundwater from the surrounding granite rock mass.
《Fig. 11》
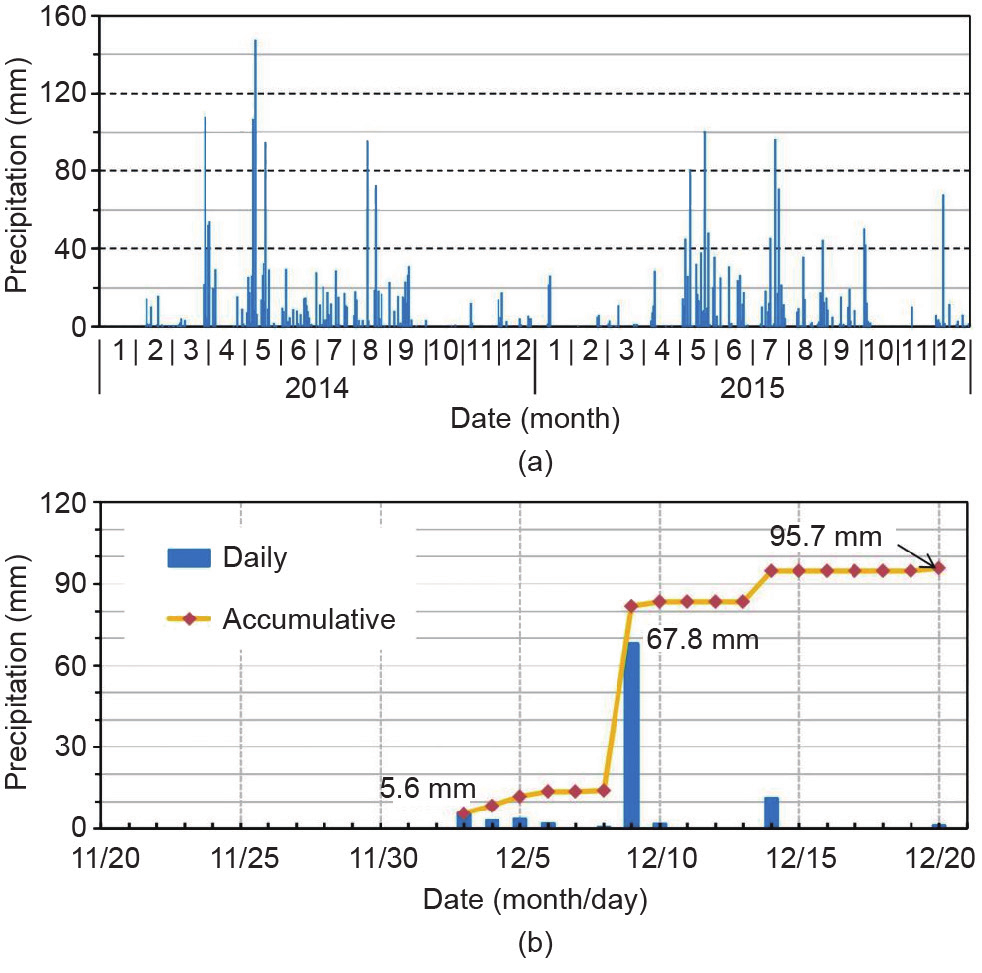
Fig.11 Graphs of precipitation at the Shenzhen landfill. (a) From January 1, 2014 to December 31, 2015, the concentrating period of rainfall was in May and August of 2014 and in May and July of 2015; (b) one month prior to the landslide, a heavy rainfall with an amount of 67.8 mm occurred on December 9, 2015, only 11 days before landslide.
The two gullies had dense vegetation coverage, with an intensive weathered layer of granite on the surface; and groundwater seepage can last for a long time. The hydrogeological structure in the landfill was controlled by the placing process. Accordingly, we may divide the seepage process of the groundwater into five phases in the landfill (Table 4).
《Table 4》
Table 4
Estimated water volume runoff to the rear space of the landfill from rainfall at various stages of placement.

3.2.2. Seepage and hydraulic conductivity
The piezometric level acting on the sliding plane at the time of failure was not measured. As a result, the piezometric level had to be estimated. In this paper, the rain water runoff from the catchment was used to estimate the piezometric levels and pore water pressures in the landfill.
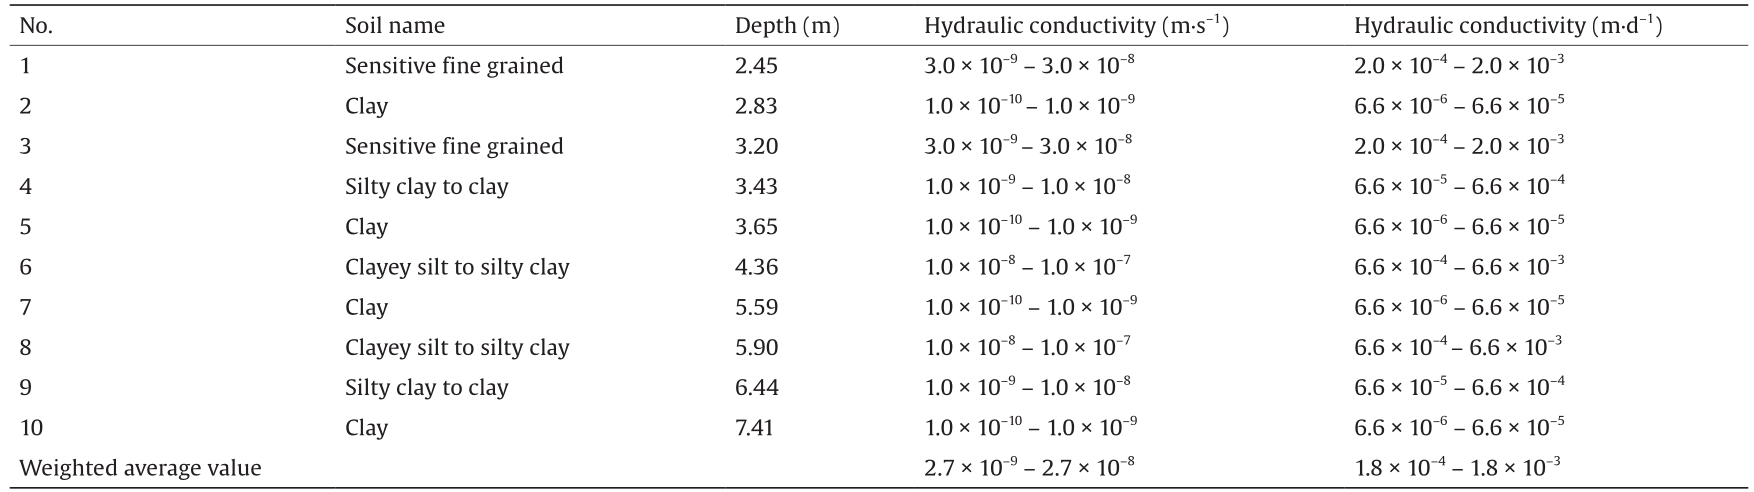
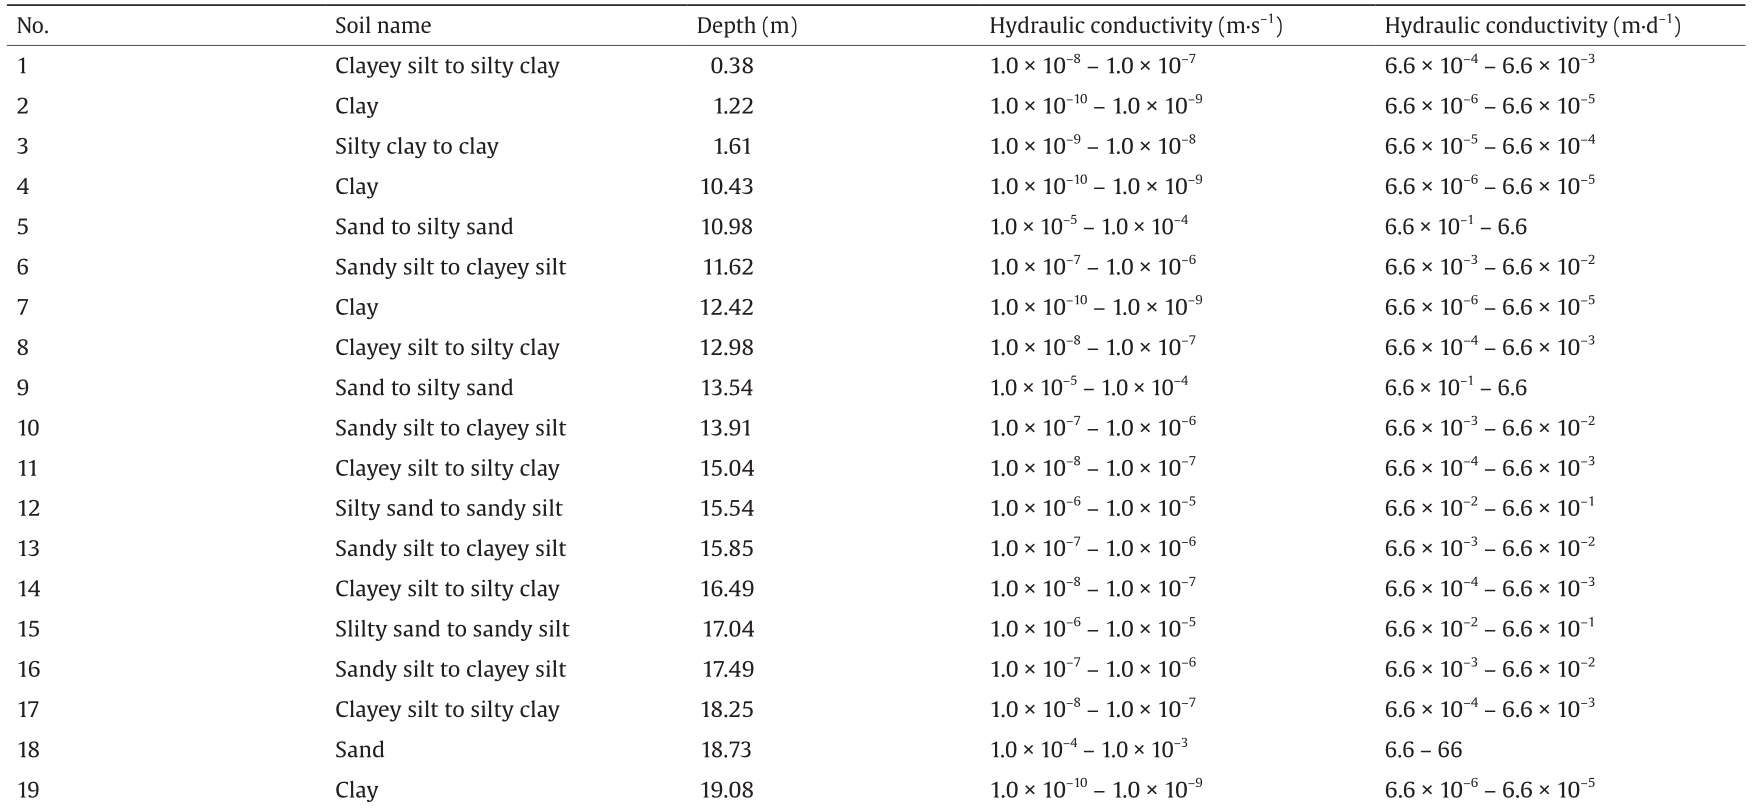
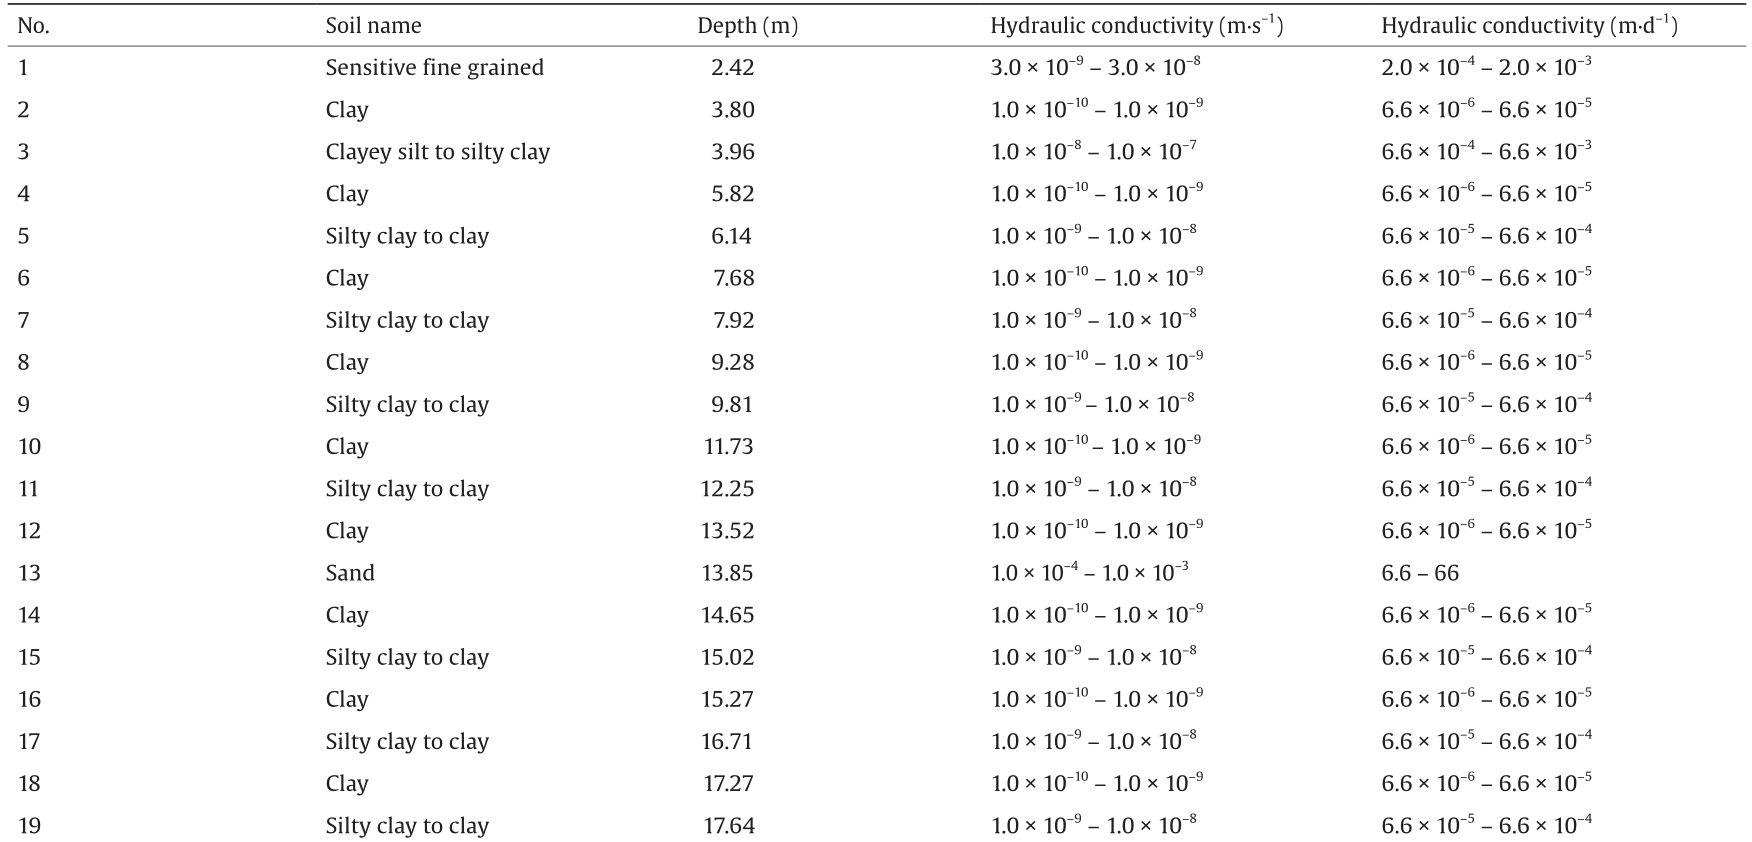
The CSW under terrace T6, with an elevation of 115.7 m, was compacted and the cut-off ditch, platform drainage, and chute were set on the surface of the slope. Therefore, we considered it reasonable to ignore the influence of the precipitation infiltration. In order to investigate the possible presence of perched aquifers, the hydraulic conductivities were estimated based on the data of the layered soil of the landfill obtained by static cone penetration tests (CPTs) in the field (also see Fig. 4(a)). Specifically, the hydraulic conductivity of borehole B1 in terrace T1 was between 1.0×10⁻¹⁰-1.0×10⁻⁷ m·s–1; this sample mainly consisted of a clay layer, with a weighted average value of 2.7×10⁻⁸ m·s–1, belonging to an extremely weak permeable layer (Table 5). The hydraulic conductivity of borehole B2 in terrace T3 was 1.0×10⁻¹⁰ -1.0×10⁻³ m·s–1; this sample consisted of a highly permeable sand layer interbedded with a low permeability clay layer that combined together into multiple confined aquifers. The hydraulic conductivities in the confined aquifers varied obviously, with a weighted average value of 3.6×10⁻⁵ m·s–1, and belonged to a middle permeable soil layer interbedded with highly permeable sand layers (Table 6). The hydraulic conductivity of borehole B3 in terrace T5 was 1.0×10⁻¹⁰ – 1.0×10⁻³ m·s–1; this sample mainly consisted of clay and sandy clay, with a weighted average value of 1.4×10⁻⁵ m·s–1. This layer belonged to a medium permeability soil layer interbedded with a highly permeable sand layer with a thickness of 33 cm (Table 7).
《Table 5》
Table 5
In borehole B1: Calculation of hydraulic conductivity of landfill after sliding (also see Fig. 4).
《Table 6》
Table 6
In borehole B2: Calculation of hydraulic conductivity of landfill after sliding (also see Fig. 4).

《Table 7》
Table 7
In borehole B3: Calculation of hydraulic conductivity of landfill after sliding (also see Fig. 4).

The hydraulic conductivity of the fresh CSW was much higher than that of the existing landfill CSW [9]. Therefore, it could be speculated that the hydraulic conductivity of the new CSW was 1.0×10⁻⁵ – 1.0×10⁻⁴ m·s–1, or, 0.1–10.0 m·d–1 in magnitude.
《3.3. Structure of the landfill》
3.3. Structure of the landfill
The placement of CSW in the Shenzhen landfill was a gradual loading process. Bounded by terrace T6, the landfill could be divided into two units: a front landfill slope unit, and a rear placing and ponding unit (also see Fig. 9).
(1) The front landfill slope unit: Through rolling compaction, this unit had a low water content and better soil consolidation. The dry density was 1.30–1.81 g·cm–3, decreased with increasing terrace elevation, and the corresponding relative compactness was 70%–100%. However, the drilling and the CPTs after sliding showed there were multiple soft and plastic clay layers or silt interlayers in the slope, in which the water content was more than 45%. An in situ CPT showed the tip resistance to be less than 1 MPa. Because the cohesive soil had a high water content and low hydraulic conductivity, it was difficult to compact it or to compact it quickly. Weak interlayers were formed with aquitards in slope. Therefore, multiple confined aquifers were present in the slope.
(2) The rear placing and ponding unit: Because of the direct placement of the CSW and the undrained existing water body with a volume of 80 000–90 000 m3 in the bottom of the open pit, the soil body was formed with high water content and poor consolidation. The load of solid waste on the top caused some consolidation effects on the highly saturated CSW at the bottom, causing an increase of pore pressure. Because the front landfill slope unit was higher, the rear placing and ponding unit became a relatively lower closed pond. After rainfall, surface water flowed directly into this pond, and the continued placement of CSW gradually elevated the position of water infiltration. The pore water pressure head or piezometric head in the slope correspondingly and continually increased.
《3.4. Multistage modeling and simulation》
3.4. Multistage modeling and simulation
In theory, research on the placing rate of CSW and the hydrogeological performance in a landfill can use the superposition method to calculate to any desired precision. Based on the placing process of the CSW, we adopted five stages in analyzing the performance.
According to documented cases around the world, the two main types of failure of an MSW landfill are rotational and translational failure [1]. Excess pore water pressure is the most emphasized reason for landfill stability failure [2,6,10,11]. Our calculations used the coupling method through the seep analysis module and the slope-stability analysis module of Geo-Studio software [12]. The type of CWS landslide at the Shenzhen landfill was considered to be translation/rotation, and the groundwater was unstable, so the Morgenstern-Price method with a transient flow simulation was applied to analyze the stability of the landslide. Physical and mechanical parameters for the calculation are listed in Table 8 based on survey results taken after the landslide.
《Table 8 》
Table 8
Main physical and mechanical parameters chosen for the factor of safety (FOS) calculation of the initial landslide.

3.4.1. The first placing stage
The first placing stage was from May 1, 2014 to April 30, 2015, lasting 365 days, during which time nearly 4.856×10⁶ m3 of CSW was placed. Terraces T0 to T6 and the basic landfill slope took shape, and the terrain slope was about 20×. During this first stage, prior to April 30, 2015, rain flowed directly to a bedrock open pit with a total volume of about 1.438×10⁵ m3; that is, about 393.96 m3·d–1 on average. Because groundwater drainage facilities were not built, the groundwater below an elevation of 63 m could not be drained (also see Fig. 2(a)). Hence we assumed that the groundwater level in the first stage did not exceed an elevation of 63 m. Geo-Studio shows that the groundwater level was under 63 m, nearly horizontal, and that the pore water pressure was generally 150 kPa, with a maximum at the rear of the landfill of about 300 kPa, as shown in Fig. 12(a). The stability calculation demonstrated that because of the gentle slope, about 20° below terrace T6, the influence of groundwater on the front slope was not apparent. As shown in Fig. 12(b), the factor of safety (FOS) of the possible failure slope was 1.401, so the stability was good.
《Fig. 12》

Fig.12 The first stage of CSW placement. (a) Geo-Studio simulation of seepage in the landfill. The seepage is simulated to show a pore pressure distribution. The level is assumed less than bedrock peak with an elevation of 63 m. (b) FOS of possible failure slope. The FOS is high due to the level is under the potential sliding plane.
3.4.2. The second placing stage
The second placing stage was from May 1, 2015 to June 31, 2015, lasting 61 days, during which nearly 2.2×10⁵ m3 of CSW was placed. The front slope of the landfill reached an elevation of 115.7 m, causing a pond to form at the lower rear of the landfill. Runoff from rain flowed directly from two gullies to the pond and infiltrated the CSW landfill. The volume of surface water was about 5.68×10⁴ m3; that is, about 393.96 m3·d–1 on average. Because the hydraulic conductivity of the front slope was low, the groundwater in the north of terrace T3 could not drain effectively. The existing groundwater was plentiful in the first stage. The addition of the exiting water and the surface water caused a backwater effect in the ponding area at the rear of the landfill. The piezometric level apparently rose from 63 m to 81 m, and the pore water pressure was generally 200 kPa, with a maximum ranging from 400 kPa to 600 kPa (Fig. 13). The groundwater level in the front slope did not change, and the FOS of the possible failure slope was the same as in the first stage, FOS= 1.401. The stability was good.
《Fig. 13》

Fig.13 The second stage of CSW placement. (a) Geo-Studio simulation of seepage in the landfill. The groundwater level is rising at the rear due to infiltration of surface water, but slightly changes in the front slope due to the low hydraulic conductivity. (b) FOS of possible failure slope. The FOS is slightly declined due to the water level is only approach to the sliding zone.
3.4.3. The third placing stage
The third placing stage was from July 1, 2015 to August 31, 2015, lasting 61 days, with a placement of nearly 2.03×10⁵ m3 of CSW. The surface water from rain still flowed directly from two gullies to the pond and infiltrated the CSW landfill. The volume of surface water was about 3.91×10⁴ m3; that is, about 640.77 m3·d–1 on average.
In the open pit, the CSW soil was saturated due to rich groundwater. The ZK5 and ZK17 boreholes (also see Fig. 5) that were drilled after the landslide revealed that the main components of CSW in the open pit were cohesive soil, quartz sand, gravel, and granite breccia, with a poor grading and no separation. The drill core was hard to form into a pile shape, and easily loosened and deformed due to the degree of saturation of the soil. The natural moisture content of the deep red clay ranged from 45.9% to 46.9%, and the degree of saturation ranged from 94.4% to 94.5%. The natural moisture content of the greyish brown sandy clay ranged from 21.5% to 23.1%, and the degree of saturation ranged from 69.0% to 69.4%. If classified by water content, the moisture of the CSW ranged from “wet” to “very wet”; by degree of saturation, the moisture of the CSW ranged from “wet” to “saturated.” The gradual loading from the upper CSW placement caused consolidation of the lower soil mass with high water content and resulted in excess pore water pressure. Chen [13] referred to such pore water pressure as infiltration-induced pore pressure and external load-induced pore pressure, and discussed the addition of pore pressures. Li [14] expanded on Chen’s viewpoint. We adopted their thinking, which suggested that the infiltration-induced pore pressure was higher than the external load-induced pore pressure.
Therefore, in the rear of the landfill, the piezometric level rose from 81 m to 86 m, and the pore pressure was about 400 kPa, with a maximum from 400 kPa to 500 kPa. In the middle of the landfill, the piezometric level rose from 65 m to 75 m, and the pore pressure reached 400 kPa. In the front landfill slope, the groundwater level did not change, remaining at 63 m (Fig. 14(a)). The FOS of the future failure slope decreased slightly, to 1.301. The stability was still good (Fig. 14(b)).
《Fig. 14》
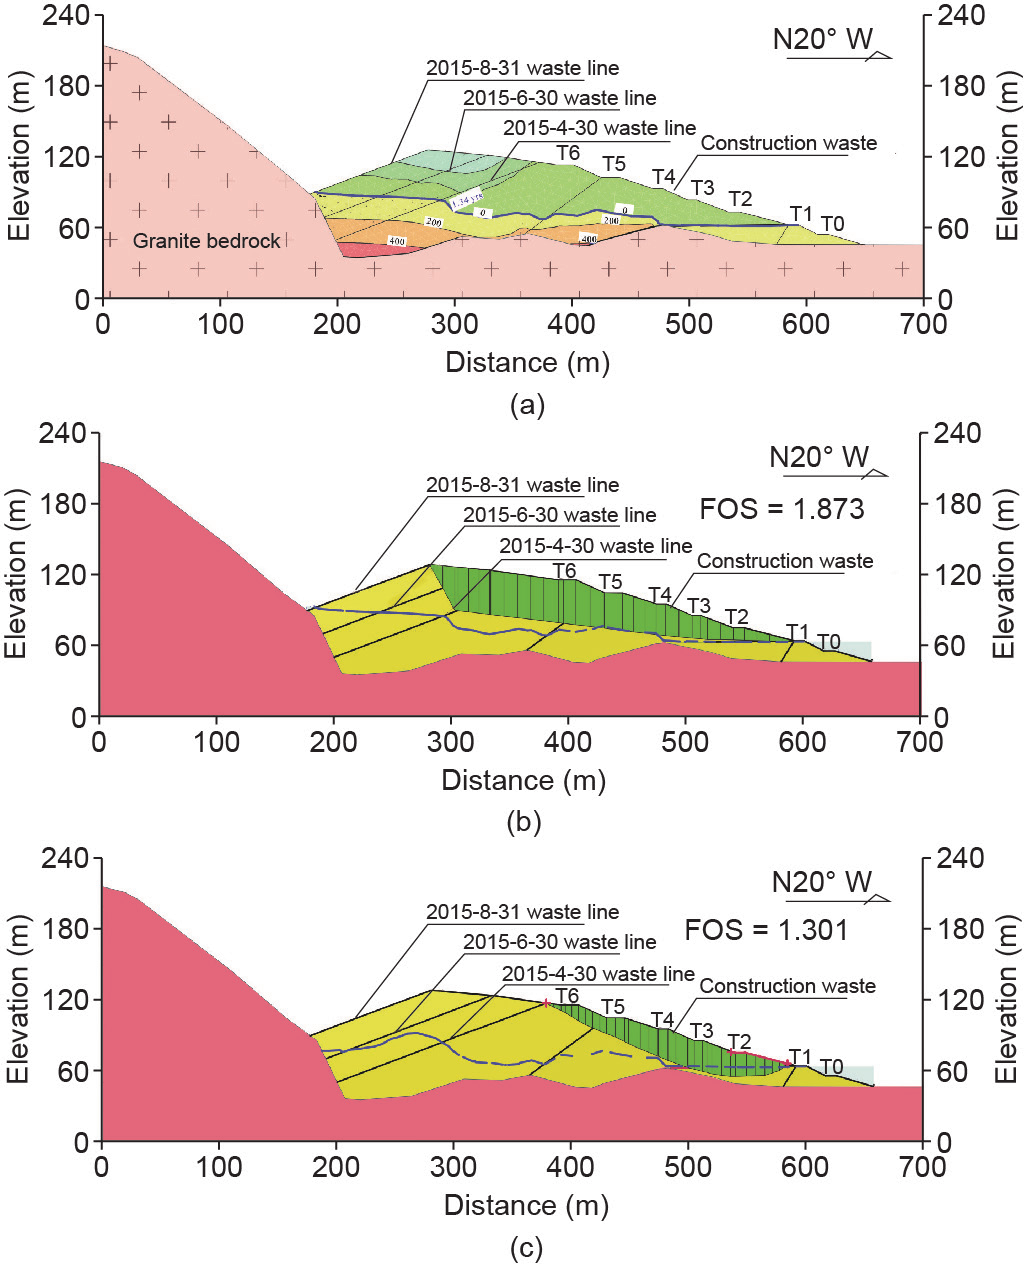
Fig.14 The third stage of CSW placement. (a) Geo-Studio simulation of seepage in the landfill; (b) FOS of whole possible failure slope; (c) FOS of front possible failure slope.
3.4.4. The fourth placing stage
The fourth placing stage was from September 1, 2015 to October 31, 2015, lasting 61 days, during which nearly 3.83×10⁵ m3 of CSW was placed. The runoff due to rain still flowed directly from two gullies to the pond and infiltrated the CSW landfill. The volume of surface water was about 1.801×10⁴ m3; that is, about 295.27 m3·d–1 on average.
In the rear of the landfill, the piezometric level rose from 86 m to 97 m, and the pore pressure changed slightly; it was generally 400 kPa, with a maximum from 400 kPa to 500 kPa (Fig. 15(a)). In the middle of the landfill, the groundwater level rose from 75 m to 81 m. The elevation at the position of the infiltration area was above 121 m, forming a water head difference of at least 40 m with the middle groundwater level, and causing excess pore water pressure, from 600 kPa to 700 kPa. In the front of the landfill, the groundwater level rose slightly, to about 65 m. Due to the rising groundwater level in the middle and front slope, a new potential slide area formed in the northern part of terrace T6. The FOS of the possible failure slope decreased markedly, to 1.075. The stability decreased, coming close to a critical state (Fig. 15(b)).
《Fig. 15》

Fig.15 The fourth stage of CSW placement. (a) Geo-Studio simulation of seepage in the landfill; (b) FOS of whole possible failure slope; (c) FOS of front possible failure slope.
3.4.5. The fifth placing stage
The fifth placing stage was from November 1, 2015 to December 20, 2015, lasting 50 days, during which nearly 1.68×10⁵ m3 of CSW was placed. According to the field investigation on the third day after the landslide, there was still a stream of flowing water in the second gully, with a measured discharge of 6 m3·d–1, causing a continuous water supply (Fig. 16). The volume of runoff from the two gullies was about 7452 m3; that is, about 152.1 m3·d–1 on average. Although the amount of surface-water infiltration was generally less than during the previous stages, there was heavy rainfall of 67.8 mm on December 9, accumulating to 95.7 mm by the time of the landslide, and aggravating the failure of the slope (also see Fig. 11(b)).
《Fig. 16》

Fig.16 Gully runoff due to rainfall and continual infiltration to the fresh landfill waste mass at the rear of the landfill. (a) South gully and trench at back, taken on November 24, 2015; (b) permanent discharge of southwest gully to landfill, taken on December 21, 2015.
In the rear of the landfill, the piezometric level rose from 97 m to 147 m; in the middle, it lowered to 112 m (Fig. 17(a)). The excess pore pressure increased dramatically, to a maximum of 800 kPa. In the middle of the landfill, the groundwater level change caused a hydraulic jump. The piezometric level decreased from 112 m to 68 m, and the groundwater head difference was 44 m, creating excess pore water pressure of 800–1000 kPa. In contrast to the first four stages, the piezometric head in the front of the landfill slope rose from 65 m to 78 m, resulting in a significant increase of pore water pressure. The simulated result of the existence of a piezometric water head in the landfill was confirmed by drilling two days after the landslide, when artesian water flowed from all four drill holes on terrace T3. The depths of these four holes, respectively, were 7.0 m, 9.4 m, 10.5 m, and 19.5 m (Fig. 18, also see Fig. 4(a)).
《Fig. 17》

Fig.17 The fifth stage of CSW placement. (a) Geo-Studio simulation of seepage in the landfill; (b) FOS of whole possible failure slope; (c) FOS of front possible failure slope.
《Fig. 18》
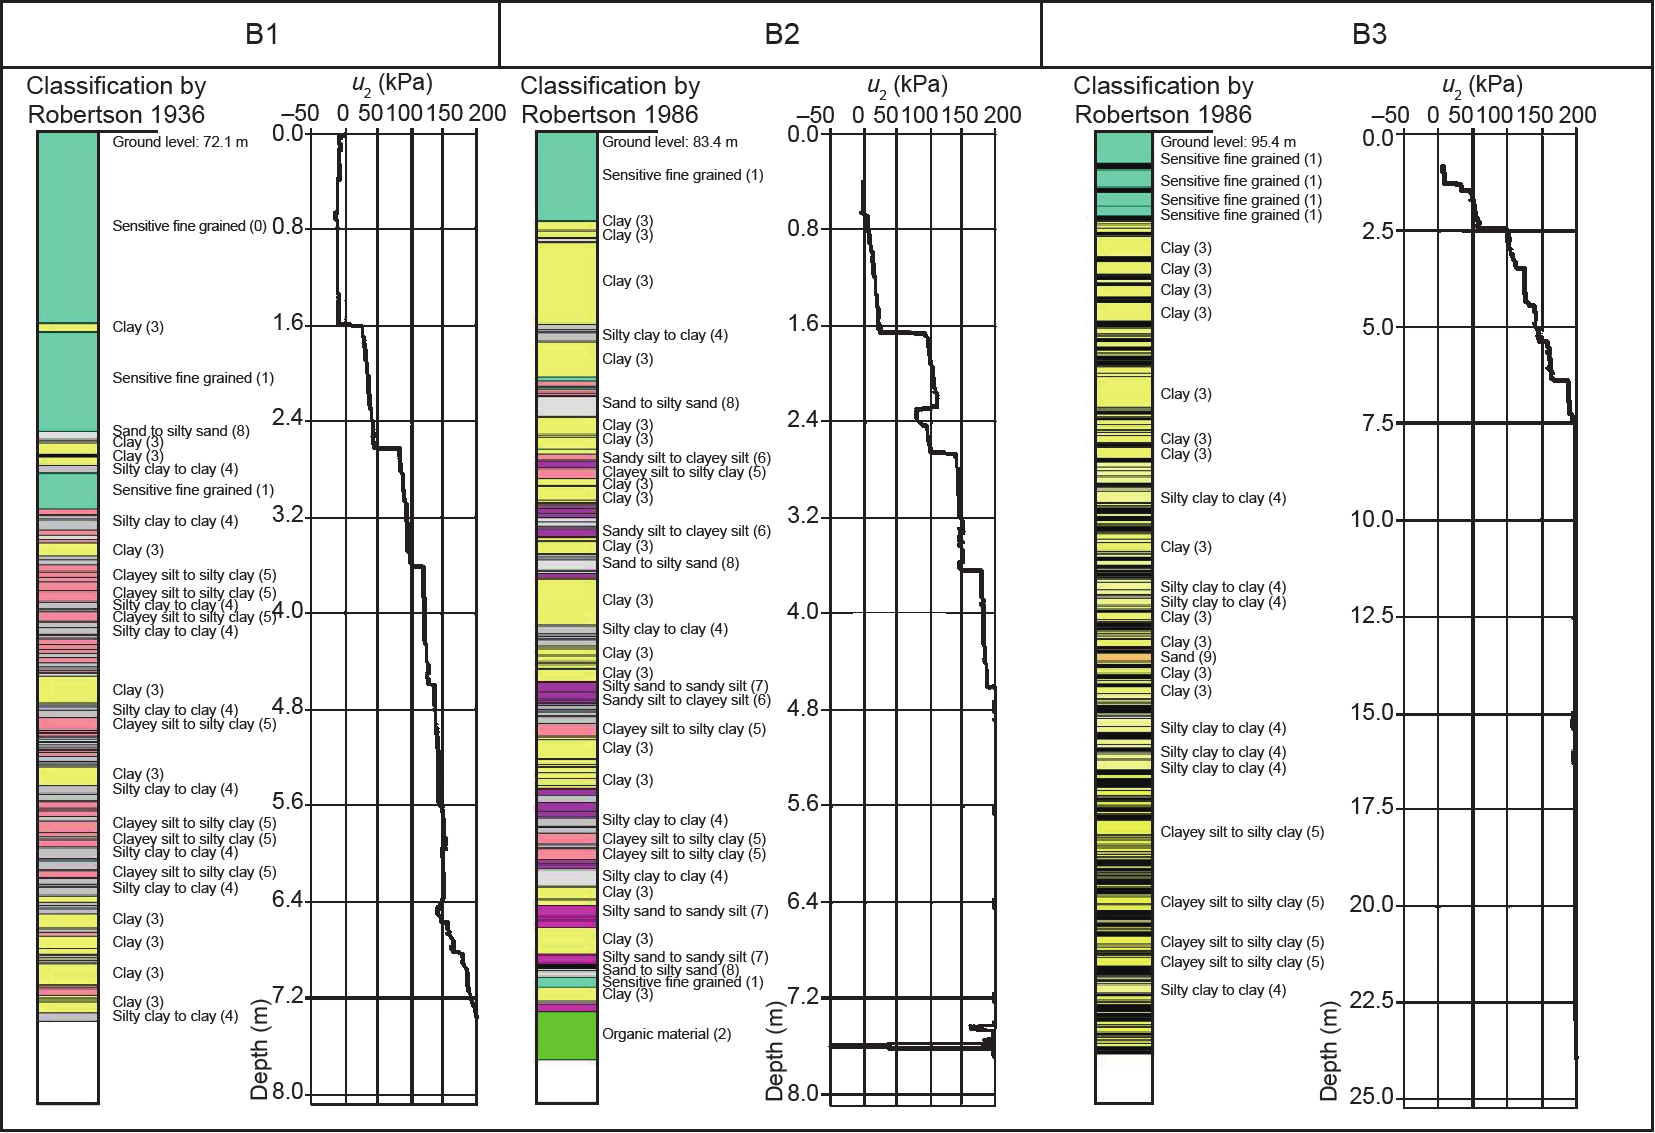
Fig.18 Measured curves of pore water pressure in the landfill and landslide after sliding. The position of boreholes to measure pore water pressure can been seen in Fig. 4(a).
In the rear of the landslide, the rise in groundwater level and the consolidation-induced seepage of the CSW in the lower part formed the driving source of the sliding. Meanwhile, in the middle and front of the landfill, both the infiltration and the external load induced a marked increase in pore pressure, resulting in a decrease of the resisting force in the front area. Calculation shows that the FOS of the possible failure slope was 0.918, suggesting that the landslide possibly had started (also see Fig. 17(b)).
This situation, in which the elevation of surface-water infiltration gradually rose as the placement of the CSW rose in the rear of the landfill, was similar to the 1.2×10⁷ m3 landfill failure and liquefaction that occurred in Cincinnati, Ohio, USA, which was caused by excess pore pressure. In that case, the excess pore pressures represent externally generated pressures in the back pond of fresh landfill waste that were higher than would be the case under normal hydrostatic conditions in existing landfill waste [6].
The above analysis indicated that the Shenzhen landfill could be divided into a front unit (the landfill slope with low moisture content) and a rear unit (the placing unit with ponding and high moisture content). This dual structure brought about two effects: first, surface-water infiltration, in that externally generated pressures at the back pond of fresh landfill waste were higher than would be the case under normal hydrostatic conditions in an existing landfill slope; and second, consolidation seepage, in that the externally generated load from upper placement of waste in steps leads to excess pore pressure in the lower saturated soil body. Therefore, groundwater seeped from the rear unit into the front unit, causing a decrease of stability of the front slope, and inducing the landslide.
《4. Dynamic analysis of the long run-out sliding》
4. Dynamic analysis of the long run-out sliding
This section used a dynamics analysis to study landslide mobility after failure. The study focused on a landslide hazard and risk assessment in order to identify the hazard level, the area exposed to hazard, and the landslide velocity if a landslide were to occur [15–17].
《4.1. Ring-shear test results》
4.1. Ring-shear test results
To improve the understanding of the high mobility of the Shenzhen landside, a series of laboratory tests and numerical simulations were performed. Ring-shear devices are most appropriate for studying large displacements and high shear speeds in order to evaluate post-failure motion. We employed a large ring-shear apparatus (DPRI-5) at Kyoto University (Japan) to examine the undrained shear behavior of the landslide materials. The ring-shear apparatus is extensively used in landslide research, and further details concerning its principles can be found in, for example, Sassa et al. [18,19]. In this study, several samples from the source area of the landslide were tested under fully softened and residual-shear-strength conditions [20]. These experimental results were used to provide appropriate parameters for the subsequent simulations of landslide motion. Moreover, as mentioned in the previous sections, pore water had a significant influence on the initiation and run-out processes. A comparative trial was also conducted under dry conditions to explore the possible role of water lubrication during run-out.
4.1.1. Sample characteristics and test programs
Geotechnical index properties were measured for the landslide materials, as indicated in Tables 2 and 3, and Fig. 8 presents the grain-size distribution of the soil sample. Due to a grain-size limitation imposed by the shear box, gravels>5 mm were removed by sieving before ring-shear testing. The excluded gravel comprised 12% by weight of the sample. As Kuenza et al. [21] pointed out, the shear behavior of soils is mainly controlled by the matrix material when the gravel content is<40%. Therefore, we believe that excluding the coarser materials had little, if any, effect on the shear behavior in the ring-shear tests.
For the undrained ring-shear tests, all samples were prepared by pouring oven-dried soils into the shear box in layers [22]; the samples were then saturated by standard procedures, including using CO2 to remove air from the sample and de-aired water to fill the void space of the sample [18]. The degree of saturation was evaluated by invoking the pore pressure coefficient of BD, as suggested by Sassa et al. [16]. Note that all the test samples were saturated with an index of BD>0.95. To examine the undrained shear behavior, all saturated samples were consolidated under a given normal stress and then sheared to residual state using a shear-speed-controlled method, in which the shear stress was gradually increased with the given rate (2 kPa·s–1) to failure. After failure, the sample was deformed at a shear speed of approximate 60 mm·s–1 to the residual strength condition. Three levels of normal stress (200 kPa, 400 kPa, and 600 kPa) were involved in order to determine the potential reduction of undrained strength in the effective stress path. The response of the pore water pressure for the saturated sample was measured during the rapid shearing.
4.1.2. Test results and discussion
Representative undrained ring-shear test results and the effective stress path for the tested landslide materials are shown in Figs. 19 and 20, respectively. Fig. 19 shows the curves of shear stress and pore water pressure as a function of shear duration for different normal stresses. The tests indicated that the normal stress had little effect on the undrained shear behavior, which generally exhibited Skempton’s softened characteristics.
《Fig. 19》

Fig.19 Results of undrained ring-shear tests on saturated sample: shear stress, pore water pressure, and shear displacement versus elapsed time under normal stress (a) 200 kPa, (b) 400 kPa, and (c) 600 kPa.
《Fig. 20》

Fig.20 Results of undrained ring-shear tests on saturated sample: effective stress path. Initial densities are, respectively, 1.70 g•cm–3, 1.75 g•cm–3, and 1.82 g•cm–3 under normal stresses from 200 kPa, 400 kPa, and 600 kPa. CL—collapse line; RFL—residual failure line.
First, with increasing shear stress at the controlled loading rate (2 kPa·s–1), pore water pressure gradually increased at relatively small displacements of millimeters. This result was mainly attributed to the reason that the collapse of a metastable structure can induce a build-up of pore water pressure before the occurrence of shear failure in this type of undrained shear test [22–24]. It should also be pointed out that a lagged response (of tens of seconds) of pore water pressure was observed during this loading stage. This was due to the fact that the test sample contained a high proportion of fine particles (also see Fig. 8), resulting in low permeability.
Second, with the progress of loading to failure (see the marked points in Fig. 19), the shear strength dropped by tens of kilopascal after the failure of the sample when initially softened. This strength loss generally appeared to be a slight positive tendency of normal stress, and accompanied the increase of pore water pressure.
Third, after failure following further increase of shear displacement at high shear speed (~ 60 mm·s–1), it was observed the shear stress and pore water pressure fluctuated at a large shear displacement. Post-test inspection revealed a better-developed shear zone with lower porosity than the remainder of each sample, and showed that shear surfaces were obstructed by gravel particles.
The effective stress path for the three undrained ring-shear tests is plotted in Fig. 20, and two straight lines were fitted to the experimental data. The dashed line was fitted through the peak values where the reduction of shear strength was initiated, and projected back through the origin; this is called the collapse line (CL) in some studies [25,26]. The CL of the tested materials from the landslide has a slope of about 24°. The other line (the black solid line in Fig. 20) was fitted through the steady-state strength at which soils undergo a steady state of deformation (i.e., continuous deformation under constant shear stress and constant effective confining pressure at constant volume and constant speed). This line was called the residual failure line (RFL) and had an inclination of about 33°. Like the CL, it projects back through the origin. Soils in an initial state above the CL are not susceptible to strength softening, whereas soils below the CL are susceptible to strength reduction if (and only if) the static shear stress exceeds the residual strength of the soils. Although the most effective approach to evaluate the high mobility of landslides is still under wide discussion, the undrained ring-shear tests for landslide materials shown in Figs. 19 and 20 indicate that the materials had a potential strength loss due to displacement softening, and that the landslide mobility would be elevated.
Because the field conditions of the landslide were rather perplexing, another comparative trial was conducted under dry conditions in order to explore the possible role of water lubrication during sliding. This was done because the field evidence showed that the landslide materials had high water content. As shown in Fig. 21, the strength spectra for the dry sample, including peak and residual, were nearly twice as high as for the saturated sample. This result supported the assumption that the landslide was lubricated by the abundant pore water at the base of the landslide. A comparison of the ring-shear test results with those from studies of less mobile landslides suggested that the observed strength loss was not sufficient to fully explain the landslide’s mobility. A more detailed geomorphological reconstruction of the landslide event and tests on other materials, including more sandy parts of the landfill materials, may be needed in order to better understand the mechanisms contributing to the landslide’s mobility.
《Fig. 21》

Fig.21 Results of ring-shear tests: effective stress path under normal stress of 200 kPa. (a) Result of ring-shear test on dry sample; (b) comparison of curve between dry and saturated samples.
《4.2. Dynamic simulation of long run-out motion》
4.2. Dynamic simulation of long run-out motion
This section used the LS-RAPID landslide dynamics computer software developed by Kyoto University to simulate the long run-out distance characteristics of the landslide. This software has successfully simulated the whole process of steady-state landslide failure, strength degradation after landslide failure, moving, and accumulation of landslides that occurred in the Philippines and in Japan [16]. The simulation took the pore pressure characteristics of the failure and of the post-failure of the landslide into account.
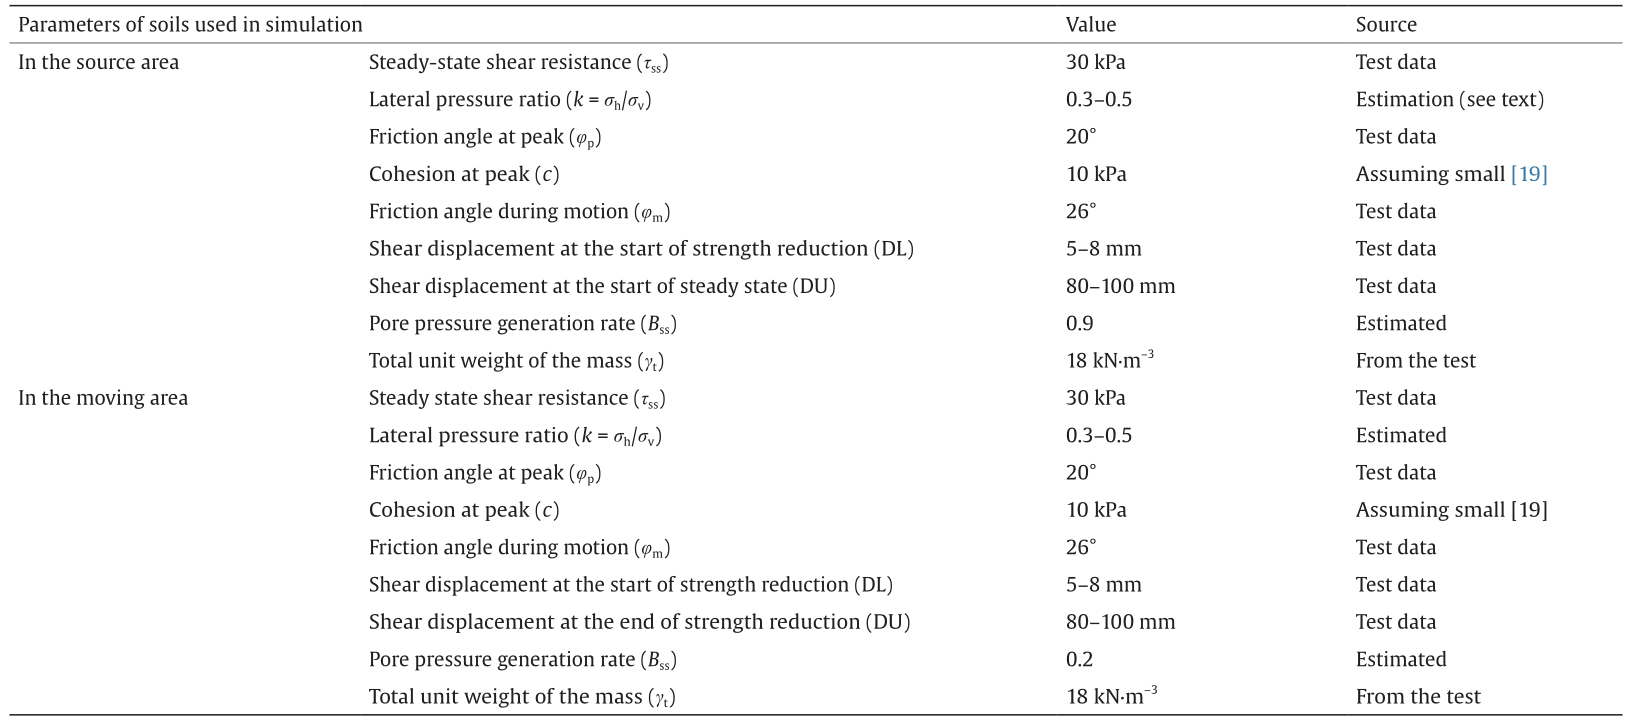
4.2.1. Dynamics parameters of landslide
Based on the ring-shear test and the physical and mechanical parameters, and from comparisons with other similar landslide cases, this section used the dynamics parameters shown in Table 9 (also see Tables 2 and 3).
《Table 9》
Table 9
Parameters chosen for the dynamic simulation of the run-out of the landslide.
4.2.2. Results of the dynamic simulation of the landslide
Fig. 22 shows the simulation result from LS-RAPID of the landslide at the Shenzhen landfill, showing landslide movement and accumulation at different times. The red grids represent moving landslide and the green grids represent the stable mountain and plain.
《Fig. 22》

Fig.22 Simulation result of the long run-out of the landslide at the Shenzhen landfill with LS-RAPID.
Fig. 22(a) at 0 s represents the initial state of the landslide, and embodies the morphological characteristics before the landslide failure.
Fig. 22(b) at 5 s represents the launch of the landslide. The whole slope failure starts to move downward, with a speed of 14 m·s–1 and a movement distance of 480 m.
Fig. 22(c) at 30 s represents the moving downward stage. The slide mass exits and the rear and its periphery collapse to the middle, with a maximum speed of 18 m·s–1 and a movement distance of 560 m.
Fig. 22(d) at 65 s represents the stage of continuous speed forward. The slide mass gradually disperses, with a maximum speed of 21.7 m·s–1 and a movement distance of 720 m.
Fig. 22(e) at 95 s represents the decelerated motion stage. The accumulation is changing constantly, with a maximum speed of 11.5 m·s–1 and a movement distance of 920 m.
Fig. 22(f) at 120 s represents the front accumulation stage. After dispersing over flat ground, the accumulation is still changing, with a maximum speed of 1.4 m·s–1 and a movement distance of 1060 m.
《4.3. Discussion on simulation result》
4.3. Discussion on simulation result
Part of the simulation result can be verified from the junction surveillance video at the Dejichengchang Road, provided by the Shenzhen Police Security Bureau (PSB), which shows the landfill failure of CSW from 11 h 28 m 29 s. After exiting off the initial failure surface, the major slide mass continuously moved forward over 600 m, being flow-like before coming to rest. From the surveillance video it can be estimated that the deposition ceased after about 11 h 41 m and that main movement lasted about 150 s.
In our simulation of the process using LS-RAPID, the landslide moved downward, exited off the landfill, and formed a long run-out. The landslide mass spread over a flat piece of open land in the front zone before coming to rest. In the simulation, the maximum speed was about 29.8 m·s–1, the maximum accumulation thickness was about 23 m, the movement distance was about 610 m, the main moving period of the slide mass was about 130 s, and its apparent friction angle was 6° (Fig. 23, also see Fig. 5).
《Fig. 23》

Fig.23 Simulation result of the run-out velocity of the landslide at the Shenzhen landfill with LS-RAPID. (a) Velocity vs. time; (b) velocity vs. distance.
《5. Geotechnical risk analysis on landfill》
5. Geotechnical risk analysis on landfill
One of the serious problems faced by many countries is the improper management of growing quantities of MSW (Table 10). Large waste dumps are being created in developing countries such as Brazil, China, India, Indonesia, and the Philippines, while very large engineered landfills are being built in developed countries such as the United States. Uncontrolled large dumps or even large engineered landfills can pose serious physical and environmental problems if the slopes are not properly designed, constructed, and maintained [1]. Effective management of geotechnical risks is supremely important in MSW landfills [27]. McMahon [28] described three main types of risk associated with geotechnical design: encountering an unknown geological condition, using the wrong geotechnical design criteria, and bias variation in the design parameters being greater than estimated. Clayton [29] divided geotechnical risk into technical, contractual, and project management. This paper discusses the geotechnical risk of the landslide at the Shenzhen landfill, in order to provide those dealing with urbanization with some lessons for siting, design, construction, operation, and the management of landfills.
《Table 10 》
Table 10
Some selections of documented landslide events in landfills around the world [1].

《5.1. Design-induced risk》
5.1. Design-induced risk
According to the construction design drawing, the landfill designers set some drainage systems on the surface of the landfill slope, such as a flood-intercepting trench, a drainage trench, and a torrent tank. Among these, a near-surface drainage facility, such as a blind pipe, was set in the front zone, and a superficial impermeable drainage layer was set only on terraces T4 and T7. Although this kind of drainage system can prevent the infiltration of near-surface water, it cannot drain the bottom groundwater in the ponding zone at the rear of the landfill. In order to analyze the landslide risk brought about by design mistakes in the groundwater drainage system, this study compared the three following drainage conditions, using the same physical parameters and simulation conditions discussed in previous sections.
5.1.1. Near-surface blind drainage
This scenario assumed that a 20 m blind drain was set on the slope to drain the groundwater (Fig. 24(a), also see Fig. 17). The groundwater seepage field in the landfill remained basically unchanged; only the groundwater level at the toe of the slope declined slightly. This scenario indicated that the blind drain was too short to effectively drain, and drained only nearby groundwater. It had a slight influence on the landslide with its FOS of 0.95, as shown in Fig. 25(a), but had a similar result to an undrained situation.
《Fig. 24》

Fig.24 Scenario assuming various drainages of groundwater: simulation result of seepage in the Shenzhen landfill before sliding. (a) Blind ditch on the surface of the slope; (b) drainage pipe in the front of the slope; (c) drainage pipe from the rear of the landfill.
5.1.2. Drainage pipe in the front of the slope
This scenario assumed that a 170 m culvert pipe was set on the raised bedrock under terraces T3 and T4 on the landfill slope to drain groundwater (Fig. 24(b), also see Fig. 17). The middle and back of the groundwater seepage field in the landfill had a subtle change, but an obvious change happened in the front, especially in the area with the raised bedrock. The pore water pressure essentially disappeared; the groundwater level in the toe of the slope declined, demonstrating a good drainage effect. The safety factor, FOS= 1.07, showed that the stability improved significantly, as shown in Fig. 25(b).
《Fig. 25》

Fig.25 Scenario assuming various drainages of groundwater: simulation result of FOS of possible failure slope in the Shenzhen landfill before sliding. (a) Blind ditch on the surface of the slope; (b) drainage pipe in the front of the slope; (c) drainage pipe from the rear of the landfill.
5.1.3. Drainage pipe from the rear of landfill
This scenario assumed that a 470 m culvert pipe was set, which extended to the rear of the landfill and connected with the gully. The pipe could drain the water flow of the gully and the groundwater in the slope (Fig. 24(c), also see Fig. 17). The groundwater seepage field in the landfill had an apparent change, in that the pore water pressure in the rear of the landfill declined from 800 kPa to 200 kPa and the pressure in the middle and front virtually disappeared, showing that the drainage effect was good. The safety factor, FOS= 1.89, as shown in Fig. 25(c), showed that the stability was very good.
5.1.4. Comparison of four operating modes
Fig. 26 compares the changing FOS conditions under the four alternative operating modes, over a period of 60 days before the landslide, from October 20, 2015. First, with the infiltration of surface water and under the circumstance of not setting a drainage system, the FOS of the possible failure slope declined from 1.42 to 0.92, showing that a landslide occurred. Second, assuming that a near-surface blind drain was set in the front zone, the FOS declined from 1.52 to 0.95, showing that a landslide still happened. Third, assuming that a 170 m culvert pipe was set on the raised bedrock under terraces T3 and T4, the FOS declined from 1.67 to 1.07, showing that the stability of the slope was good. Fourth, assuming that a drainage pipe was set from the rear of the landfill, the FOS of the possible failure slope remained at 1.89, showing that the stability of the slope was very good.
《Fig. 26》
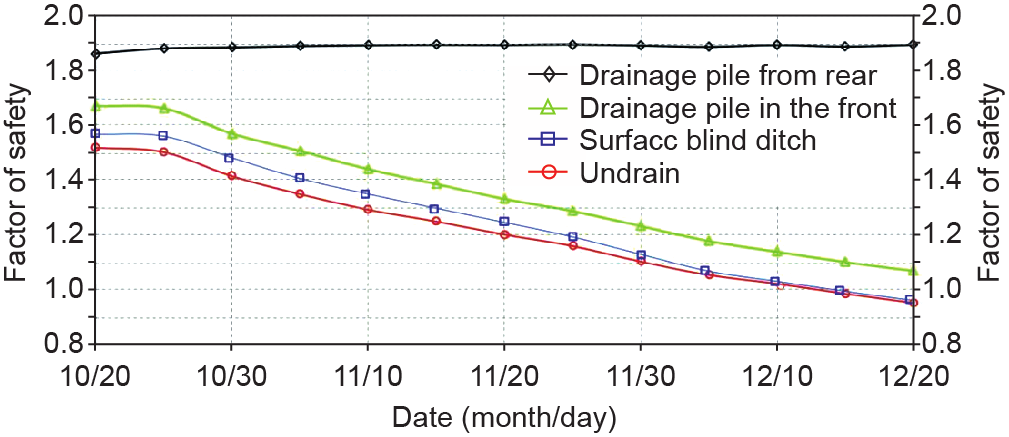
Fig.26 Comparison of FOS of possible failure slope between undrain and scenario assuming various drainage of groundwater in the Shenzhen landfill before sliding.
If a reasonable drainage system had been set at the bottom of the landfill, the risk could have been avoided.
《5.2. Emergency-induced risk》
5.2. Emergency-induced risk
Our visit to the site suggested that precursors indicating a forthcoming landslide at the Shenzhen landfill were very clear. The following indicators were present in the monthly report issued by management on November 21, 2015: ① A slight sink occurred on terrace T3; ② a drainage trench was fractured after the rush of rain; and ③ since November 26, some cracks had occurred in the slope between terraces T3 and T4. According to eyewitnesses, at about 6 a.m. on the day of the landslide, December 20, 2015, workers discovered bulges, cracking, and deformation of the slope between terraces T3 and T4. Meanwhile, a crack with a length of several tens of meters and a width of 0.4 cm occurred at the top of the landfill. Workers filled the crack with soil. By 9 a.m., the crack was longer and wider, and the workers stopped filling it.
We calculated the FOS for the front slope of the fifth placing stage. The result showed that because of the excess pore water pressure that existed on the raised area of bedrock, the FOS of a local landslide in the front landfill slope was 0.737, which was obviously lower than the whole landslide FOS (also see Fig. 17(c)). This result verified the reliability of witnesses’ descriptions that many cracks occurred between terraces T3 and T4 several hours before the slide. Therefore, if the emergency preparedness steps of evacuating the people in the risk zone had been formulated and implemented when the cracks were first noticed, the risk to life safety could have been prevented.
《5.3. Construction-induced risk》
5.3. Construction-induced risk
Witness interviews and explorations in the field revealed that: ① The flood-intercepting trench had not been constructed in the rear zone as required by the designers; ② high-water-content CSW was directly discharged into the landfill without air-curing or mixing with dry soil; ③ the available volume of the open pit had been exhausted with a water volume of 80 000–90 000 m3 before the placement of the CSW; and ④ the CSW placement involved overloading and was done too fast. This landfill had placed 5.83×10⁶ m3 of CSW, clearly exceeding the original design limit of 4×10⁶ m3.
Based on the five CPTs conducted during the field investigation, the compactness of the majority of the CSW in the landfill was 40%–80%. Some black silt layers existed with high water contents of 40%–48%. If the placing schedule had been effectively controlled and the fresh CSW appropriately rolled, so that the compactness of the CSW met the design needs of 95%, the moisture content would have obviously been lower.
The dry and saturated ring-shear test for the soil samples from the landfill showed that the shear resistance of the saturated sample was about 75 kPa, and that of the dry sample was about 150 kPa: the former being 50% lower than the latter (Fig. 21). This finding also showed that if the placing speed had been controlled, the moisture content of the CSW could have been lower, and accordingly the shear resistance higher. At the same time, the apparent friction angle of the energy line would have been increased, thereby reducing the hazardous reach of a rapid long run-out landslide.
《5.4. Contract-induced risk》
5.4. Contract-induced risk
The investigation showed that company A, which was responsible for this landfill construction project, had no related qualifications and illegally borrowed the qualifications of company B. The related technology service organizations did not fulfill their contractual obligations in accordance with the law. In September, 2015, after signing a design contract with company A, company C did not conduct the design, but directly stamped the drawing provided by company A. Company D signed two supervision contracts with company A, but in the process of construction and operation, company D did not arrange for any staff to supervise the construction quality.
《5.5. Siting-induced risk》
5.5. Siting-induced risk
This landfill was listed in the special planning of landfill construction from 2011 to 2020 and was ratified by Shenzhen authorities. However, there are two newly-built industrial zones, one of which is only 154 m, and the other 300 m, from the base of the landfill. Some temporary living houses were even built only 60 m from the landfill. This siting risk existed because of the lack of an effective buffer zone.
Five obvious geotechnical risk issues existed at the landfill, of design, emergency, construction, contract, and siting. In terms of technology, these were all foreseeable; however, due to non-technical reasons, these risks were not foreseen. Therefore, in construction for urbanization, it is necessary to enhance control over both technological and non-technological geotechnical risks.
《6. Conclusions》
6. Conclusions
We applied a multistage modeling technique to study the various characteristics of the CSW landfill slope structure during the five phases of CSW placement, and used non-steady fluid flow theory to analyze the groundwater seepage affecting the landfill. The results show that the landfill could be divided into two units: the front unit (the landfill slope), with low water content, and the rear unit (fresh waste), with ponded water and high moisture levels. This structure created two effects—surface-water infiltration and consolidation seepage to trigger the landslide at the landfill. We also used soil dynamic parameters of the landslide from cone penetration, triaxial, and ring-shear tests to simulate the characteristics of a flowing slide with a long run-out due to the liquefaction effect. The result suggested that the landslide had a maximum speed of about 29.8 m·s–1 with a maximum width of about 23 m, and traveled about 610 m in 130 s, at an apparent friction angle of 6°. Using lessons learned from catastrophic solid waste landfill landslides from around the world and errors made in managing the emerging geotechnical risks during the urbanization process in the area, we discussed how the catastrophic failure might have been avoided.
《Acknowledgements》
Acknowledgements
The authors express their gratitude to Professors Sijing Wang, Zuyu Chen, Manchao He, Yunmin Chen, Min Wang, Fengjun Guan, Zhongqi Yue, Aiguo Xing, and Gonghui Wang, as well as Dr. Yao Jiang for their kind supports and helps.
Yueping Yin, Bin Li, Wenpei Wang, Liangtong Zhan, Qiang Xue, Yang Gao, Nan Zhang, Hongqi Chen, Tiankui Liu, and Aiguo Li declare that they have no conflict of interest or financial conflicts to disclose.


 京公网安备 11010502051620号


